And What They Owned at Year-end
Though 2016 was a poor year for most institutional portfolio managers, it was a satisfactory year for the most skilled ones. Security selection returns of the top U.S. stock pickers in 2016 were positive. When hedged to match market risk, a consensus portfolio of the top intuitional U.S. stock pickers outperformed the Market by approximately 2%.
This article demonstrates how a robust equity risk model and predictive performance analytics identify the top stock pickers – the hard part of measuring investment skill. Since genuine investment skill persists, the top stock pickers of the past tend to generate positive stock picking returns in the future. We illustrate this performance and share the top consensus positions driving it. These consensus positions of the top U.S. stock pickers are a profitable resource for investors searching for ideas. The method for tracking the top active managers and this method’s performance are benchmarks against which capital allocators can evaluate qualitative and quantitative manager selection processes.
Identifying the Top U.S. Stock Pickers
This study updates our analysis for 2015 and follows a similar method: We analyzed long U.S. equity portfolios of all institutions that have filed Forms 13F. This survivorship-free portfolio database comprises thousands of firms. The database covers all institutions that have managed over $100 million in long U.S. assets. Some of these firms were not suitable for skill evaluation, for instance due to short filings histories or high turnover. Approximately 4,000 firms were evaluated.
During bullish market regimes, the top-performing portfolios are those that take the most factor (systematic) risk. During bearish market regimes, the top-performing portfolios are those that take the least risk. Hence, when the regimes change the leaders revert. This is the main reason nominal returns and related simplistic metrics of investment skill (Sharpe Ratio, Win/Loss Ratio, etc.) revert and fail. This is also the evidence behind most purported proofs of the futility of active manager selection. These arguments assume that, since the flawed performance metrics are non-predictive, all performance metrics are non-predictive, and it is impossible to identify future outperformers.
To eliminate the systematic noise that is the source of performance reversion, the AlphaBetaWorks Performance Analytics Platform calculates portfolio return from security selection – αReturn. αReturn is the performance a portfolio would have generated if all factor returns had been flat. This is the estimated residual performance due to stock picking skill, net of all factor effects. Each month we identify the top five percent among 13F-filers with the most consistently positive αReturns over the prior 36 months. This expert panel of the top stock pickers typically includes 100-150 firms. Data is lagged 2 months to account for the filing delay. We construct the aggregate expert portfolio (the ABW Expert Aggregate) by equal-weighting the expert portfolios and position-weighting stocks within the expert portfolios.
Manager fame and firm size are poor proxies for skill. Consequently, the ABW Expert Aggregate is an eclectic collection that includes hedge funds and asset management firms, banks, endowments, trust companies, and other institutions.
Market-Neutral Performance of the Top U.S. Stock Pickers
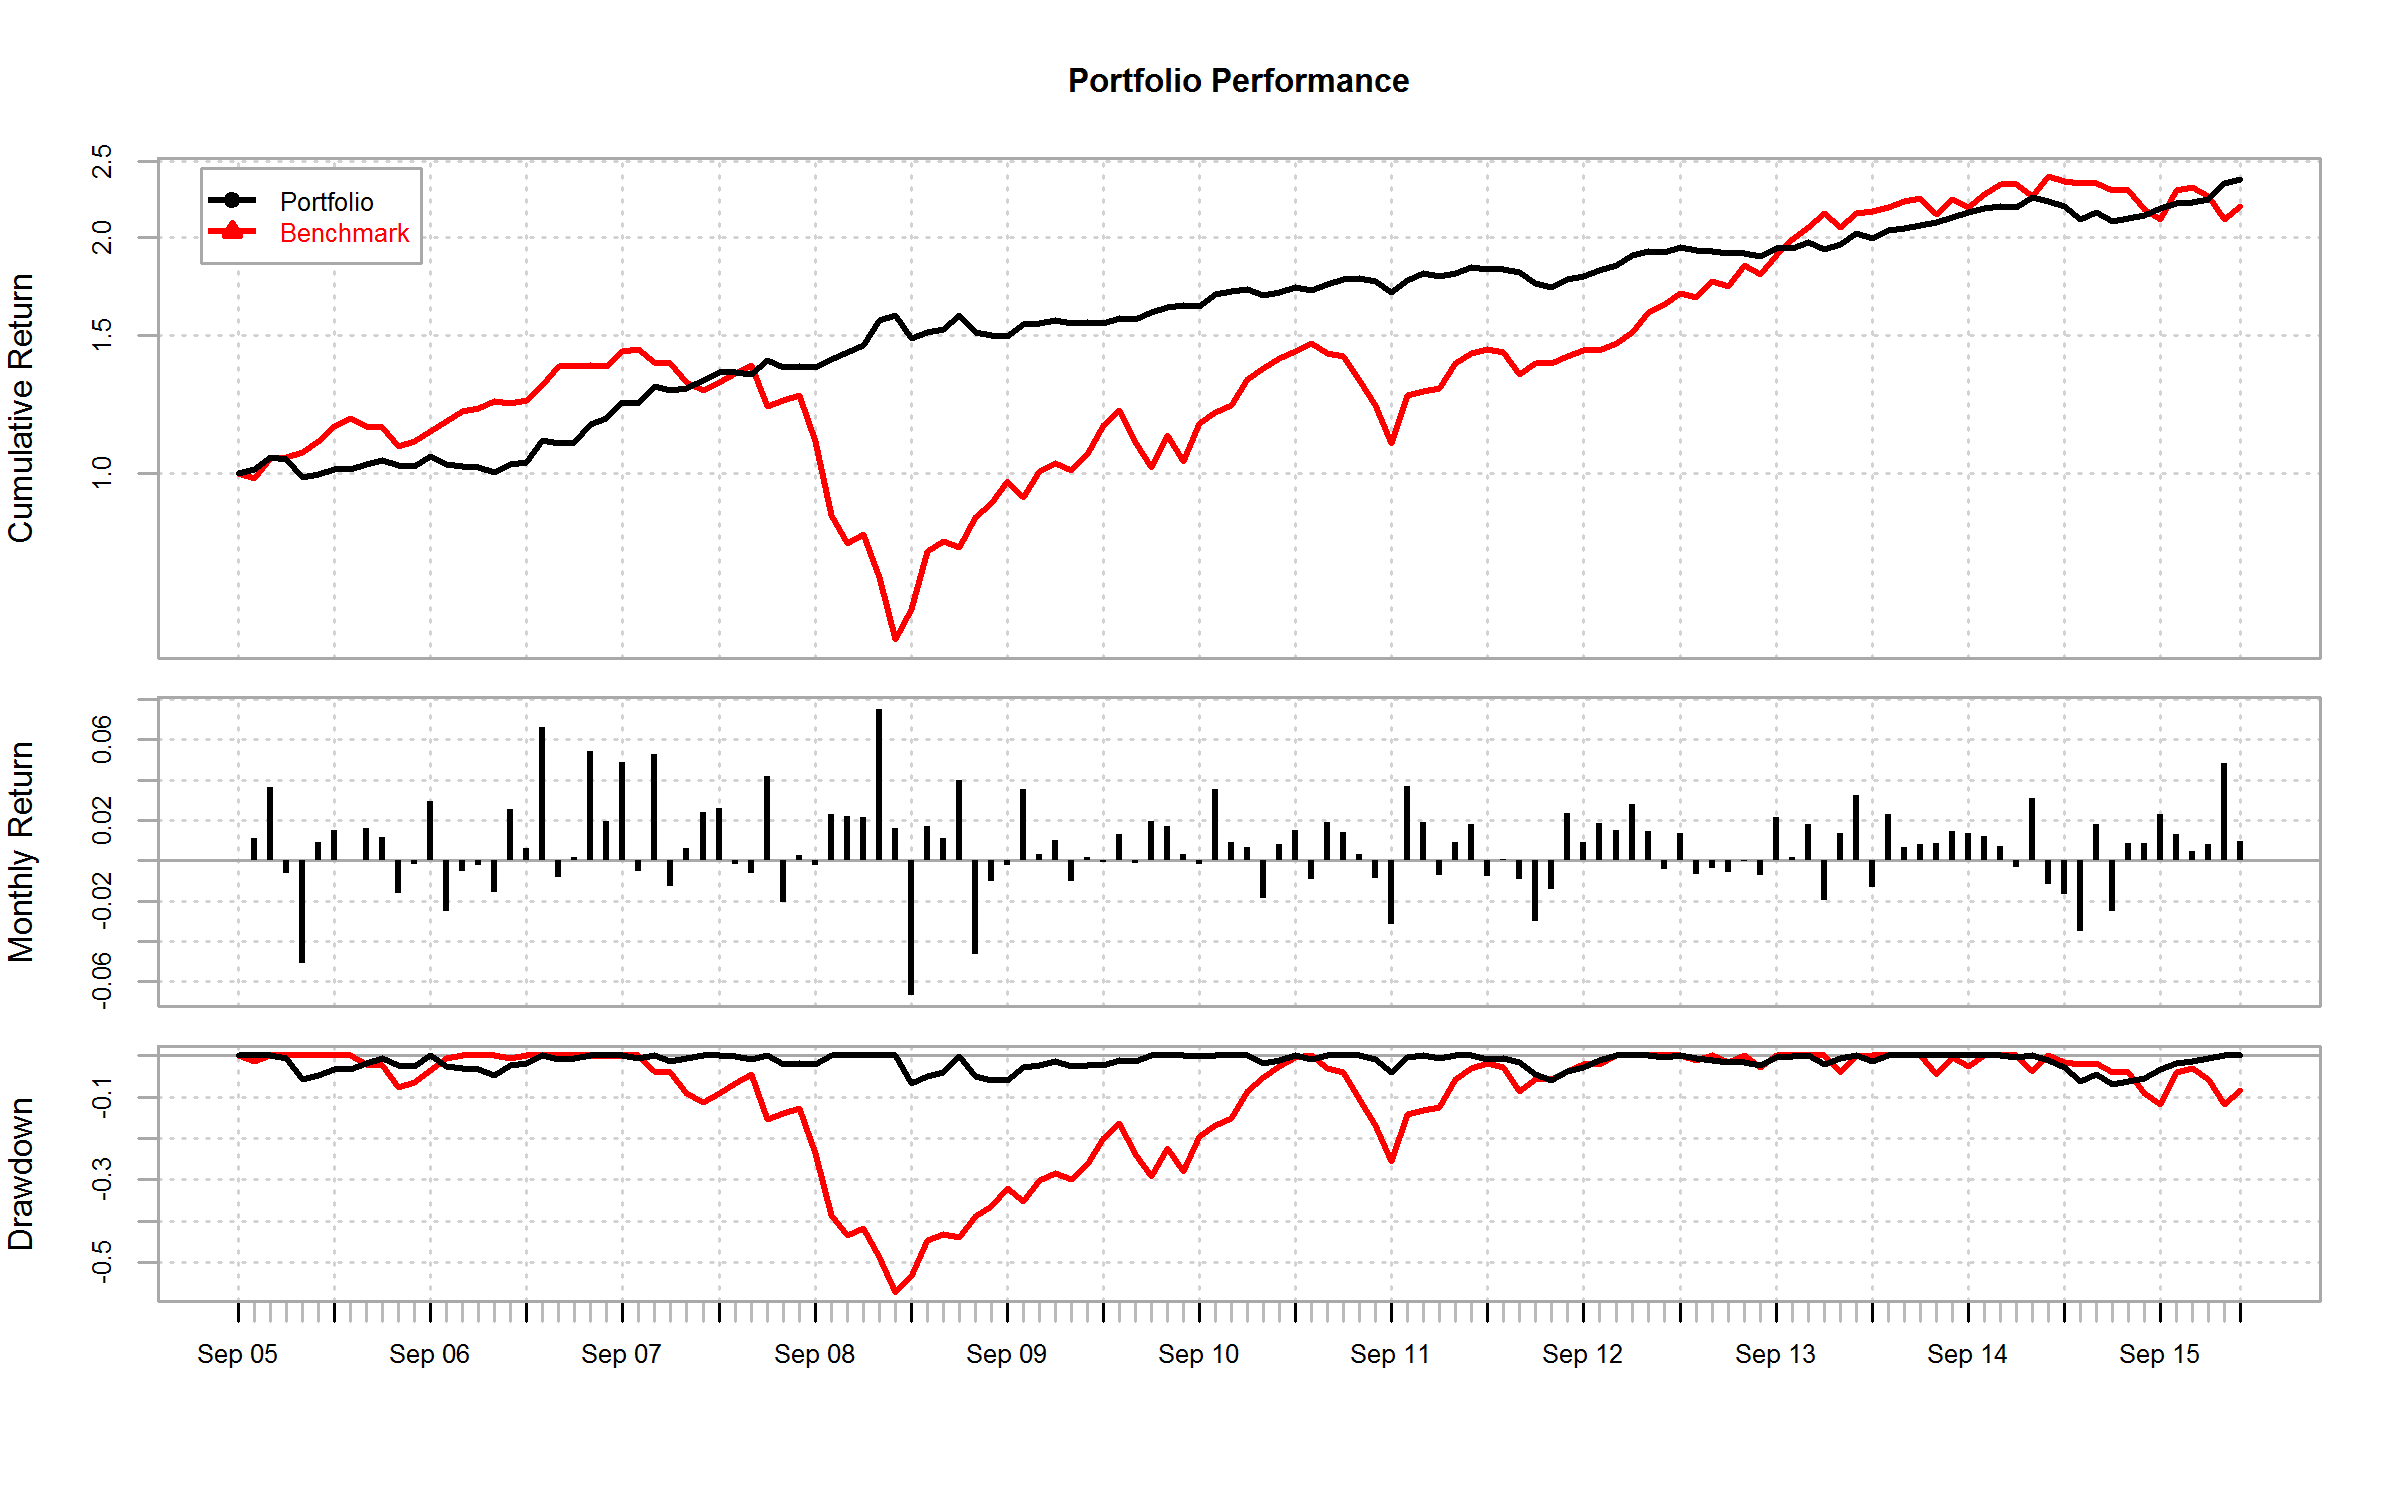
Since security selection skill persists, portfolios that have generated positive αReturns in the past are likely to generate them in the future. Consequently, a hedged aggregate of such portfolios (the Market-Neutral ABW Expert Aggregate) delivers consistent positive returns:

Cumulative Market-Neutral Portfolio Return: Top U.S. Stock Pickers’ Net Consensus Longs
| 2005 | 2006 | 2007 | 2008 | 2009 | 2010 | 2011 | 2012 | 2013 | 2014 | 2015 | 2016 | |
| Market-Neutral ABW Expert Aggregate |
4.15 | 14.43 | 12.74 | 5.95 | -1.25 | 15.35 | 2.20 | 2.24 | 15.47 | 8.81 | 13.16 | 1.72 |
| iShares Russell 3000 ETF |
6.08 | 15.65 | 4.57 | -37.16 | 28.21 | 16.81 | 0.78 | 16.43 | 32.97 | 12.41 | 0.34 | 12.61 |
ABW Expert Aggregate outperformed the broad market with less than half the volatility:
| Market-Neutral ABW Expert Aggregate |
iShares Russell 3000 ETF | |
| Annualized Return | 7.69 | 7.49 |
| Annualized Standard Deviation | 5.29 | 14.71 |
| Annualized Sharpe Ratio (Rf=0%) | 1.45 | 0.51 |
There are several ways to reconcile the positive stock picking performance above with the apparently challenging environment for fundamental stock picking in 2016:
- Performance of an average manager is a poor proxy for the performance of a top manager.
- Some skilled managers may suffer from underdeveloped risk systems, and losses from hidden systematic risks conceal their stock-picking results.
- Many skilled stock pickers are poor market timers, or they may have experienced a challenging market-timing environment.
ABW Expert Aggregate is different than the crowded portfolios, which we have written about at length. Whereas crowded bets are shared by the entire universe of investors, ABW Expert Aggregate is a small subset covering the consistently best stock pickers. It is common for crowded hedge fund longs (overweights) to be shorts (underweights) of ABW Expert Aggregate, and vice versa.
Market Performance of the Top U.S. Stock Pickers
The Market-Neutral ABW Expert Aggregate is fully hedged. Accordingly, it has insignificant market exposure and will, by definition, underperform the Market during the bullish regimes. Therefore, the Market-Neutral ABW Expert Aggregate is not suitable as a core holding and is not directly comparable to long portfolios.
The aggregate portfolio of the top stock pickers can be hedged to match the market risk. This portfolio (the Market-Risk ABW Expert Aggregate) delivers consistent outperformance, instead of the consistent absolute returns of the Market-Neutral ABW Expert Aggregate:

Cumulative Market-Risk Portfolio Return: Top U.S. Stock Pickers’ Net Consensus Longs
| 2005 | 2006 | 2007 | 2008 | 2009 | 2010 | 2011 | 2012 | 2013 | 2014 | 2015 | 2016 | |
| Market-Risk ABW Expert Aggregate |
10.43 | 32.20 | 17.32 | -33.79 | 26.43 | 34.52 | 2.78 | 19.15 | 52.93 | 22.07 | 13.10 | 14.77 |
| iShares Russell 3000 ETF |
6.08 | 15.65 | 4.57 | -37.16 | 28.21 | 16.81 | 0.78 | 16.43 | 32.97 | 12.41 | 0.34 | 12.61 |
| Market-Risk ABW Expert Aggregate |
iShares Russell 3000 ETF | |
| Annualized Return | 15.53 | 7.49 |
| Annualized Standard Deviation | 16.57 | 14.71 |
| Annualized Sharpe Ratio (Rf=0%) | 0.94 | 0.51 |
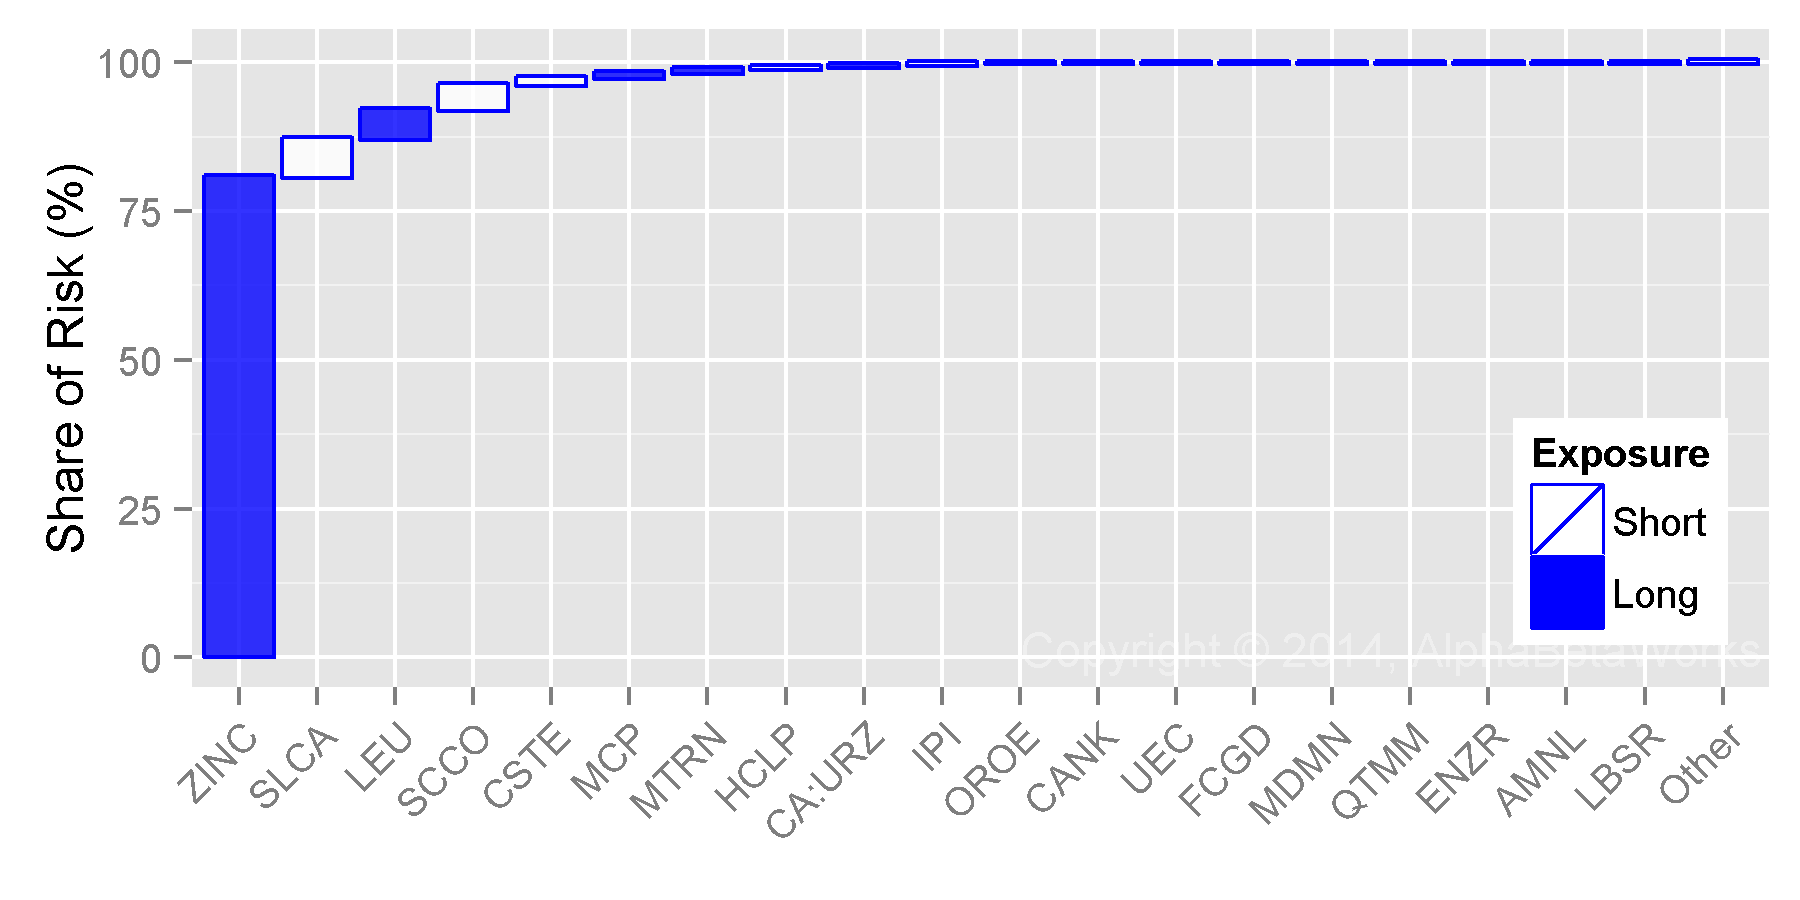
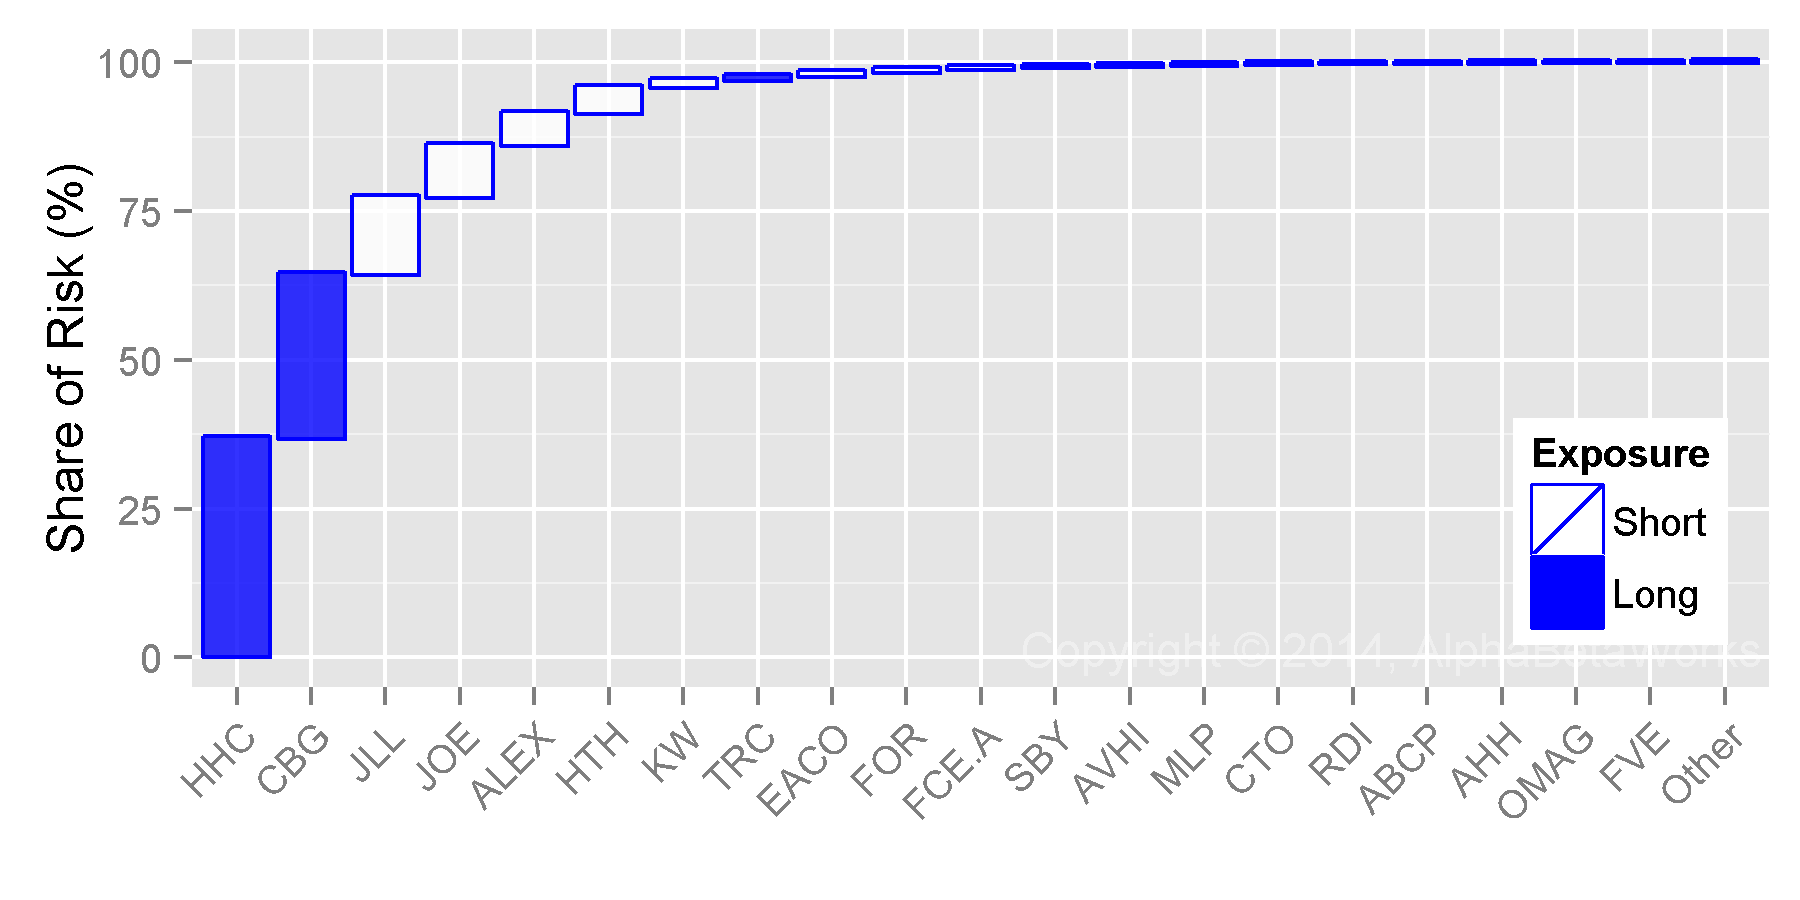
Top U.S. Stock Pickers’ Consensus Positions
Just as few celebrated firms were the top U.S. stock pickers in 2016, few celebrated stocks were their top ideas. Below are the top 10 consensus overweights of the ABW Expert Aggregate at year-end 2016:
| Symbol | Name | Exposure (%) | |
| EA | Electronic Arts Inc. | 1.41 | |
| NTES | NetEase, Inc. | 1.00 | |
| OXY | Occidental Petroleum Corporation | 0.69 | |
| PXD | Pioneer Natural Resources | 0.68 | |
| PEP | PepsiCo, Inc. | 0.63 | |
| SCHW | Charles Schwab Corporation | 0.55 | |
| ACN | Accenture Plc | 0.52 | |
| JNJ | Johnson & Johnson | 0.48 | |
| NKE | NIKE, Inc. | 0.46 | |
| V | Visa Inc. | 0.44 | |
Many of these positions remained since year-end 2015, illustrating the stability of the ABW Expert Aggregate.
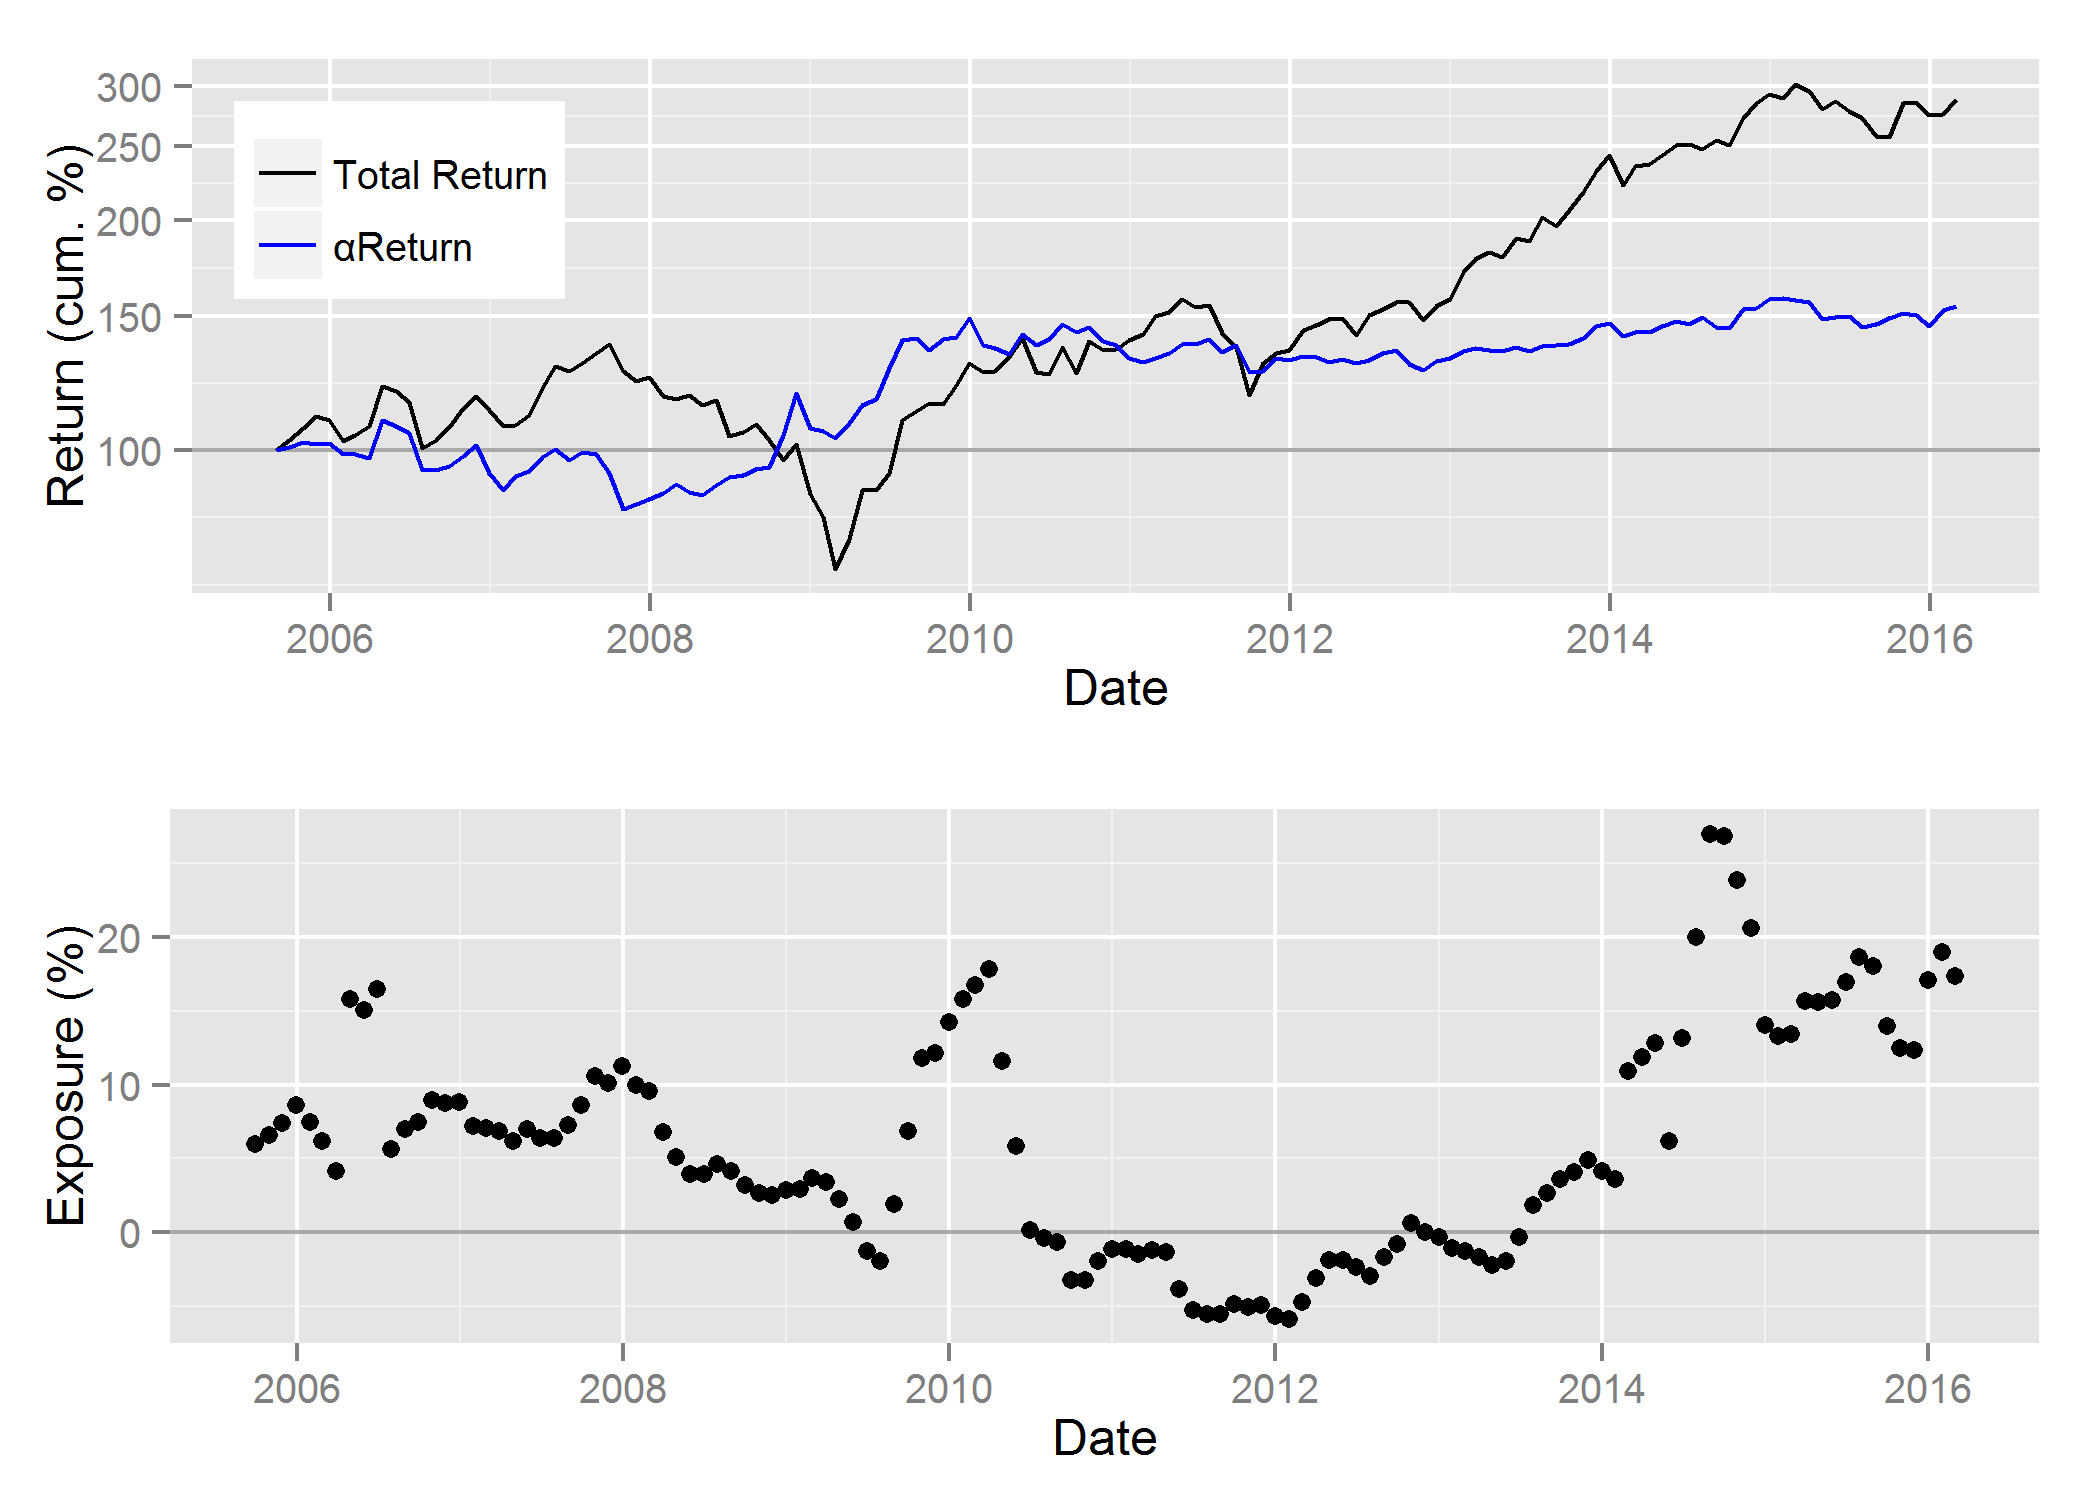
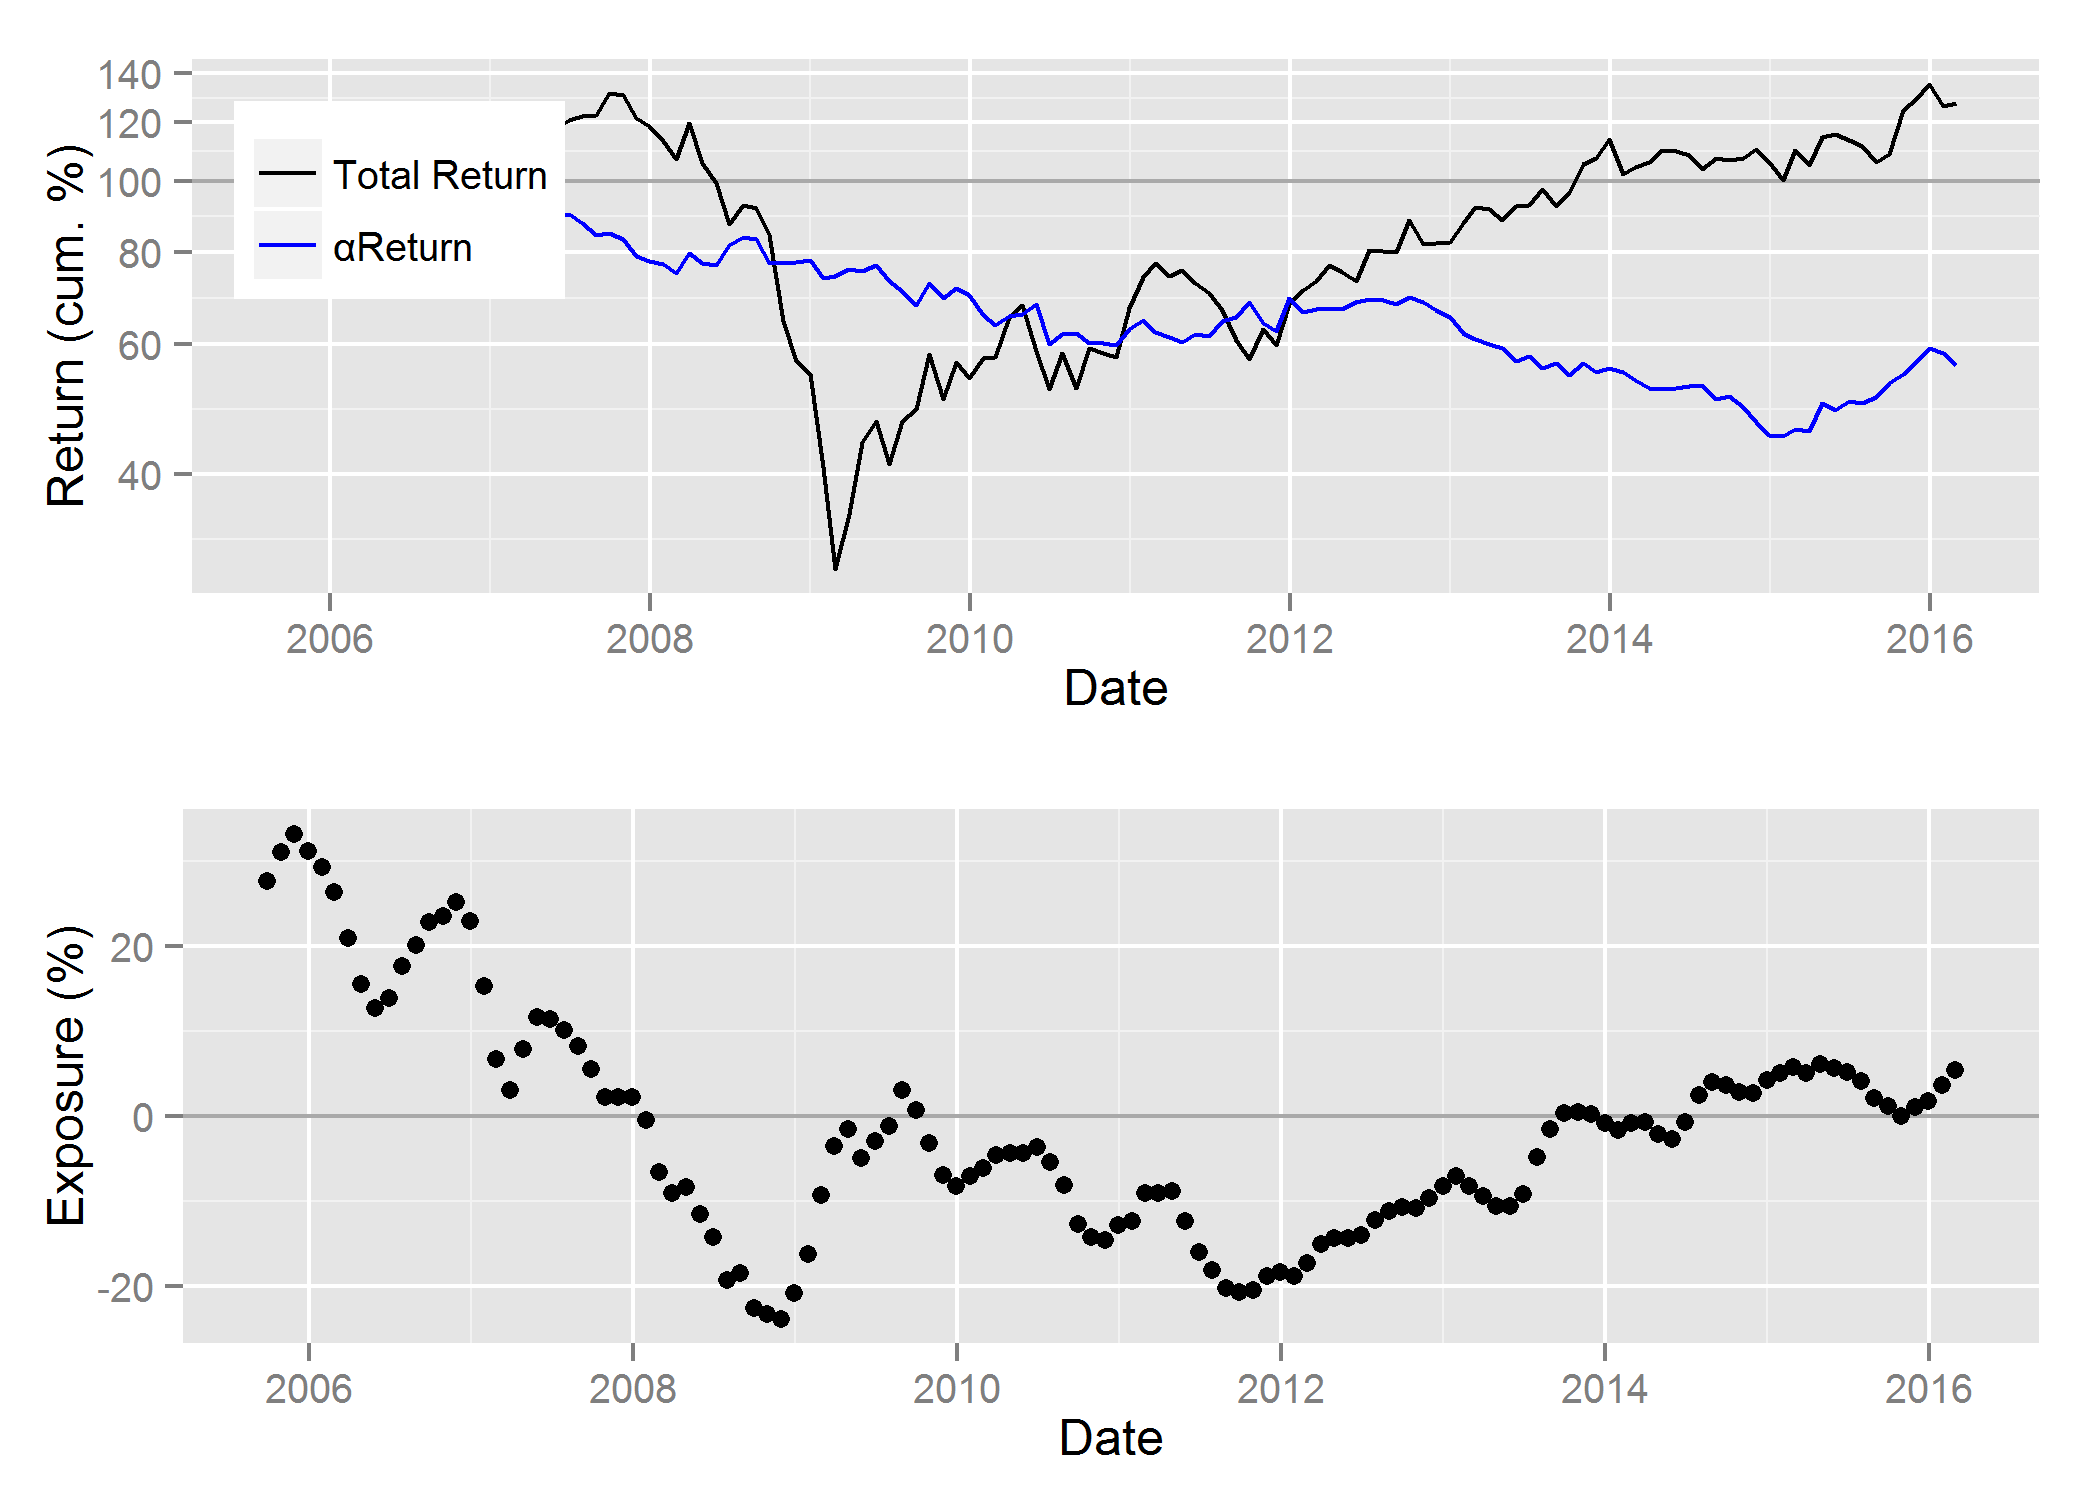
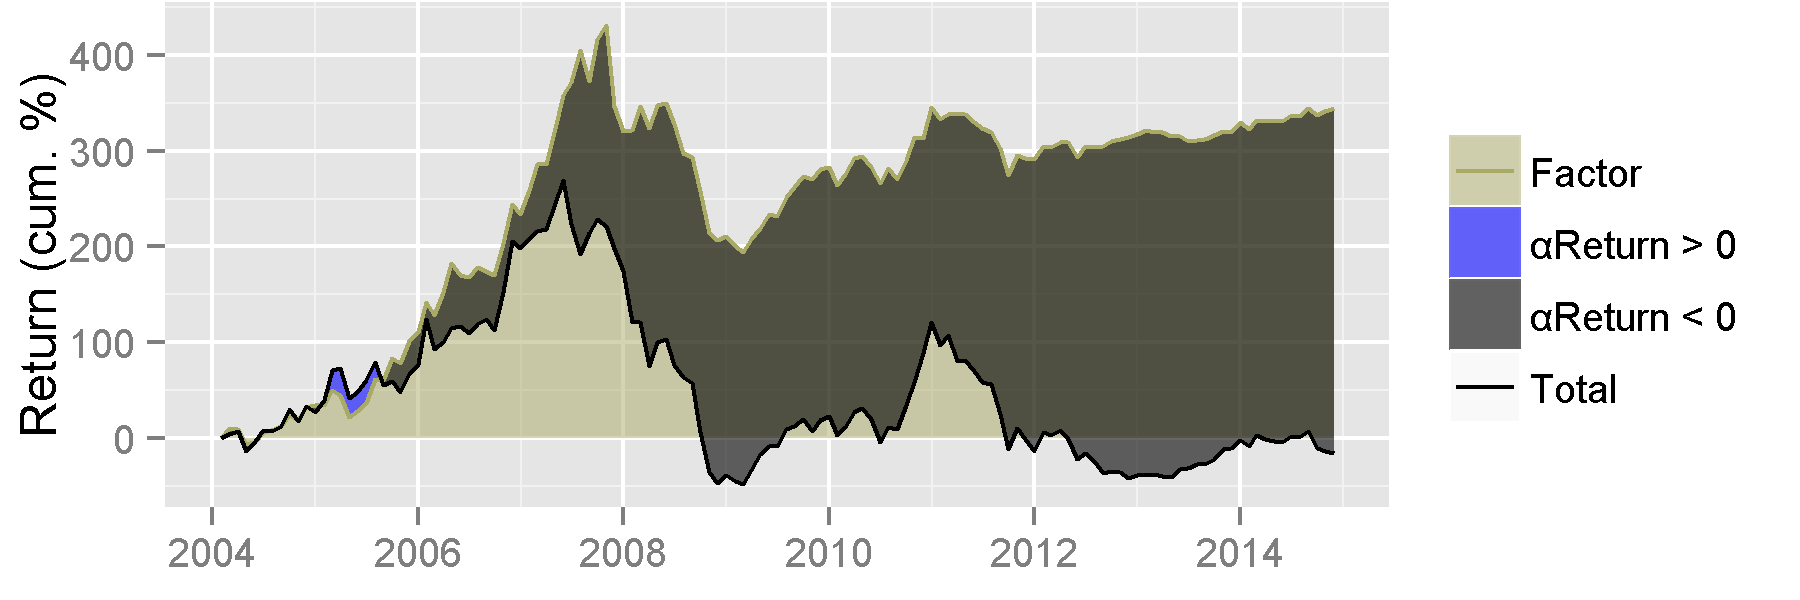
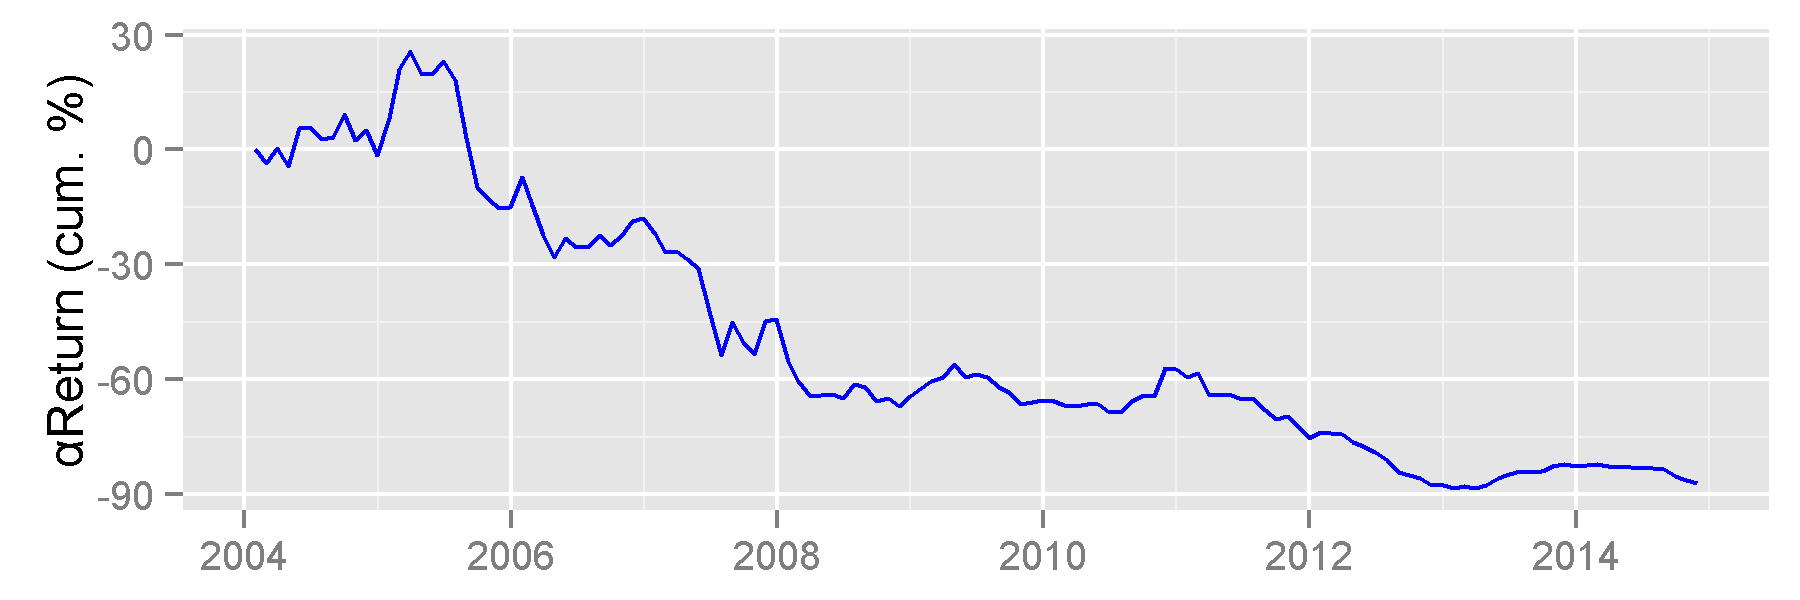
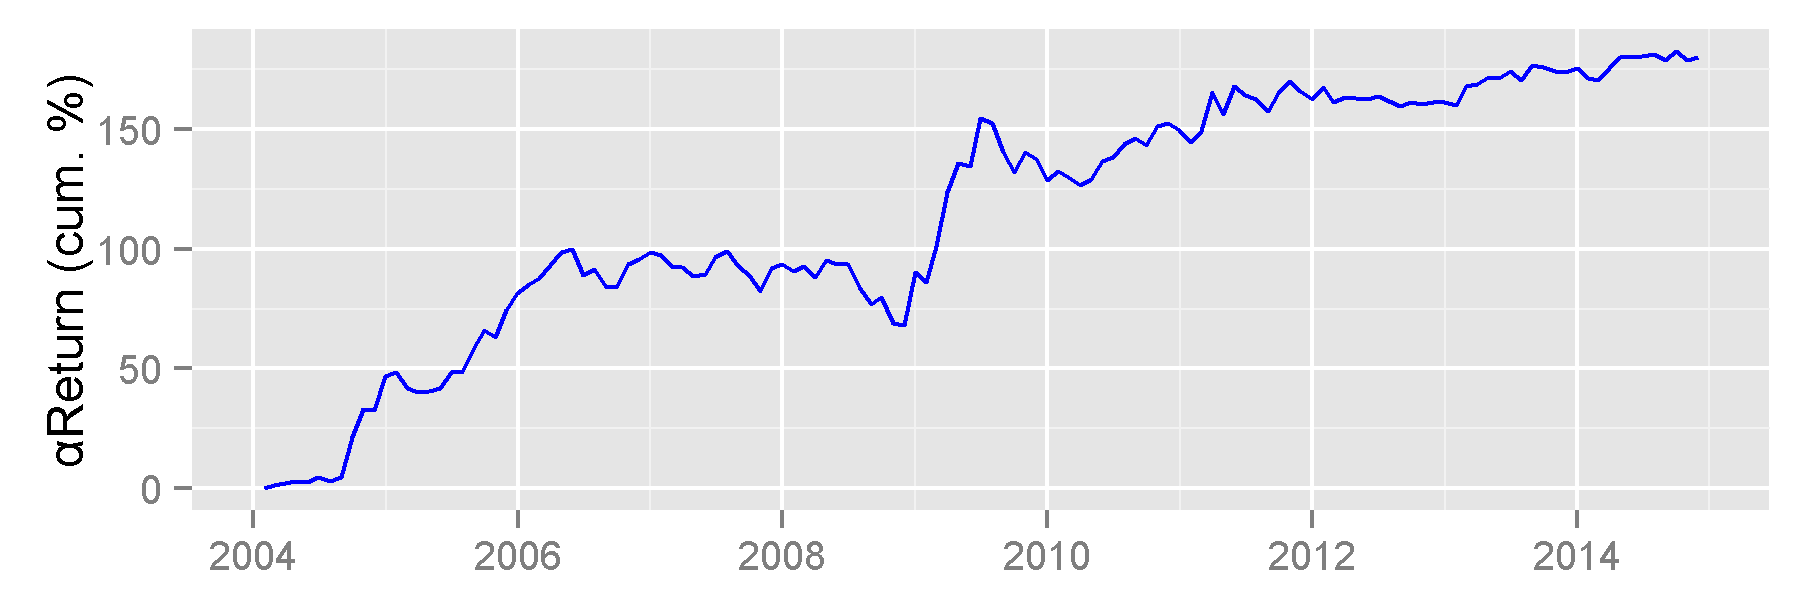
Top Stock Pickers’ Exposure to Electronic Arts (EA)
The top panel on the following chart shows EA’s cumulative nominal return in black and cumulative residual return (αReturn) in blue. Recall that residual return or αReturn is the performance EA would have generated if all factor returns had been zero. The bottom panel shows exposure to EA within the ABW Expert Aggregate. Top stock pickers had negligible exposure to EA until 2015. In early-2015 EA became one of the largest exposures within the Expert Aggregate, and it remained a top position through 2016:

Cumulative αReturns of EA and Exposure to EA within the Hedged Portfolio of the Top U.S. Stock Pickers’ Net Consensus Longs
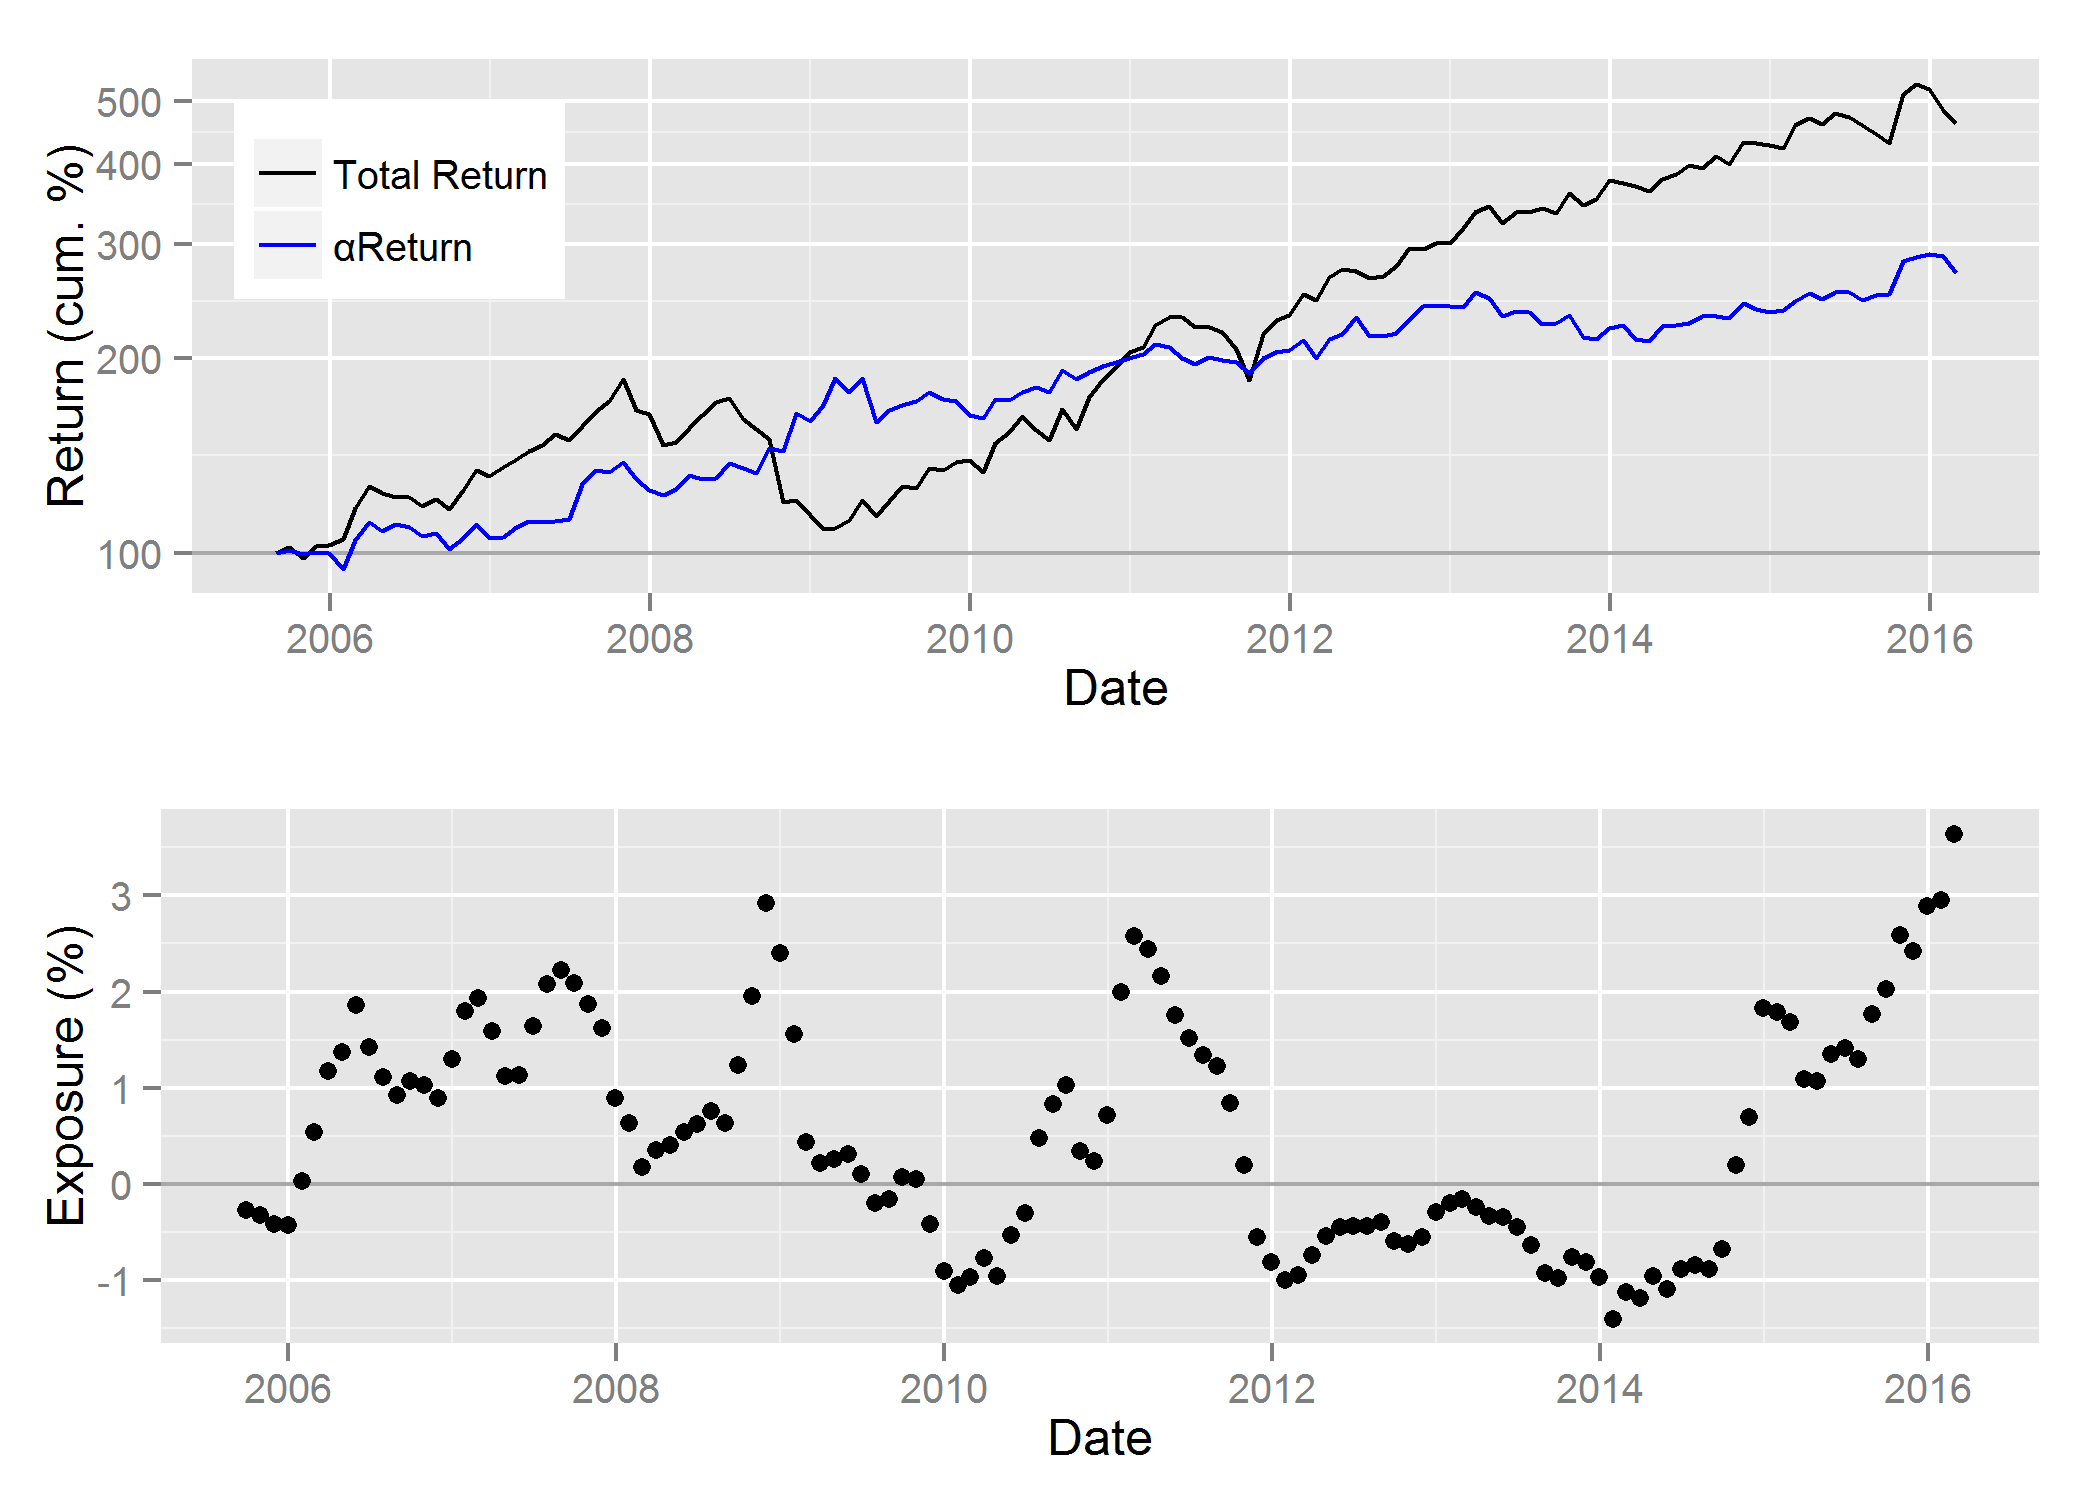
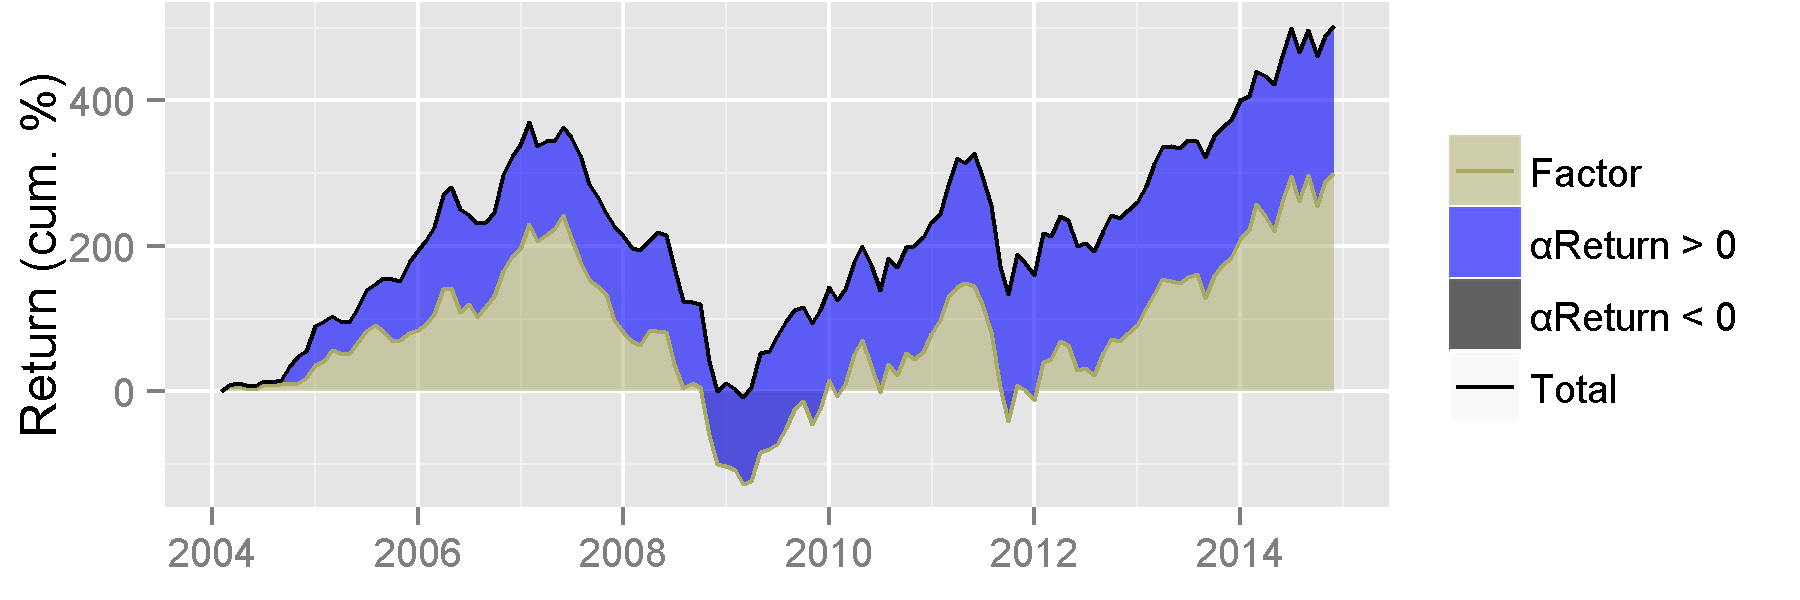
Top Stock Pickers’ Exposure to NetEase (NTES)
ABW Expert Aggregate had negligible exposure to NTES until early 2016. NTES became a consensus long by early-2016. The strong positive αReturn of NTES continued through 2016:

Cumulative αReturns of NTES and Exposure to NTES within the Hedged Portfolio of the Top U.S. Stock Pickers’ Net Consensus Longs
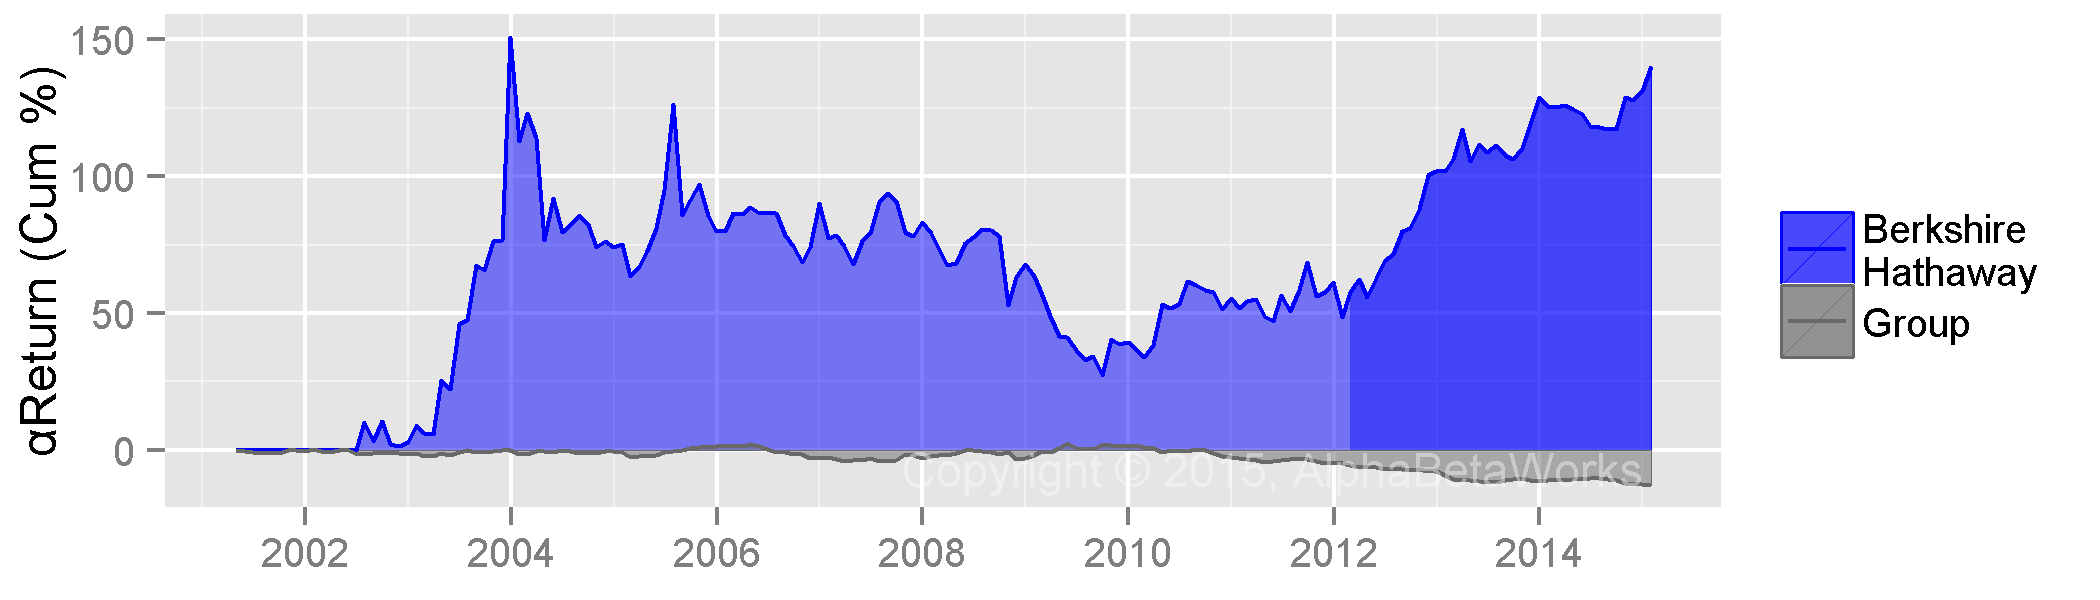
Top Stock Pickers’ Exposure to Occidental Petroleum (OXY)
The Aggregate was mostly underweight (short) OXY between 2010 and 2016. This means that the top U.S. stock pickers were underweight the stock. Their exposure to OXY grew through 2016 and by year-end it was a top bet. The smart money has added to OXY in 2016 even as it underperformed:

Cumulative αReturns of OXY and Exposure to OXY within the Hedged Portfolio of the Top U.S. Stock Pickers’ Net Consensus Longs
Conclusions
- Robust equity risk models and predictive performance analytics can identify the top stock pickers in the sea of mediocrity.
- The market-neutral aggregate of the top stock pickers’ portfolios delivers consistent absolute performance.
- The aggregate of the top stock pickers’ portfolios matching market risk delivers consistent outperformance relative to the Market.
- Consensus portfolio of the top stock pickers is a profitable source of investment ideas.
- Provided they control properly for systematic (factor) effects, simple rules for manager selection tend to select future outperformers.