
U.S. hedge funds share a few systematic and idiosyncratic long bets – a phenomenon called “crowding.” Crowding exists within aggregate portfolios and within specific sectors. Energy bets are particularly crowded and are the subject of this article. Crowded bets are the main sources of hedge funds’ collective and many individual funds’ energy sector returns. Four risk factors (systematic bets) and six stocks (idiosyncratic bets) are behind three quarters of the herding.
Systematic (factor) hedge fund energy crowding primarily consists of:
- A bet against integrated energy companies;
- A bet on oil refiners;
- A bet on cheap international and against expensive U.S. producers;
- A bet on independent oil and gas producers.
Idiosyncratic (residual) hedge fund energy sector crowding primarily consist of exposures to CVI, XOM, CHK, ATHL, CVX, and
Combined, these bets account for three quarters of aggregate hedge fund long energy sector risk (tracking error) relative to the overall energy equity market.
Crowding has two vital implications: First, hedge fund impatience contributes to greater volatility in crowded bets. Second, hedge fund long energy equity portfolios tend to generate negative risk-adjusted returns. Thus, consensus stock and factor picks are likely to disappoint.
Identifying Hedge Fund Energy Crowding
We created an aggregate position-weighted portfolio (HF Energy Aggregate) consisting of all energy sector equities held by over 400 U.S. hedge funds with medium to low turnover. The size of each position is the dollar value of its ownership by hedge funds. This process is similar to our earlier analysis of aggregate long hedge fund crowding.
We then evaluated HF Energy Aggregate’s risk relative to the capitalization-weighted portfolio of U.S. energy equities (Market Energy Aggregate) using AlphaBetaWorks’ Statistical Equity Risk Model. Finally, we analyzed HF Energy Aggregate’s systematic and idiosyncratic bets and looked for evidence of crowding.
Hedge Fund Energy Risk
HF Energy Aggregate has a 7.8% estimated future tracking error relative to Market Energy Aggregate, mostly due to factor bets:
Sources of Relative Risk for Hedge Fund Energy Aggregate
| Source | Volatility (%) | Share of Variance (%) |
| Factor | 6.55 | 70.10 |
| Residual | 4.28 | 29.90 |
| Total | 7.83 | 100.00 |
HF Energy Aggregate’s annual return will differ from Market Energy Aggregate’s by more than 7.8% about one third of the time. Combined, hedge funds’ energy portfolios are active, and closet indexing is not a concern.
Hedge Fund Factor (Systematic) Energy Crowding
Below are HF Energy Aggregate’s most significant relative factor exposures (red). The benchmark (gray) is Market Energy Aggregate:
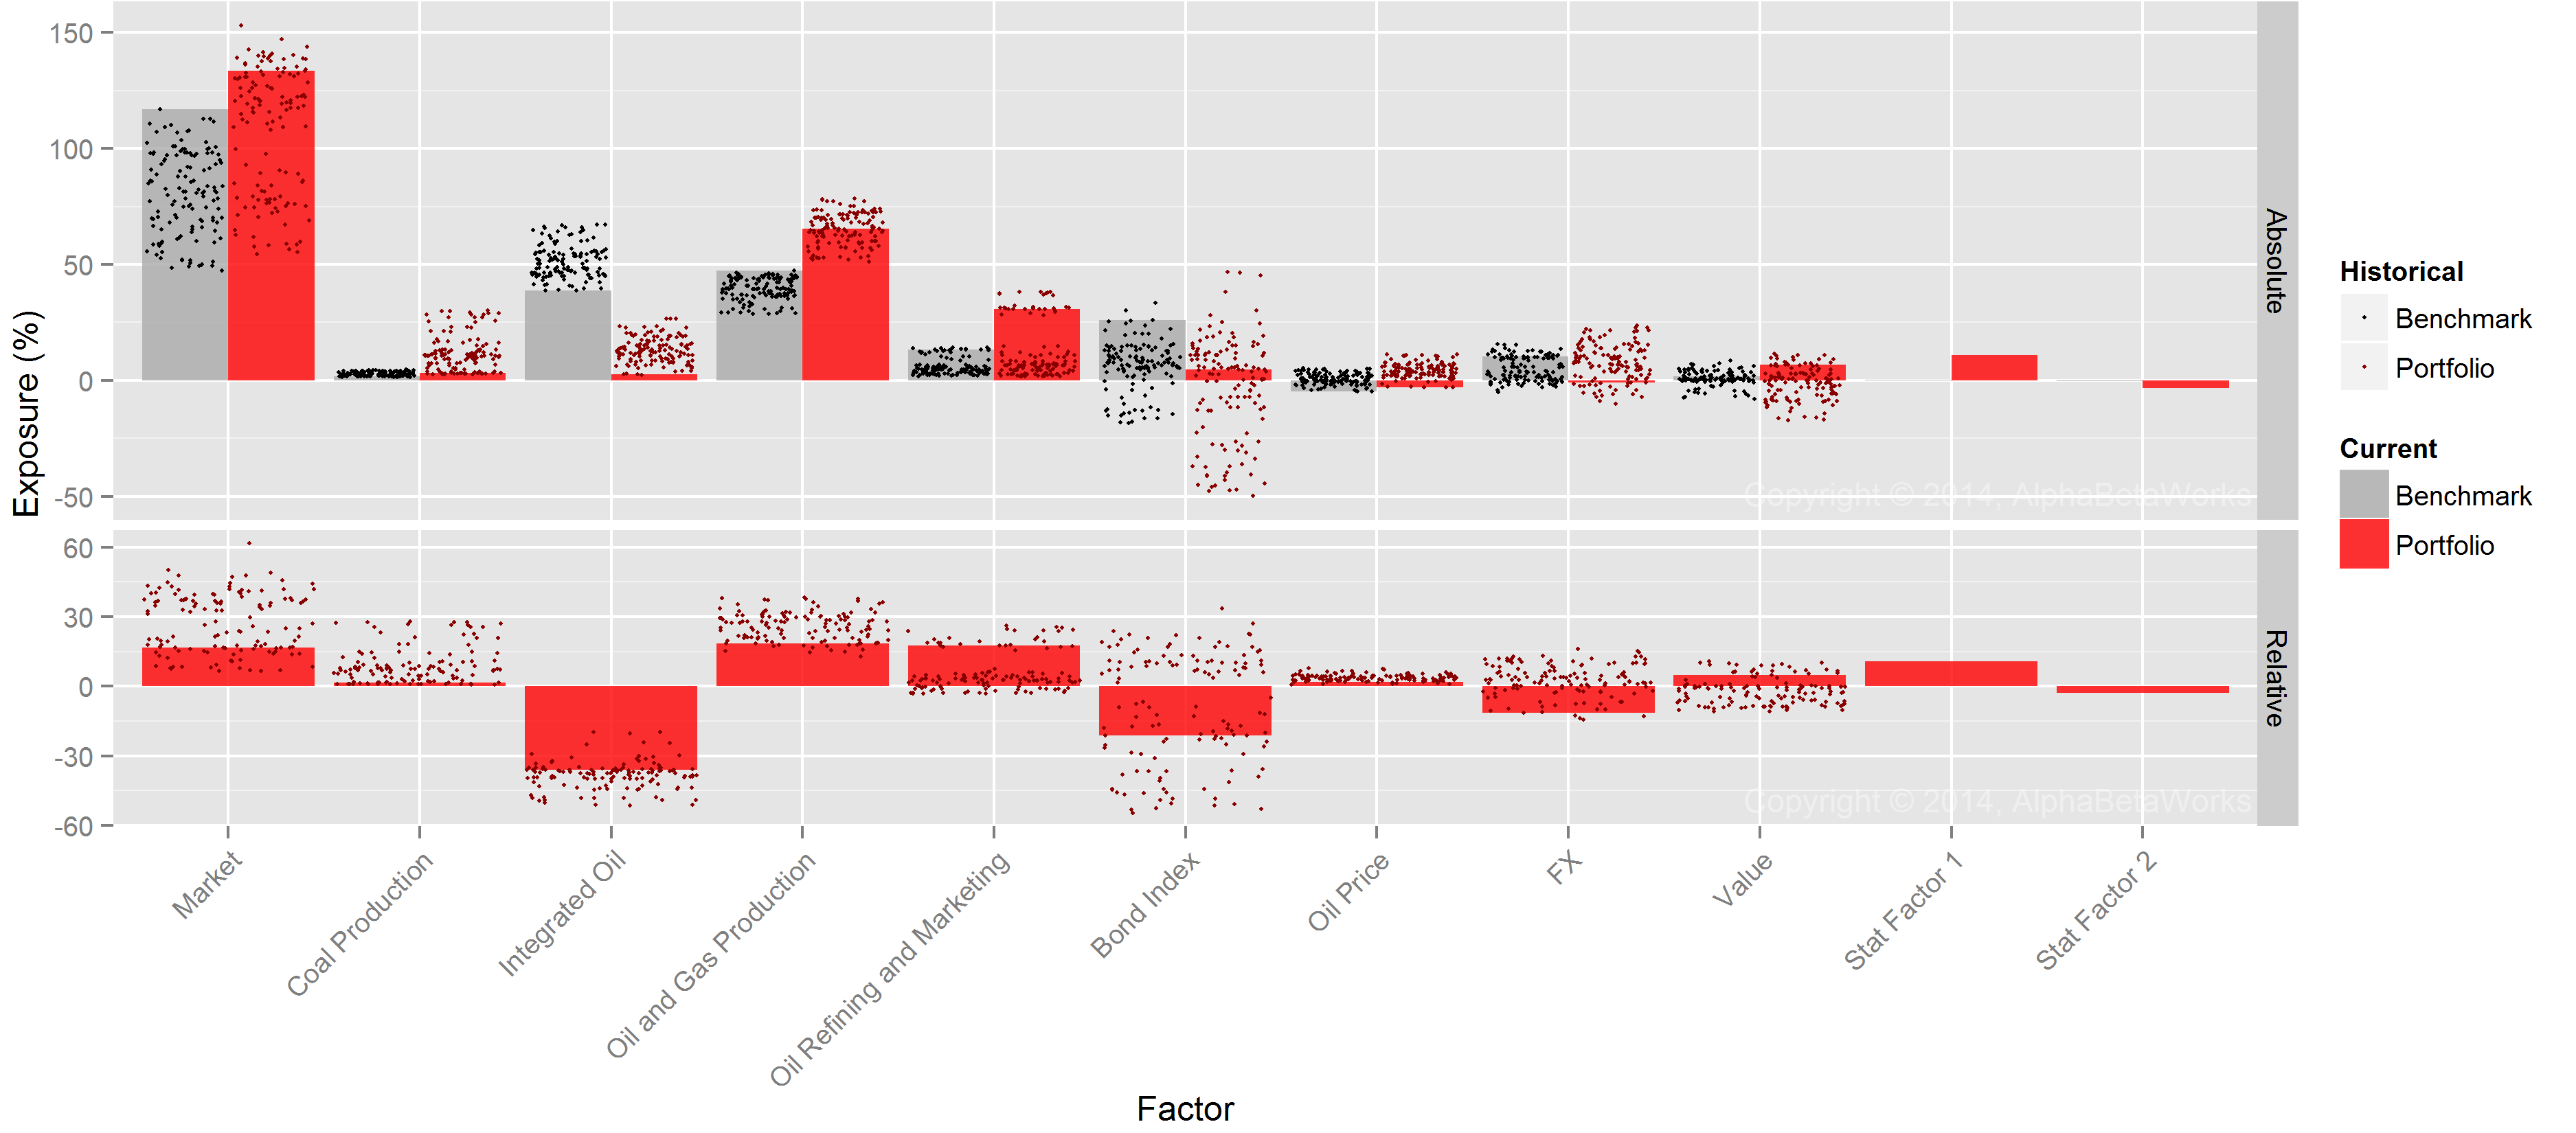
Factors Contributing Most to the Relative Risk for Hedge Fund Energy Aggregate
Below is the contribution of various factors to HF Energy Aggregate’s relative systematic risk. These are the components of the red “Factor Variance” in the first chart:
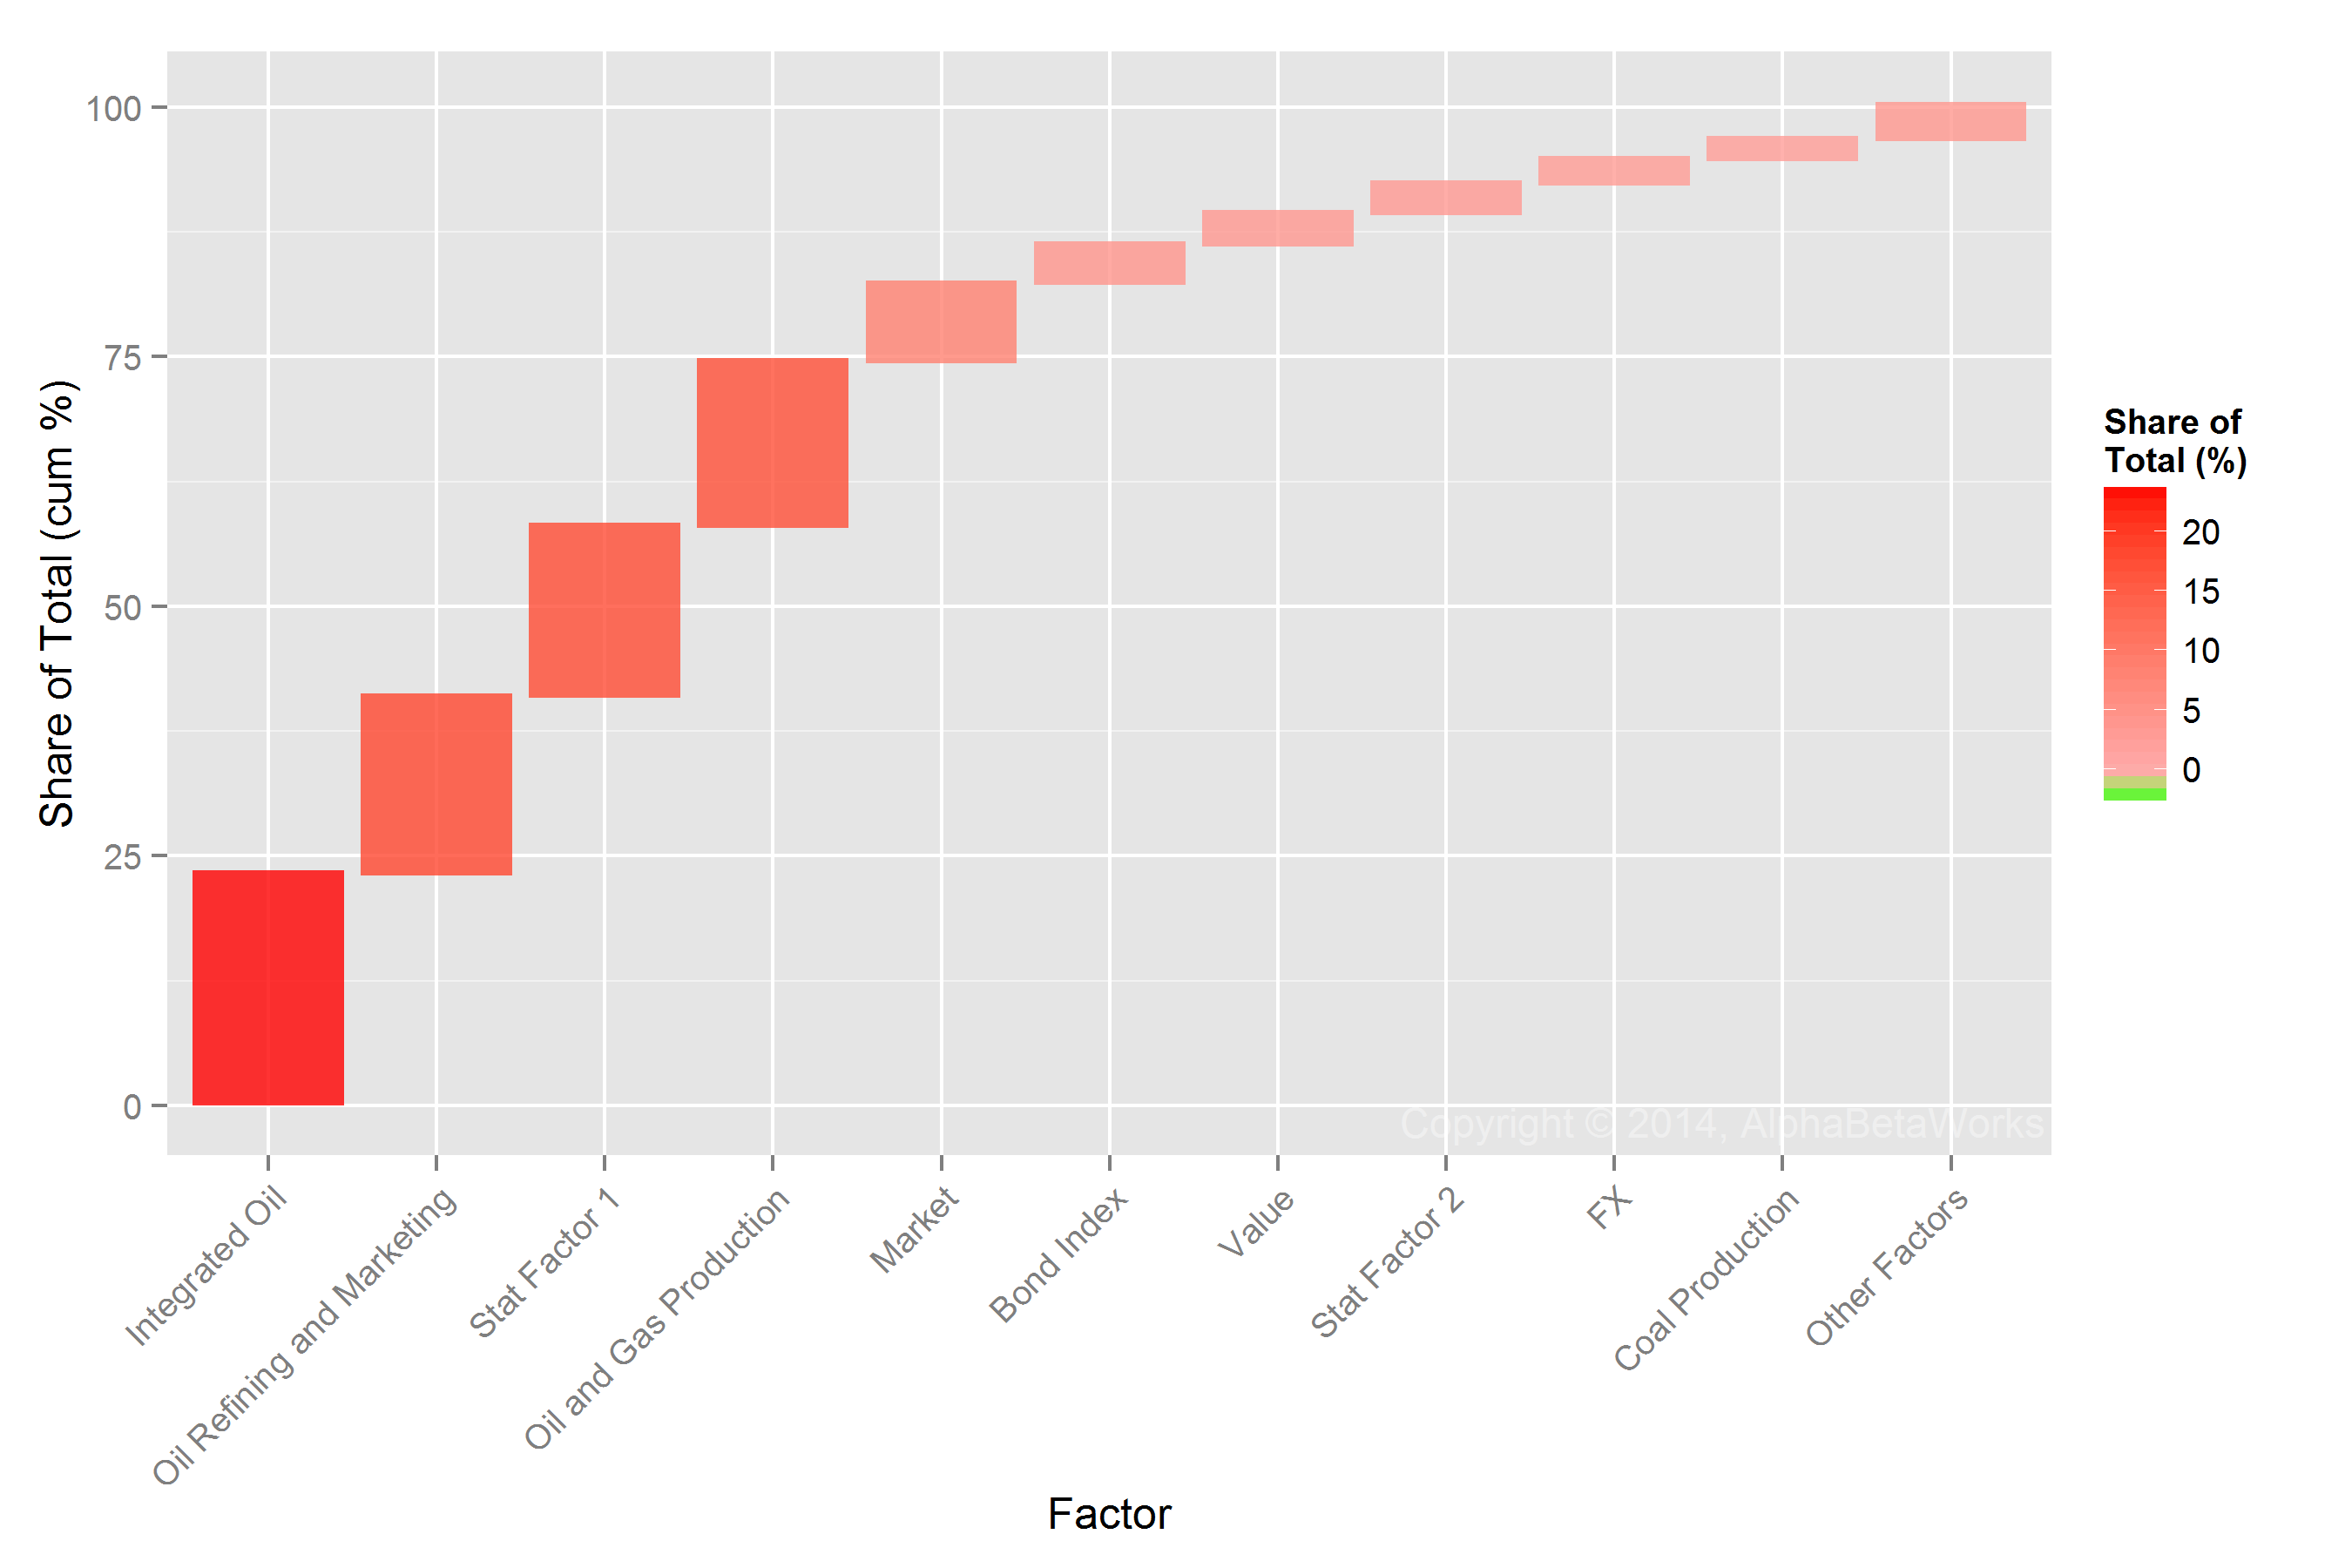
Factors Contributing Most to Relative Factor Variance of Hedge Fund Energy Aggregate
Four factors are responsible for 75% of the relative factor risk of Hedge Fund Energy Aggregate:
| Exposure (%) | ||||
| Factor | HF Energy Aggregate | Market Energy Aggregate | Relative | Share of Risk (%) |
| Integrated Oil | 2.62 | 38.75 | -36.13 | 23.01 |
| Oil Refining and Marketing | 30.87 | 13.18 | 17.68 | 17.79 |
| Stat Factor 1 | 11.86 | 0.26 | 11.59 | 17.08 |
| Oil and Gas Production | 65.53 | 47.23 | 18.30 | 16.48 |
These bets have the following meanings:
- Integrated Oil – short bet on integrated energy companies;
- Oil Refining and Marketing – long bet on oil refiners;
- Stat Factor 1 – systematic risk not captured by the standard market risk factors;
- Oil and Gas Production – long bet on non-integrated oil and gas producers.
AlphaBetaWorks’ Statistical Factors (Stat Factors) capture systematic risks overlooked by traditional risk models. Statistical factors and exposures to them are estimated using factor analysis. Stat Factor 1 turns out to be a combination of bets on cheap international, and against expensive U.S. producers. Securities with the largest positive exposure to Stat Factor 1 are LukOil ADR (LUKOY), Rosneft GDR (GB:ROSN), and BP ADR (BP). Securities with the largest negative exposure to it are Range Resources (RRC) and Cabot Oil & Gas (
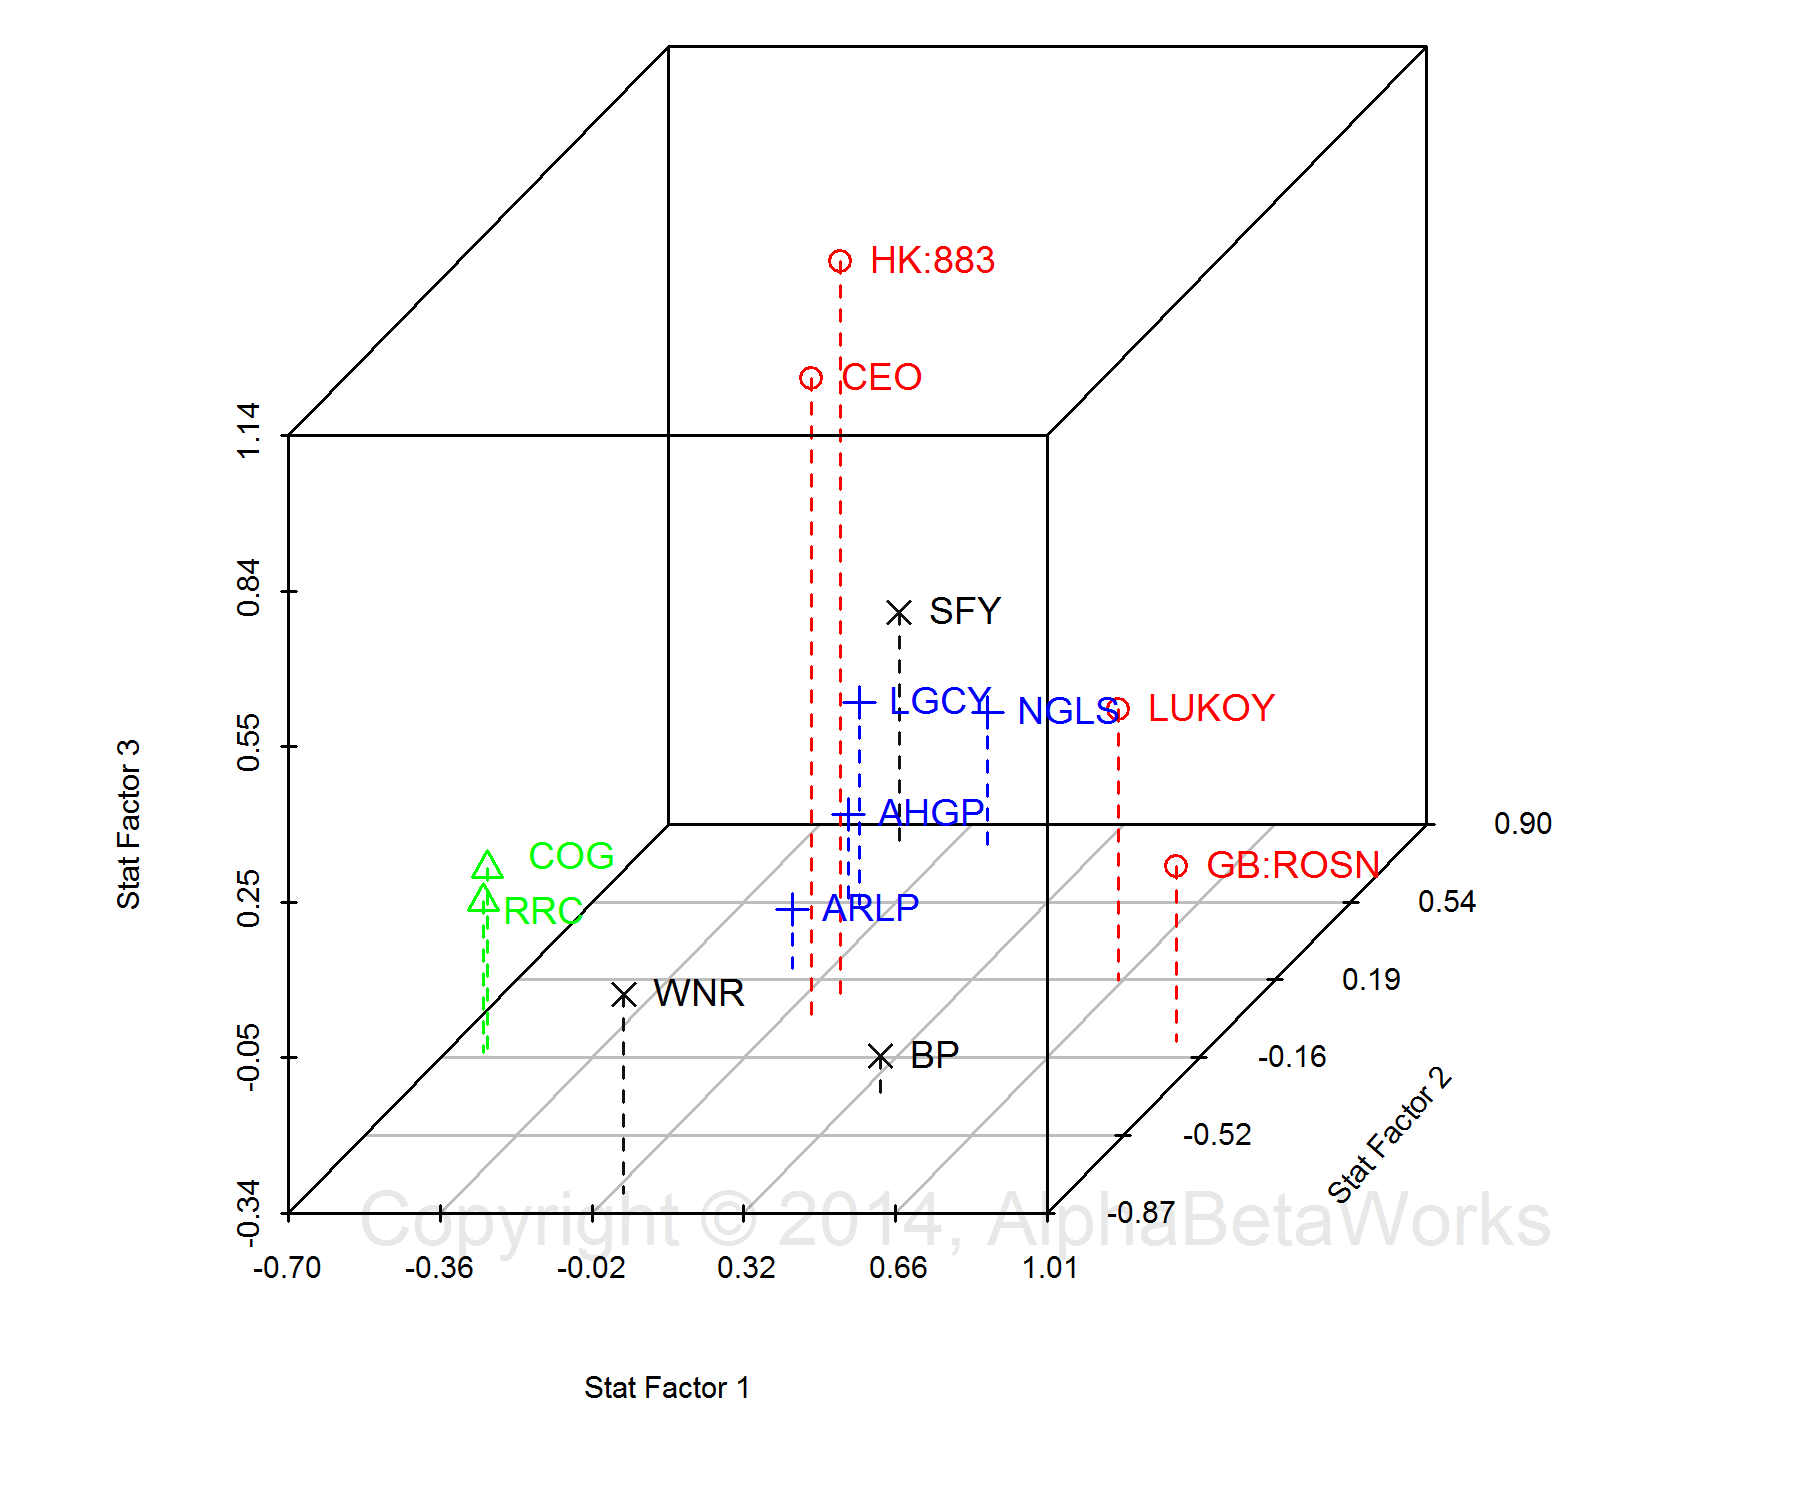
Hedge Fund Energy Positions’ Exposures to Stat Factors
Hedge Fund Residual (Idiosyncratic) Energy Crowding
Below are the sources of HF Energy Aggregate’s relative residual variance. These are the components of the blue “Residual Variance” in the first chart. Six stocks are responsible for over three quarters of the relative residual (idiosyncratic) risk of HF Energy Aggregate:
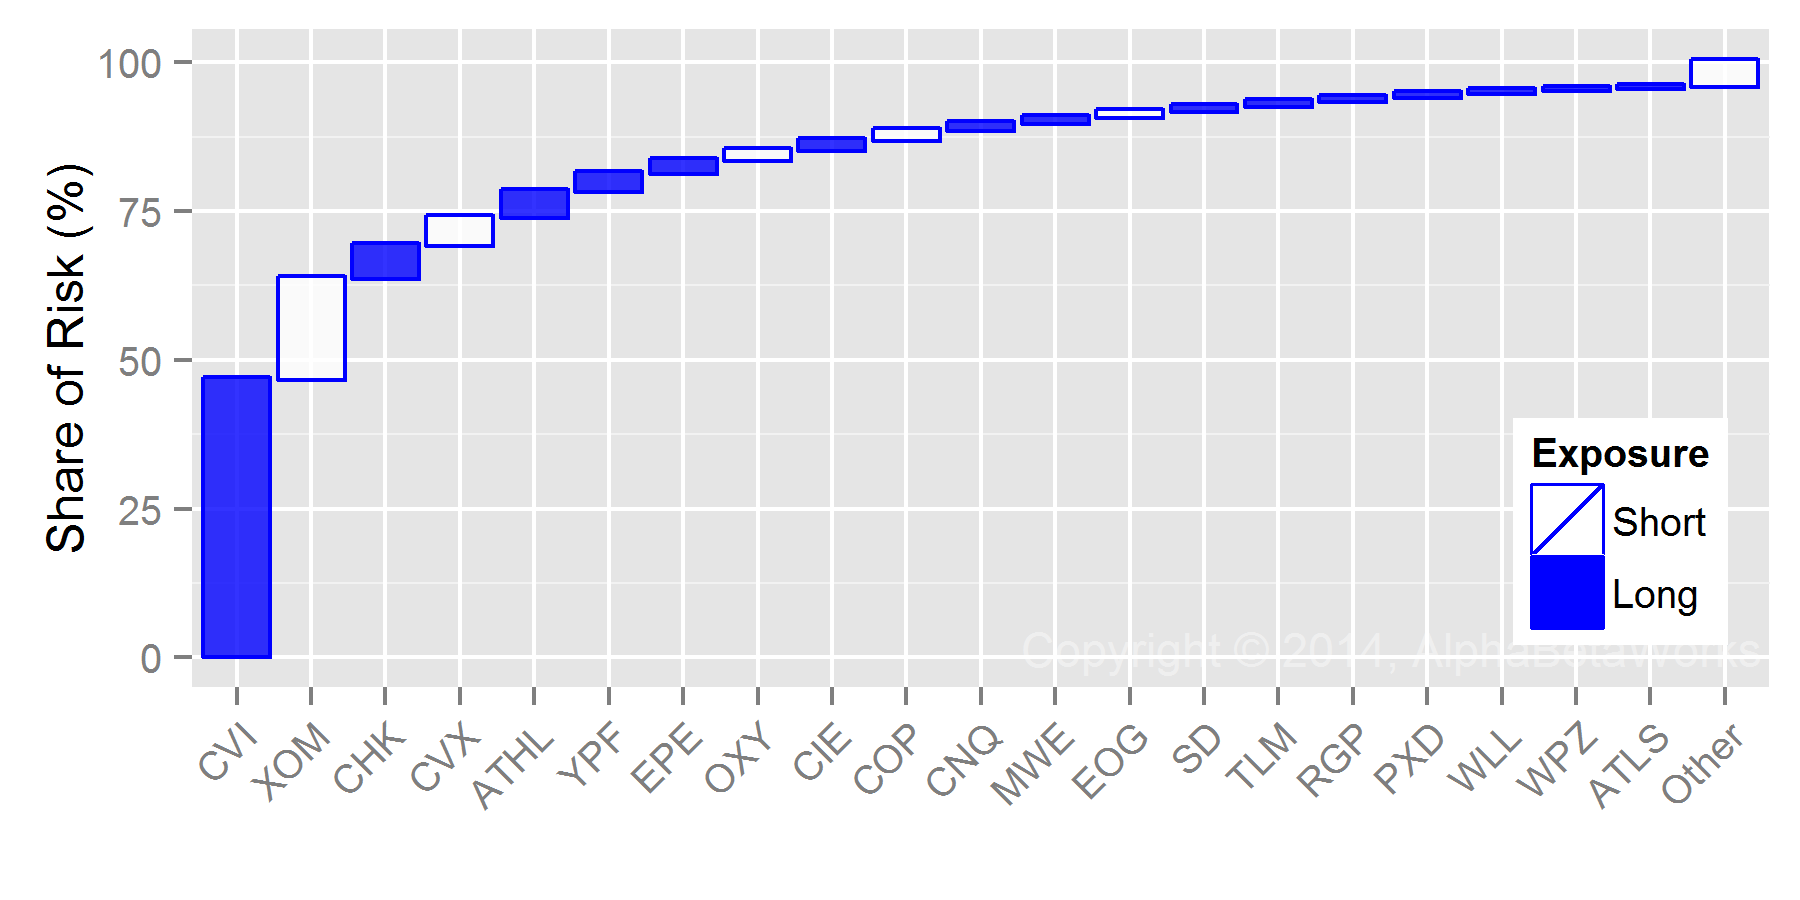
Stocks Contributing Most to Relative Residual Variance of Hedge Fund Energy Aggregate
These stocks will have the most sway on HF Energy Aggregate, and many individual funds. Conversely, the funds’ impatience will also affect these stocks the most. Investors should be ready for seemingly inexplicable volatility, especially among smaller companies:
| Position (%) | |||||
| Symbol | Name | HF Energy Aggregate | Market Energy Aggregate | Relative | Share of Risk (%) |
| CVI | CVR Energy, Inc. | 8.93 | 0.23 | 8.70 | 46.67 |
| XOM | Exxon Mobil Corporation | 0.50 | 23.90 | -23.39 | 16.98 |
| CHK | Chesapeake Energy Corporation | 5.78 | 0.91 | 4.87 | 5.49 |
| CVX | Chevron Corporation | 0.22 | 13.50 | -13.28 | 4.64 |
| ATHL | Athlon Energy, Inc. | 4.77 | 0.34 | 4.43 | 4.37 |
| YPF | YPF SA Sponsored ADR Class D | 1.89 | 0.00 | 1.89 | 3.05 |
| EPE | EP Energy Corp. Class A | 6.78 | 0.26 | 6.53 | 2.29 |
| OXY | Occidental Petroleum Corporation | 0.22 | 4.47 | -4.25 | 1.70 |
| CIE | Cobalt International Energy, Inc. | 1.99 | 0.33 | 1.66 | 1.64 |
| COP | ConocoPhillips | 0.31 | 5.61 | -5.30 | 1.64 |
| CNQ | Canadian Natural Resources Limited | 3.64 | 0.00 | 3.64 | 1.18 |
| MWE | MarkWest Energy Partners, L.P. | 3.65 | 0.85 | 2.80 | 1.03 |
| EOG | EOG Resources, Inc. | 0.52 | 3.23 | -2.71 | 1.01 |
| SD | SandRidge Energy, Inc. | 1.60 | 0.13 | 1.48 | 0.86 |
| TLM | Talisman Energy Inc. | 2.38 | 0.00 | 2.38 | 0.78 |
| RGP | Regency Energy Partners LP | 3.25 | 0.74 | 2.52 | 0.71 |
| PXD | Pioneer Natural Resources Company | 3.67 | 1.68 | 1.99 | 0.62 |
| WLL | Whiting Petroleum Corporation | 2.44 | 0.55 | 1.89 | 0.56 |
| WPZ | Williams Partners L.P. | 3.21 | 1.39 | 1.83 | 0.35 |
| ATLS | Atlas Energy, L.P. | 0.62 | 0.14 | 0.48 | 0.31 |
As with factor crowding, there is significant stock-specific crowding into a handful of popular names.
Summary
- There is both factor (systematic/market) and residual (idiosyncratic/security-specific) crowding of long hedge fund energy portfolios.
- The main sources of systematic crowding are three bets on energy sub-sectors and a relative value bet on international vs. domestic producers.
- The main sources of stock-specific crowding are CVI, XOM, CHK, ATHL, CVX, and YPF.
- Investors in crowded stocks may experience elevated volatility.
- Collectively, hedge funds’ long U.S. energy equity portfolios tend to generate negative risk-adjusted returns. Consequently, their crowded bets in this sector tend to disappoint.


Take Carl Icahn out of your analysis, then rerun it. Rookie error.
Thanks for bringing up some important questions. We do not have the space to dive into all the details behind each article – it’s helpful to get a chance to discuss methods and tradeoffs.
Icahn Associates is ~14% of the HF Energy Aggregate. It is large but not dominant – removing it does not change most of the conclusions.
But, I suspect you were after a particular one: CVR Energy (CVI) is ~9% of HF Energy Aggregate. Almost all of this position is Icahn Associates’.
This raises contentious questions: What constitutes a hedge fund and hedge fund ownership of a stock? Should activists or outliers be controlled for/excluded? These frequently come up in conversations, for instance with Pershing’s large positions: http://abwinsights.wpengine.com/2014/09/18/hedge-fund-crowding-q2-2014/#comments
Our goals are simplicity and purity of conclusions, so we strive to take discretion out of the picture as much as possible. Our readers, who tend to be familiar with the names, have so far found it easy to discount large owners of CVI or APD as they see fit. Since we develop reports on over a hundred sectors, thousands of funds, and thousands of stocks, we must use a consistent approach for all. It is tricky and somewhat arbitrary to develop a hard rule that an activist position >= 80%, 50%, or 20% should be excluded.
We would love to hear ideas for simple and defensible heuristics.
It appears that the opposite of your thesis is happening. Majors and super-majors (CVX, XOM) are showing the most stability while the small-cap leveraged energy plays are getting murdered, on some days between 15-30%. They are behaving as if oil is already priced below $40/bbl.
What do you think is causing this – Hedge fund dumping?
I for one, do not 100% blame OPEC (or Russia).
Apologies if this was not clear from the article: HF Aggregate is short XOM (-23% exposure) and CVX (-13% exposure) relative to Market:
Symbol Name Portfolio Benchmark Relative Share of Variance (%)
XOM Exxon Mobil Corporation 0.50 23.90 -23.39 16.98
CVX Chevron Corporation 0.22 13.50 -13.28 4.64
The charts we originally built did not distinguish long and short exposures, but the table did. We have since updated the chart to differentiate between long and short crowding.
What you observe is exactly what crowding had predicted: HFs are long/overweight small-cap leveraged E&Ps and underweight integrateds. As HFs liquidate, longs underperform shorts.
In recent weeks, the energy sector has provided an excellent example of the importance of crowding.