Our earlier articles discussed how some smart beta strategies turn out to be merely high beta strategies, and how others actively time the market, requiring careful monitoring. We also showed that the returns of popular factor ETFs such as Momentum and Quality are mostly attributable to exposures to traditional Market and Sector Factors. We now quantify the influence of traditional factors, or dumb beta, on all broad U.S. equity smart beta ETFs.
Though many smart beta ETFs do provide valuable exposure to idiosyncratic factors, many others mostly re-shuffle exposures to basic dumb factors. To successfully use smart beta products, investors and allocators must apply rigorous quantitative analysis. With capable analytics, they can guard against elaborate (and often expensive) re-packaging of dumb beta as smart beta, identify smart beta products that time dumb beta factors effectively, and monitor smart beta allocations to control for unintended dumb factor exposures.
Measuring the Influence of Dumb Beta Factors on Smart Beta ETFs
We started with approximately 800 U.S. Smart Beta ETFs. Since our focus was on the broad U.S. equity strategies, we removed non-U.S. portfolios and sector portfolios. (Later articles will cover global equity portfolios.) We also removed portfolios for which returns estimated from historical positions did not reconcile closely to reported performance. We were left with 215 broad U.S. equity smart beta ETFs. This nearly complete sample contains all the popular smart beta strategies.
For each ETF, we estimated monthly positions and then used these positions to calculate portfolio factor exposures for traditional (dumb beta) factors such as Market and Sectors. These ex-ante factor exposures can be used to predict or explain the following months’ returns.
The correlation between returns predicted by dumb beta factor exposures and actual returns quantifies the influence of dumb beta factors. The higher the correlation, the more similar a smart beta ETF is to a portfolio of traditional, simple, and dumb systematic risk factors.
The Influence of Market Beta on Smart Beta ETFs
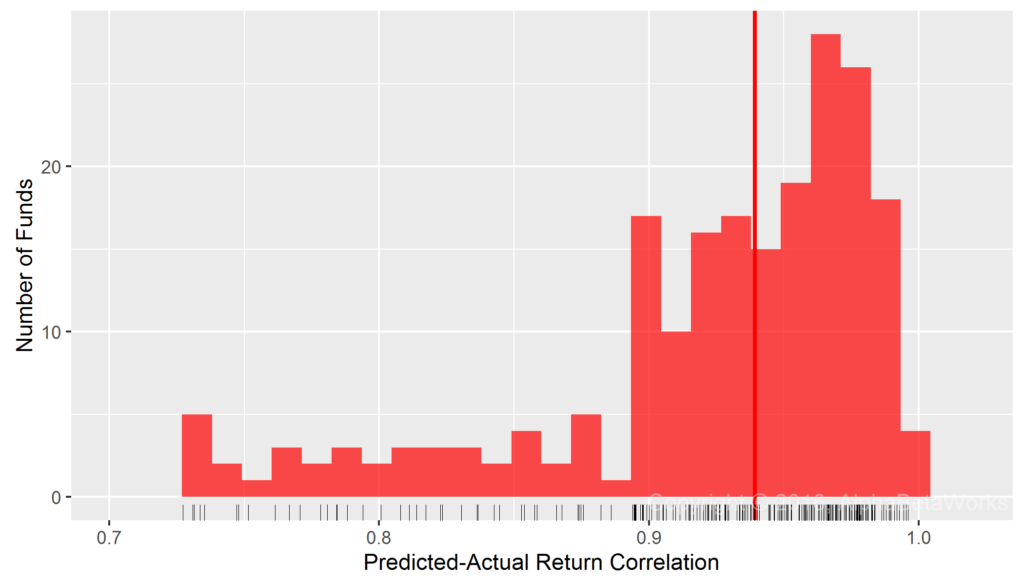
Our simplest test used a single systematic risk factor – Market Beta. This is the dumbest traditional factor and also the cheapest to invest in. Since Market Beta is the dominant factor behind portfolio performance, even a very simple 1-factor model built with robust statistical methods delivered 0.92 mean and 0.94 median correlation between predicted and actual monthly returns for smart beta ETFs:

U.S. Smart Beta Equity ETFs: Correlation between a single-factor statistical equity risk model’s predictions and actual monthly returns
  Min. 1st Qu.  Median    Mean 3rd Qu.    Max.
0.5622  0.8972  0.9393  0.9174  0.9693  0.9960
Put differently: For most broad U.S. equity smart beta ETFs, U.S. Market Beta accounts for over 88% of monthly return
The Influence of Market and Sector Betas on Smart Beta ETFs
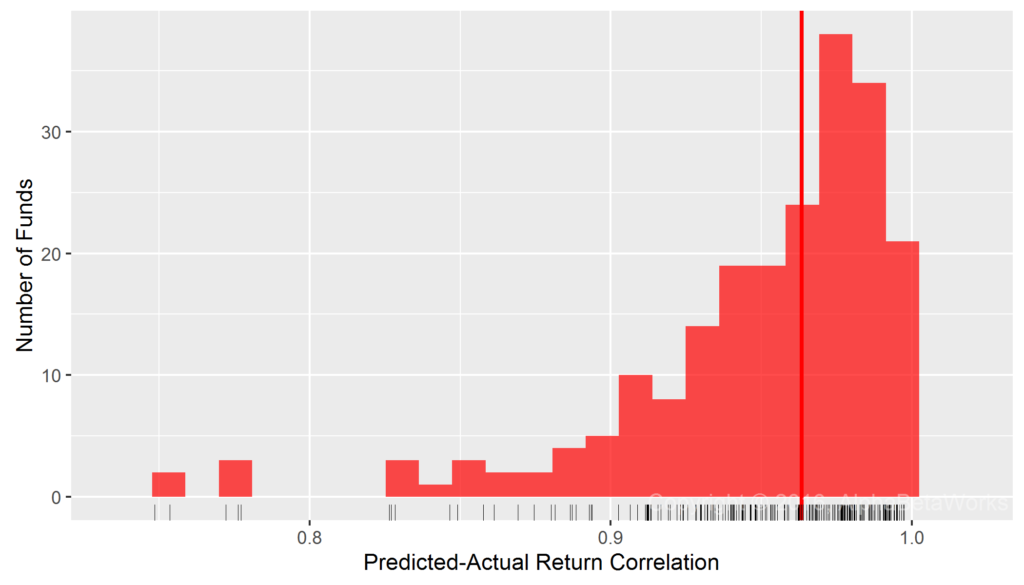
Since traditional sector/industry allocation is a staple of portfolio construction and risk management, we next tested a two-factor model that added a Sector Factor. Each security belongs to one of 10 broad sectors (e.g., Energy, Technology). Market and Sector Betas, estimated with robust methods, delivered 0.95 mean and 0.96 median correlation between predicted and actual monthly returns for smart beta ETFs:

U.S. Smart Beta Equity ETFs: Correlation between a two-factor statistical equity risk model’s predictions and actual monthly returns
  Min. 1st Qu.  Median    Mean 3rd Qu.    Max.
0.5643  0.9320  0.9634  0.9452  0.9805  0.9974
Put differently: For most broad U.S. equity smart beta ETFs, U.S. Market and Sector Betas accounts for over 92% of monthly return variance.
Smart Beta Variance and Dumb Beta Variance
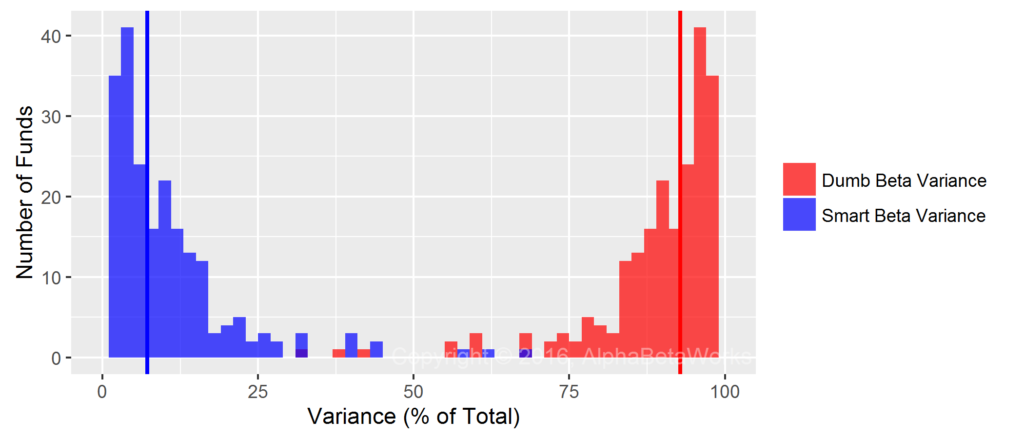
Rather than measuring the correlation between returns predicted by dumb beta exposures and actual returns, we can instead measure the fraction of variance unexplained by dumb beta exposures. This (in blue below) is the fraction of smart beta ETFs’ variance that is unrelated to dumb beta:
Percentage of Variance Explained by Dumb Beta Factors
Min. 1st Qu.  Median    Mean 3rd Qu.    Max.
1.85   86.87   92.81   89.71   96.14   99.47
Percentage of Variance Unexplained by Dumb Beta Factors
Min. 1st Qu.  Median    Mean 3rd Qu.    Max.
 .53    3.86    7.19   10.29   13.13   68.15
Note that some smart beta strategies do provide value by timing the dumb beta factors. This market timing can generate a positive active return, but it still consists of traditional dumb factor exposures and their variation. Market timing by smart beta ETFs is beyond the scope of this article.
The high explanatory power of dumb beta exposures above was achieved with a primitive model using Market and Sector Factors only. If one incorporates Value/Growth and Size factors that are decades old and considered dumb beta by some, smart beta variance shrinks further.
Conclusions
- Traditional, or dumb, Market and Sector Betas account for over 92% of variance for most U.S. equity smart beta ETFs.
- Smart beta, unexplained by the traditional Market and Sector Betas, accounts for under 8% of variance for most U.S. equity smart beta ETFs.
- With proper analytics, investors and allocators can guard against elaborate re-packaging of dumb beta as smart beta.
- With proper analytics, investors and allocators can monitor smart beta allocations to control for unintended dumb factor exposures.
- Equity risk models can adequately describe and predict the performance of most smart beta strategies with traditional dumb risk factors such as Market and Sectors.


