
A typical analysis of hedge fund crowding surveys popular equity holdings. Yet, such residual, idiosyncratic, or stock-specific bets account for only 31% of current hedge fund crowding. Factor (systematic) risk, rather than a few specific stocks, is driving absolute and relative returns. Consequently, most analysis of hedge fund crowding focuses on a small fraction of crowding, missing its bulk.
Nearly 70% of the hedge fund industry’s long equity risk comes from factor crowding. Market exposure (high Beta) constitutes half of that – more than all the remaining factor bets and more than all the stock-specific bets combined. Since the consensus factor exposures can be obtained cheaply via ETFs and do not warrant the same compensation as idiosyncratic insights, it is vital for investors and allocators to understand and manage these crowded exposures. In addition, crowded factor bets are vulnerable to damaging liquidations. This article reviews hedge fund long equity bets at the end of 2016 and focuses on the dominant systematic exposures that will have the largest impact on investor performance.
Identifying Hedge Fund Crowding
This article follows the approach of our earlier studies of hedge fund crowding: We started with a 10-year survivorship-free database of SEC filings by over 1,000 U.S. hedge funds. This database contains all funds that had long U.S. assets in excess of $100 million and sufficiently low turnover to be analyzable from their filings. We then combined all fund portfolios into a single position-weighted portfolio (HF Aggregate). The analysis of HF Aggregate’s risk relative to the U.S. Market revealed its main active bets. The AlphaBetaWorks (ABW) Statistical Equity Risk Model – an effective predictor of future risk – identified and quantified these crowded exposures driving HF Aggregate’s performance.
Hedge Fund Industry’s Risk
The 12/31/2016 HF Aggregate had 2.7% estimated future volatility (tracking error) relative to the U.S. Market. Approximately a third of this tracking error was due to residual crowding, and the remaining two thirds was due to factor crowding:

Components of the Relative Risk for U.S. Hedge Fund Aggregate in Q4 2016
| Source |
Volatility (ann. %) |
Share of Variance (%) |
| Factor |
2.25 |
68.89 |
|
Residual |
1.51 |
31.11 |
| Total |
2.71 |
100.00 |
The low 1.5% residual volatility, less than a third of the total, illustrates the challenges of hedge fund crowding analysis that focuses on the popular holdings and position overlap. Such stock-specific view overlooks the two thirds of crowding that is due to factors – a fatal flaw. As a result, simplistic analysis of popular holdings and of position overlap fosters dangerous complacency when funds with no shared positions correlate highly due to similar factor exposures.
Hedge Fund Factor (Systematic) Crowding
The following chart illustrates the main sources of factor risk. HF Aggregate’s factor exposures are in red. The U.S. Market’s (defined as the iShares Russell 3000 ETF (IWV) Benchmark) is in gray:

Significant Absolute and Residual Factor Exposures of U.S. Hedge Fund Aggregate in Q4 2016
The dominant bet of hedge funds’ long equity portfolios is Market (high Beta). The most crowded hedge fund bet is thus not a particular stock, but high overall market risk. HF Aggregate thus partially behaves like a leveraged market ETF, outperforming during bullish regimes and underperforming during bearish ones.
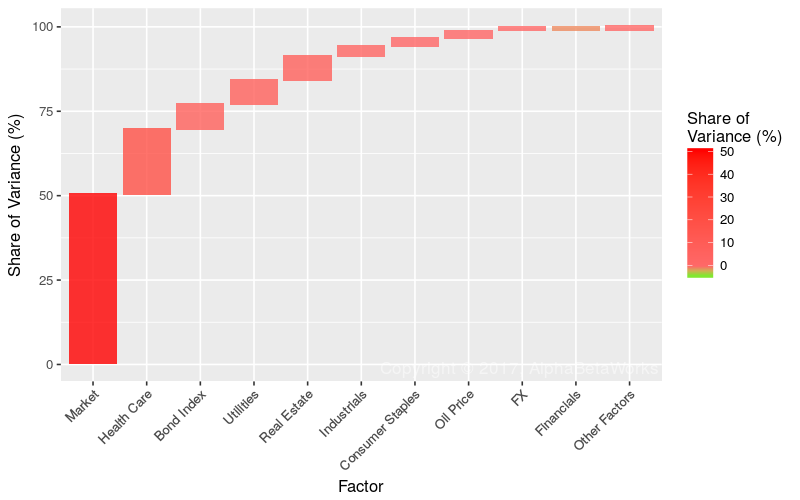
Factors Contributing Most to Relative Factor Variance of U.S. Hedge Fund Aggregate in Q4 2016
| Factor | Relative Exposure | Factor Volatility | Share of Relative Factor Variance | Share of Relative Total Variance |
| Market | 12.92 | 10.52 | 50.26 | 34.62 |
| Health Care | 10.14 | 7.61 | 19.26 | 13.26 |
| Bond Index | -9.71 | 3.59 | 7.32 | 5.04 |
| Utilities | -3.19 | 12.53 | 7.14 | 4.92 |
| Real Estate | -2.51 | 12.88 | 7.07 | 4.87 |
| Industrials | -5.00 | 4.96 | 3.09 | 2.13 |
| Consumer Staples | -4.97 | 7.75 | 2.27 | 1.56 |
| Oil Price | 0.56 | 30.34 | 2.27 | 1.56 |
| FX | -1.12 | 6.87 | 1.02 | 0.70 |
| Financials | -2.38 | 7.71 | -0.83 | -0.57 |
(Relative exposures and relative variance contribution. All values are in %. Volatility is annualized.)
Hedge funds’ Market Factor crowding accounts for more risk than all their stock-specific bets combined. This dominance of a single systematic risk illustrates how asset managers’ and allocators’ endurance increasingly depends on their grasp of systematic crowding. It also illustrates the dangers of fixation on individual holdings.
HF Aggregate’s exposures to Market, Health Care, and Bond Factors remained near record levels reached recently. We analyze these in their order of importance below.
Hedge Fund U.S. Market Factor (Beta) Crowding
Hedge Fund Aggregates’ U.S. Market exposure decreased slightly from the mid-2016 record level:

U.S. Hedge Fund Aggregate’s U.S. Market Factor Exposure History
Even following this decrease in risk, the average dollar of hedge fund long U.S. equity capital carries approximately 20% more market risk than S&P 500. Thus, hedge fund portfolios move in concert with the market, but with heightened sensitivity to it. Consequently, simple comparison of hedge fund returns to broad equity benchmarks and identification of nominal outperformance with alpha remain dangerous. Further, simple equation of capital invested in (dollar exposures to) a market or sector with actual portfolio risk remains flawed.
Hedge Fund Health Care Crowding
Hedge Fund Aggregates’ Health Care exposure also decreased sharply from its 2016 record:

U.S. Hedge Fund Aggregate’s U.S. Health Care Factor Exposure History
Even after this decrease, HF Aggregate continues to carry almost twice the Health Care exposure of the Market. The Health Care Factor remains the second most significant hedge fund long equity bet.
Hedge Fund Short Bonds/Long Interest Rates Factor Crowding
HF Aggregate’s Short Bonds/Long Interest Rates Factor exposure was profitable in late-2016. This exposure decreased by half in the second half of the year, following the election catalyst:

U.S. Hedge Fund Aggregate’s U.S. Long Bonds/Short Interest Rates Factor Exposure History
Short bond exposure is a natural consequence of hedge funds’ interest in “cheap call options”, often highly financially leveraged companies with asymmetric profit and loss potential. We discussed the fundamental sources of this Bonds/Interest Rates Factor exposure in more detail in a prior article.
Hedge Fund Residual (Idiosyncratic) Crowding
The remaining third of hedge fund crowding on 12/31/2016 was due to residual (idiosyncratic, stock-specific) risk. Though this is a minor component of the total crowding, we survey it for completeness and to facilitate comparisons with the basic surveys of crowding found elsewhere:
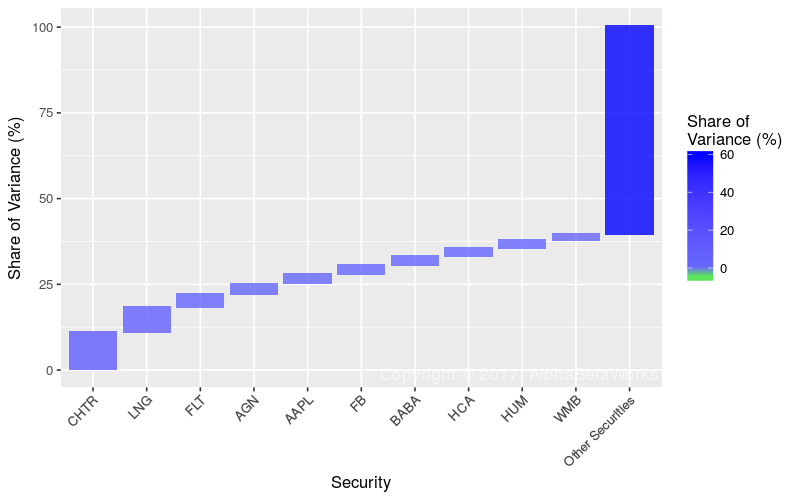
Stocks Contributing Most to Relative Residual Variance of U.S. Hedge Fund Aggregate in Q4 2016
| Symbol | Name | Relative Exposure | Residual Volatility | Share of Relative Residual Variance | Share of Relative Total Variance |
| CHTR | Charter Communications, Inc. | 2.62 | 19.03 | 10.87 | 3.38 |
| LNG | Cheniere Energy, Inc. | 1.40 | 29.27 | 7.29 | 2.27 |
| FLT | FleetCor Technologies, Inc. | 1.27 | 23.17 | 3.80 | 1.18 |
| AGN | Allergan plc | 1.44 | 18.31 | 3.05 | 0.95 |
| AAPL | Apple Inc. | -1.85 | 13.81 | 2.86 | 0.89 |
| FB | Facebook, Inc. Class A | 0.91 | 27.00 | 2.63 | 0.82 |
| BABA | Alibaba Group Holding Ltd. ADR | 1.02 | 23.23 | 2.47 | 0.77 |
| HCA | HCA Holdings, Inc. | 1.09 | 21.27 | 2.34 | 0.73 |
| HUM | Humana Inc. | 1.05 | 21.88 | 2.29 | 0.71 |
| WMB | Williams Companies, Inc. | 0.83 | 25.52 | 1.94 | 0.60 |
(Relative exposures and relative variance contribution. All values are in %. Volatility is annualized.)
Though these exposures are sensitive to asset flows, they generally constitute minor risks within the crowded portfolios. While systematic hedge fund crowding continues to dominate, investors and allocators should focus on the factor exposures. Without a firm grasp of factor crowding, a supposedly diversified hedge fund portfolio may be charging high active management fees for what is effectively a leveraged ETF book.
Summary
- Factor (systematic) exposures and risks shared across stocks, rather than individual positions, are driving hedge fund industry’s long equity risk. Exposure to these crowded bets can be obtained much more cheaply via ETFs and other passive products.
- The main sources of Q4 2016 hedge fund crowding were long U.S. Market (high Beta), long Health Care, and short Bonds/long Interest Rates Factor exposures.
- Without a robust analysis of factor and residual crowding, a hedge fund investor, follower, or allocator may be investing in a generic passive factor portfolio, likely with leverage.


