
Allocators who are unaware of hedge fund clustering and hedge fund crowding may be investing in an undifferentiated pool of consensus bets and paying high fees for closet indexing.
Hedge fund crowding has internal structure – clusters of funds with shared systematic (factor) and idiosyncratic (residual) bets. We examine the largest hedge fund cluster in which:
- two risk factors cause most of this herding, and
- residual exposures are diversified, except for one stock-specific bet.
Hedge Fund Crowding and Hedge Fund Clustering
In an earlier article we surveyed the crowding of approximately 400 medium and lower turnover U.S. hedge funds. We constructed an aggregate position-weighted portfolio consisting of over 200 popular securities (HF Aggregate) and analyzed its risk relative to the U.S. Market. While the exercise revealed a few crowded factor (systematic) and residual (idiosyncratic) bets, the article treated all hedge funds as a single crowded portfolio. We did not address crowded bets shared by fund groups – hedge fund clustering.
Clusters of Hedge Funds
In a subsequent article regarding hedge fund crowding trends, we estimated the future relative volatility (tracking error) of every fund relative to every other fund. The higher the expected relative tracking error between two funds, the more different they are from each other. This information allows us to identify groups of funds with similar bets and build a clustering diagram, or a “family tree” of the funds’ long portfolios. We use agglomerative hierarchical clustering with estimated future relative tracking error as the metric of fund differentiation, or dissimilarity. The result is a picture of clustering among medium and lower turnover U.S. hedge fund long portfolios:
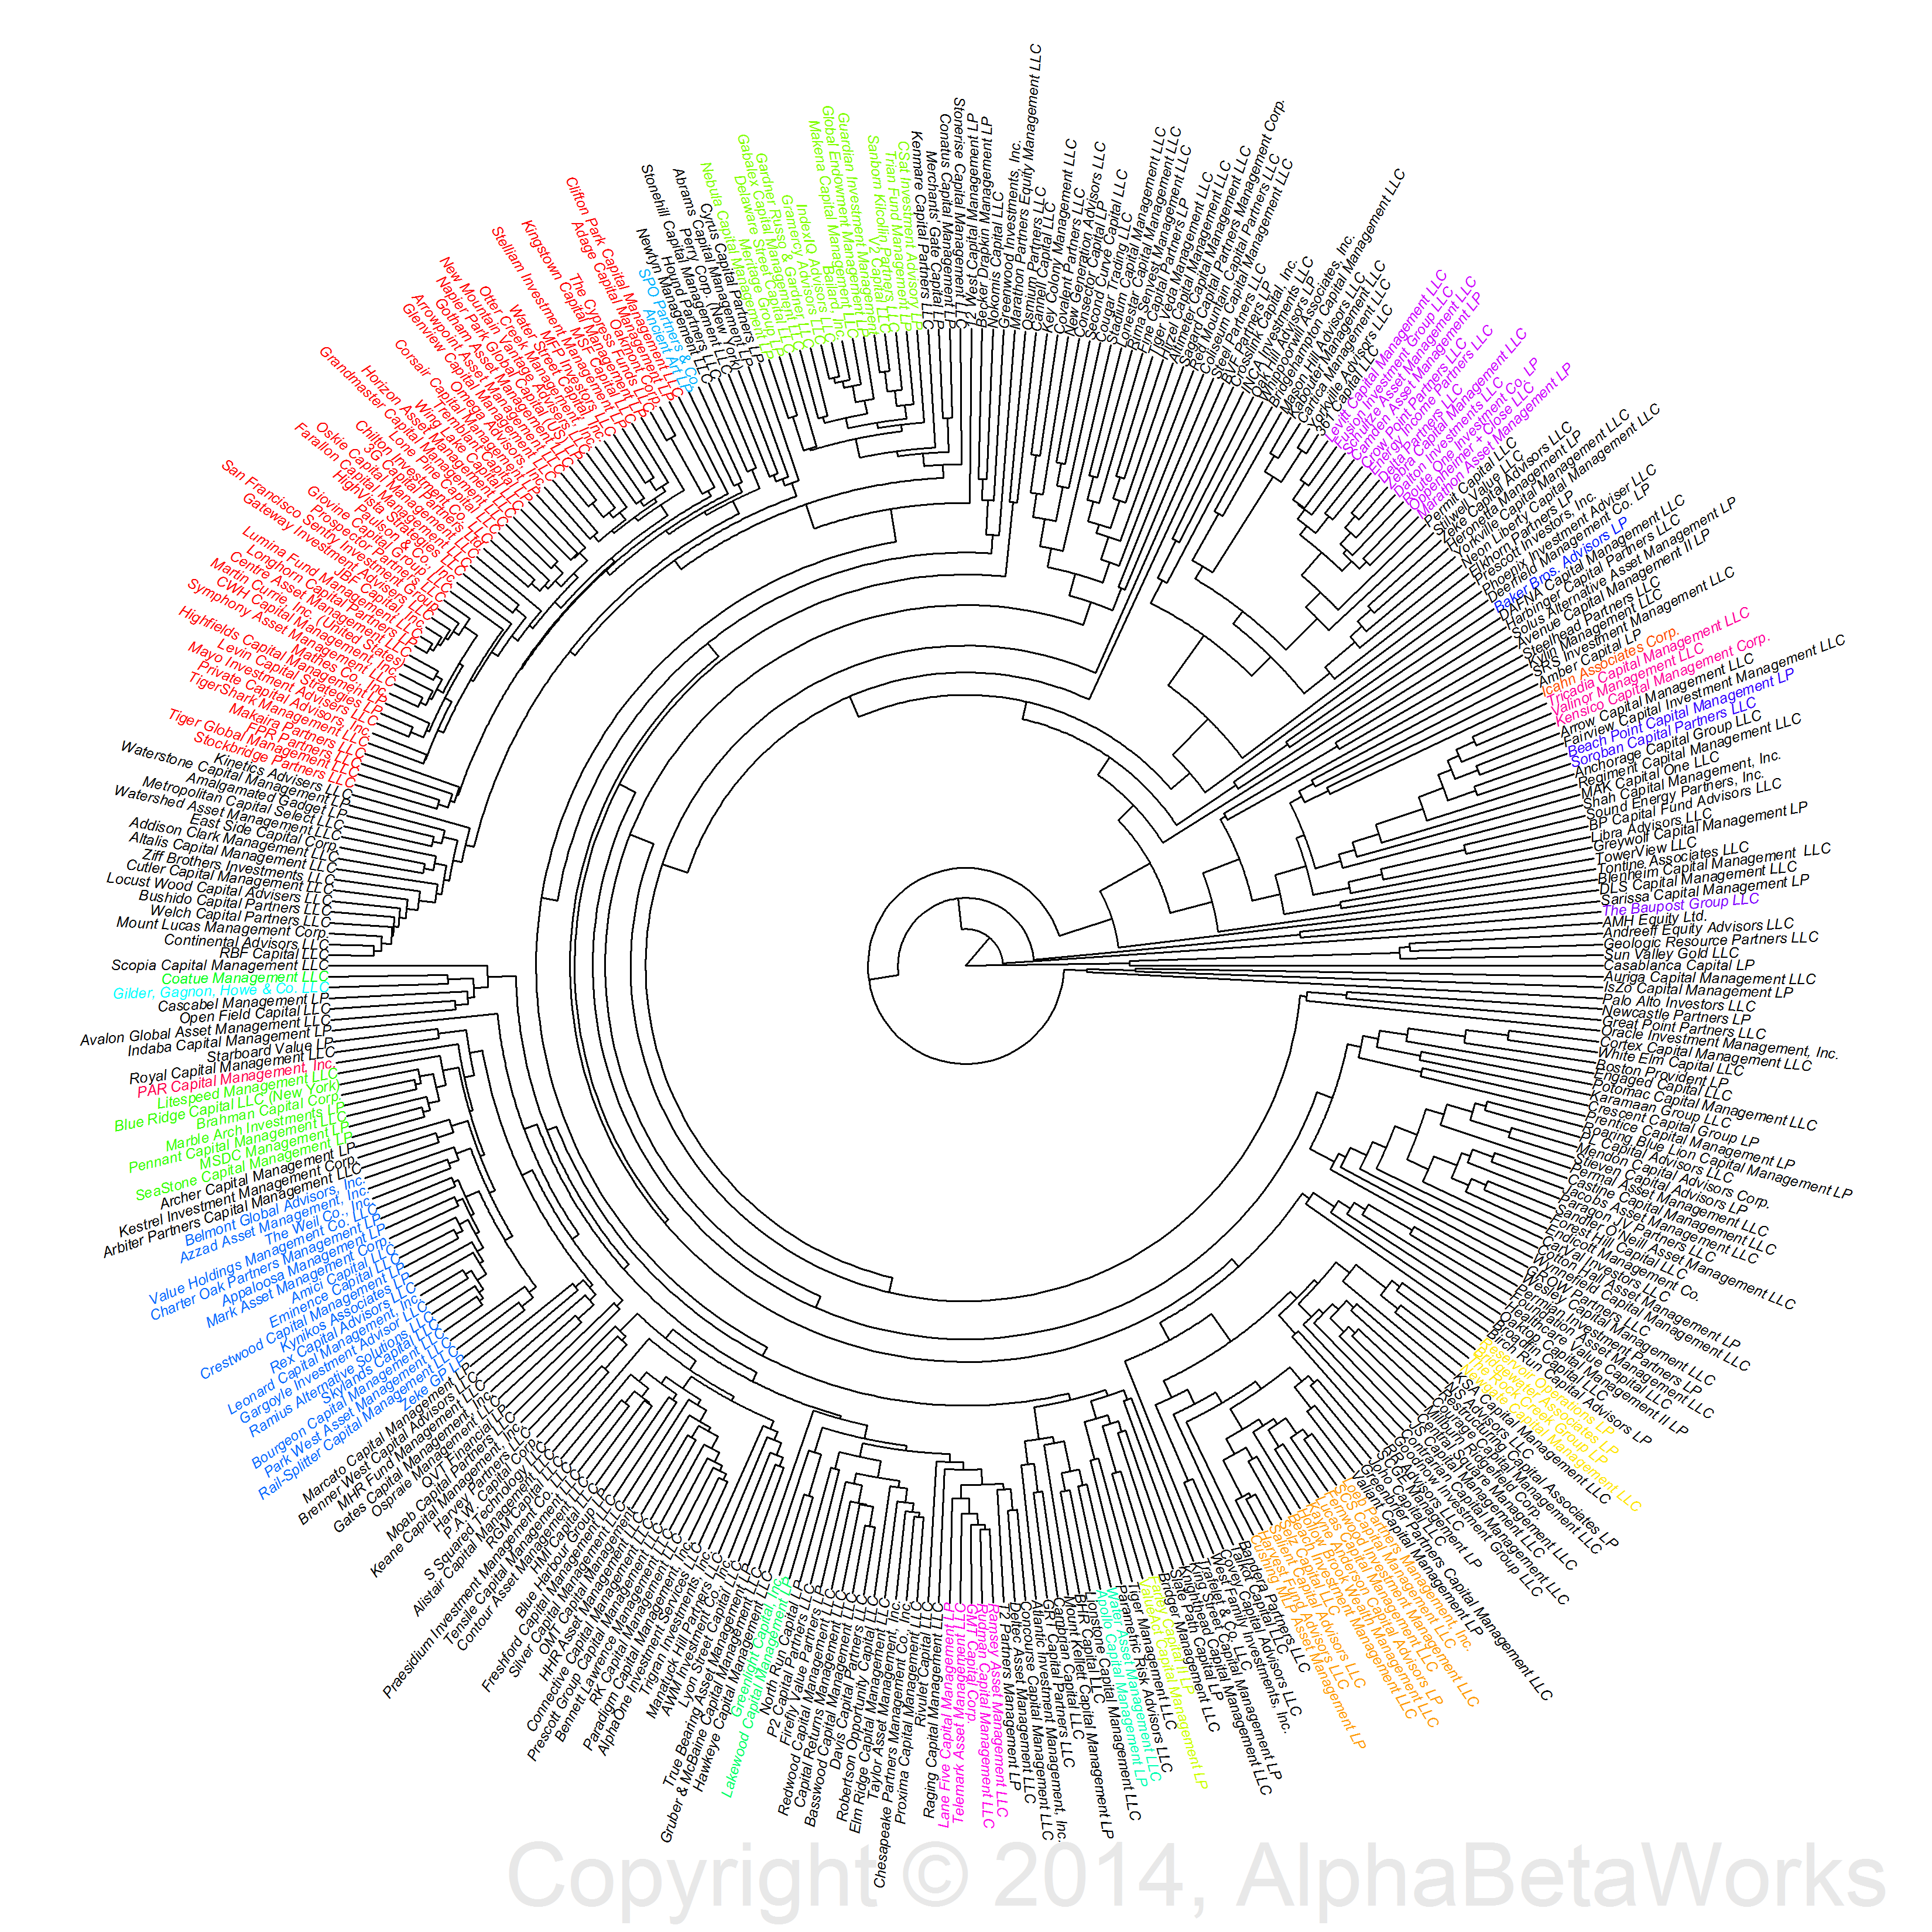
U.S. Hedge Funds Clustering – Long Portfolios
The largest cluster contains approximately 50 funds. Similarities among several members should be of concern for investors; a seemingly active fund portfolio can turn out to be a handful of passive factor bets and consensus stock picks.
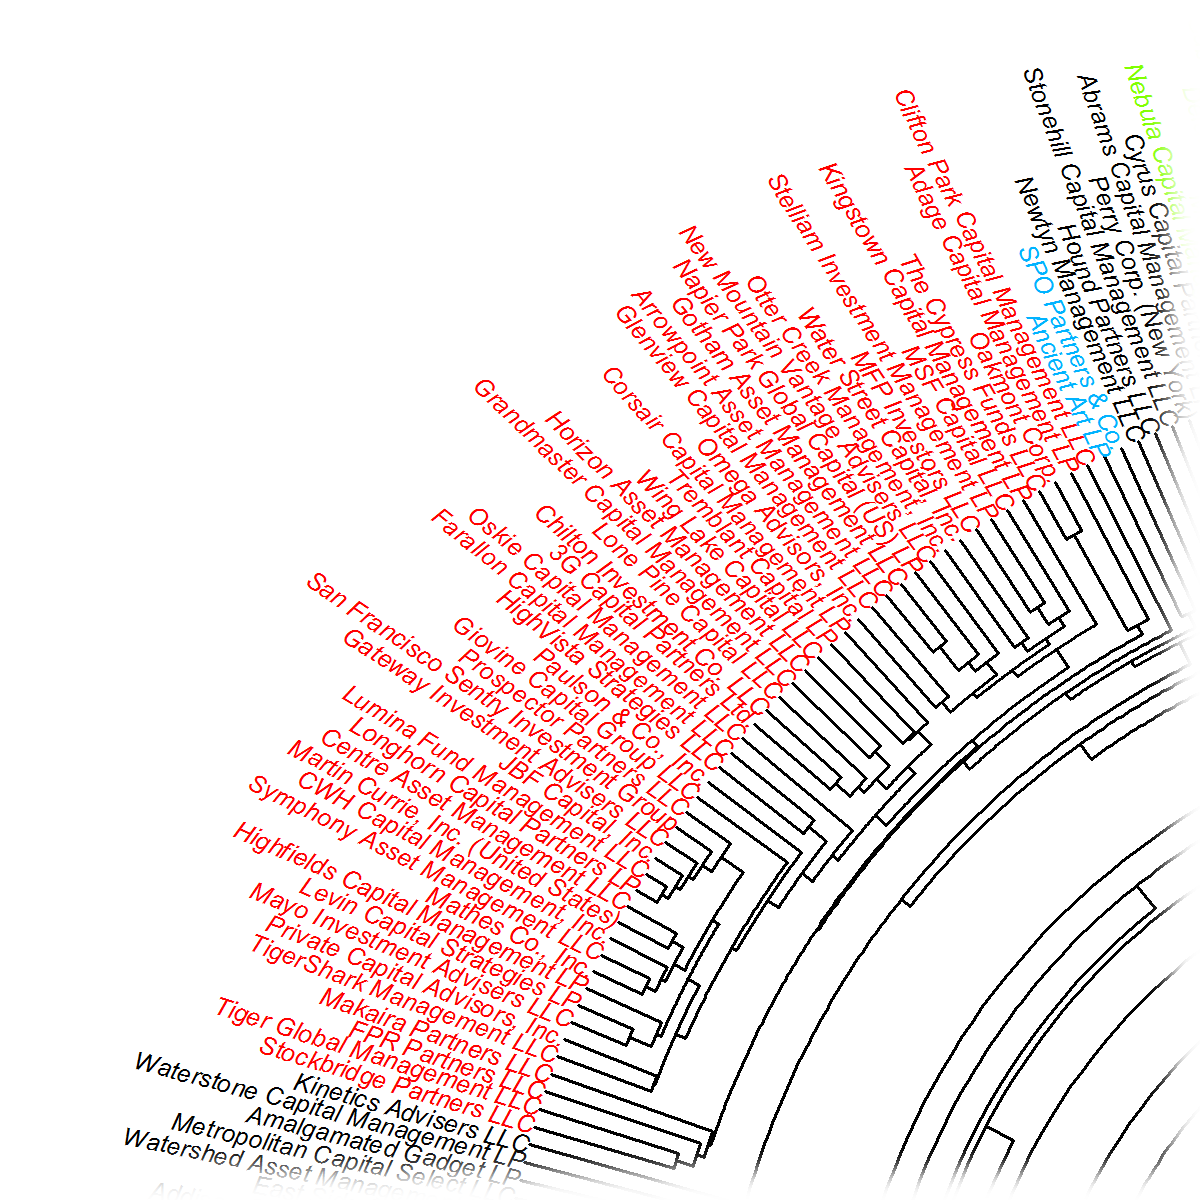
The Largest Hedge Fund Cluster – Long Portfolios
The Lumina-Longhorn Hedge Fund Cluster
The largest cluster is the Lumina-Longhorn Cluster, named after two of its most similar members:
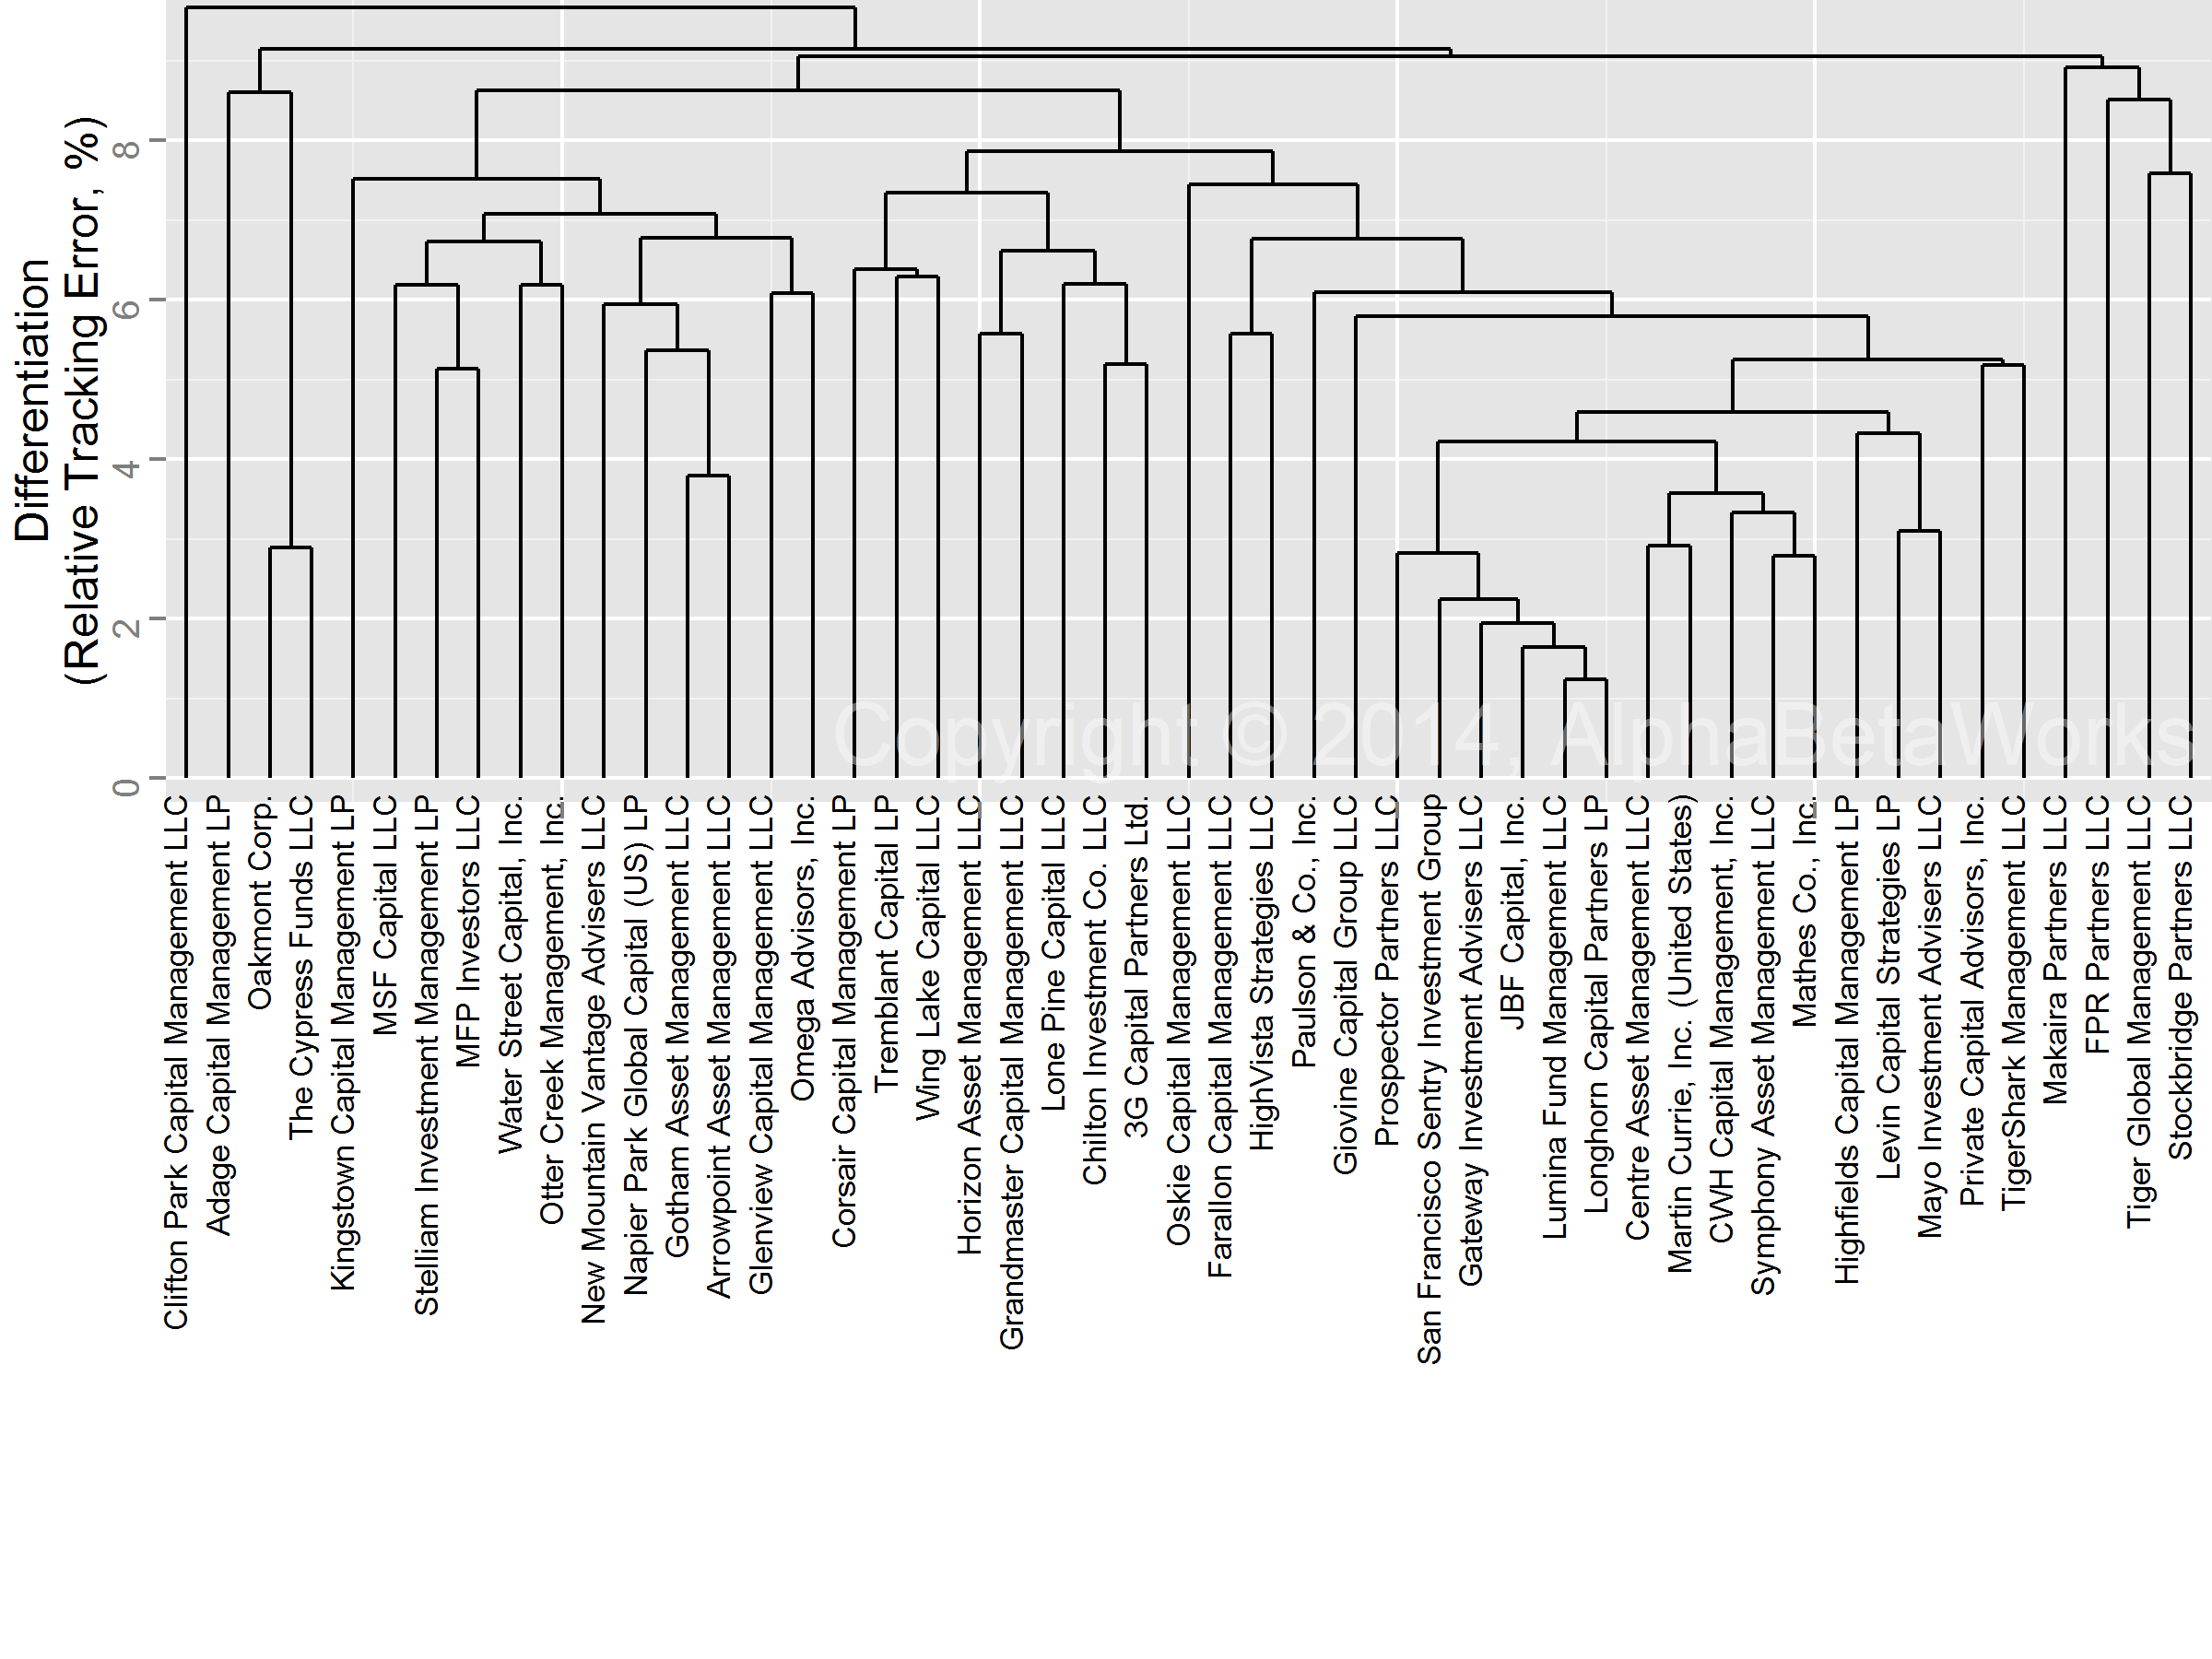
The Lumina-Longhorn Hedge Fund Cluster
In addition to their low differentiation, many members’ long portfolios appear to be closet indexers: This cluster’s estimated future tracking error relative to the U.S. Market is approximately 1.8%.
| Source | Volatility (%) | Share of Variance (%) |
| Factor | 1.50 | 71.48 |
| Residual | 0.95 | 28.52 |
| Total | 1.78 | 100.00 |
Put differently: this cluster’s return will differ from the market by more than 1.8% only about a third of the time. Most of this tracking error (1.5% out of 1.8%) is due to a few factor bets. This cluster and many of its members are nearly passive. Consequently, some investors are paying active fees for undifferentiated, passive long portfolios.
Lumina-Longhorn Cluster Factor (Systematic) Crowding
Below are this cluster’s significant factor exposures (in red) relative to the Russell 3000 (in gray):
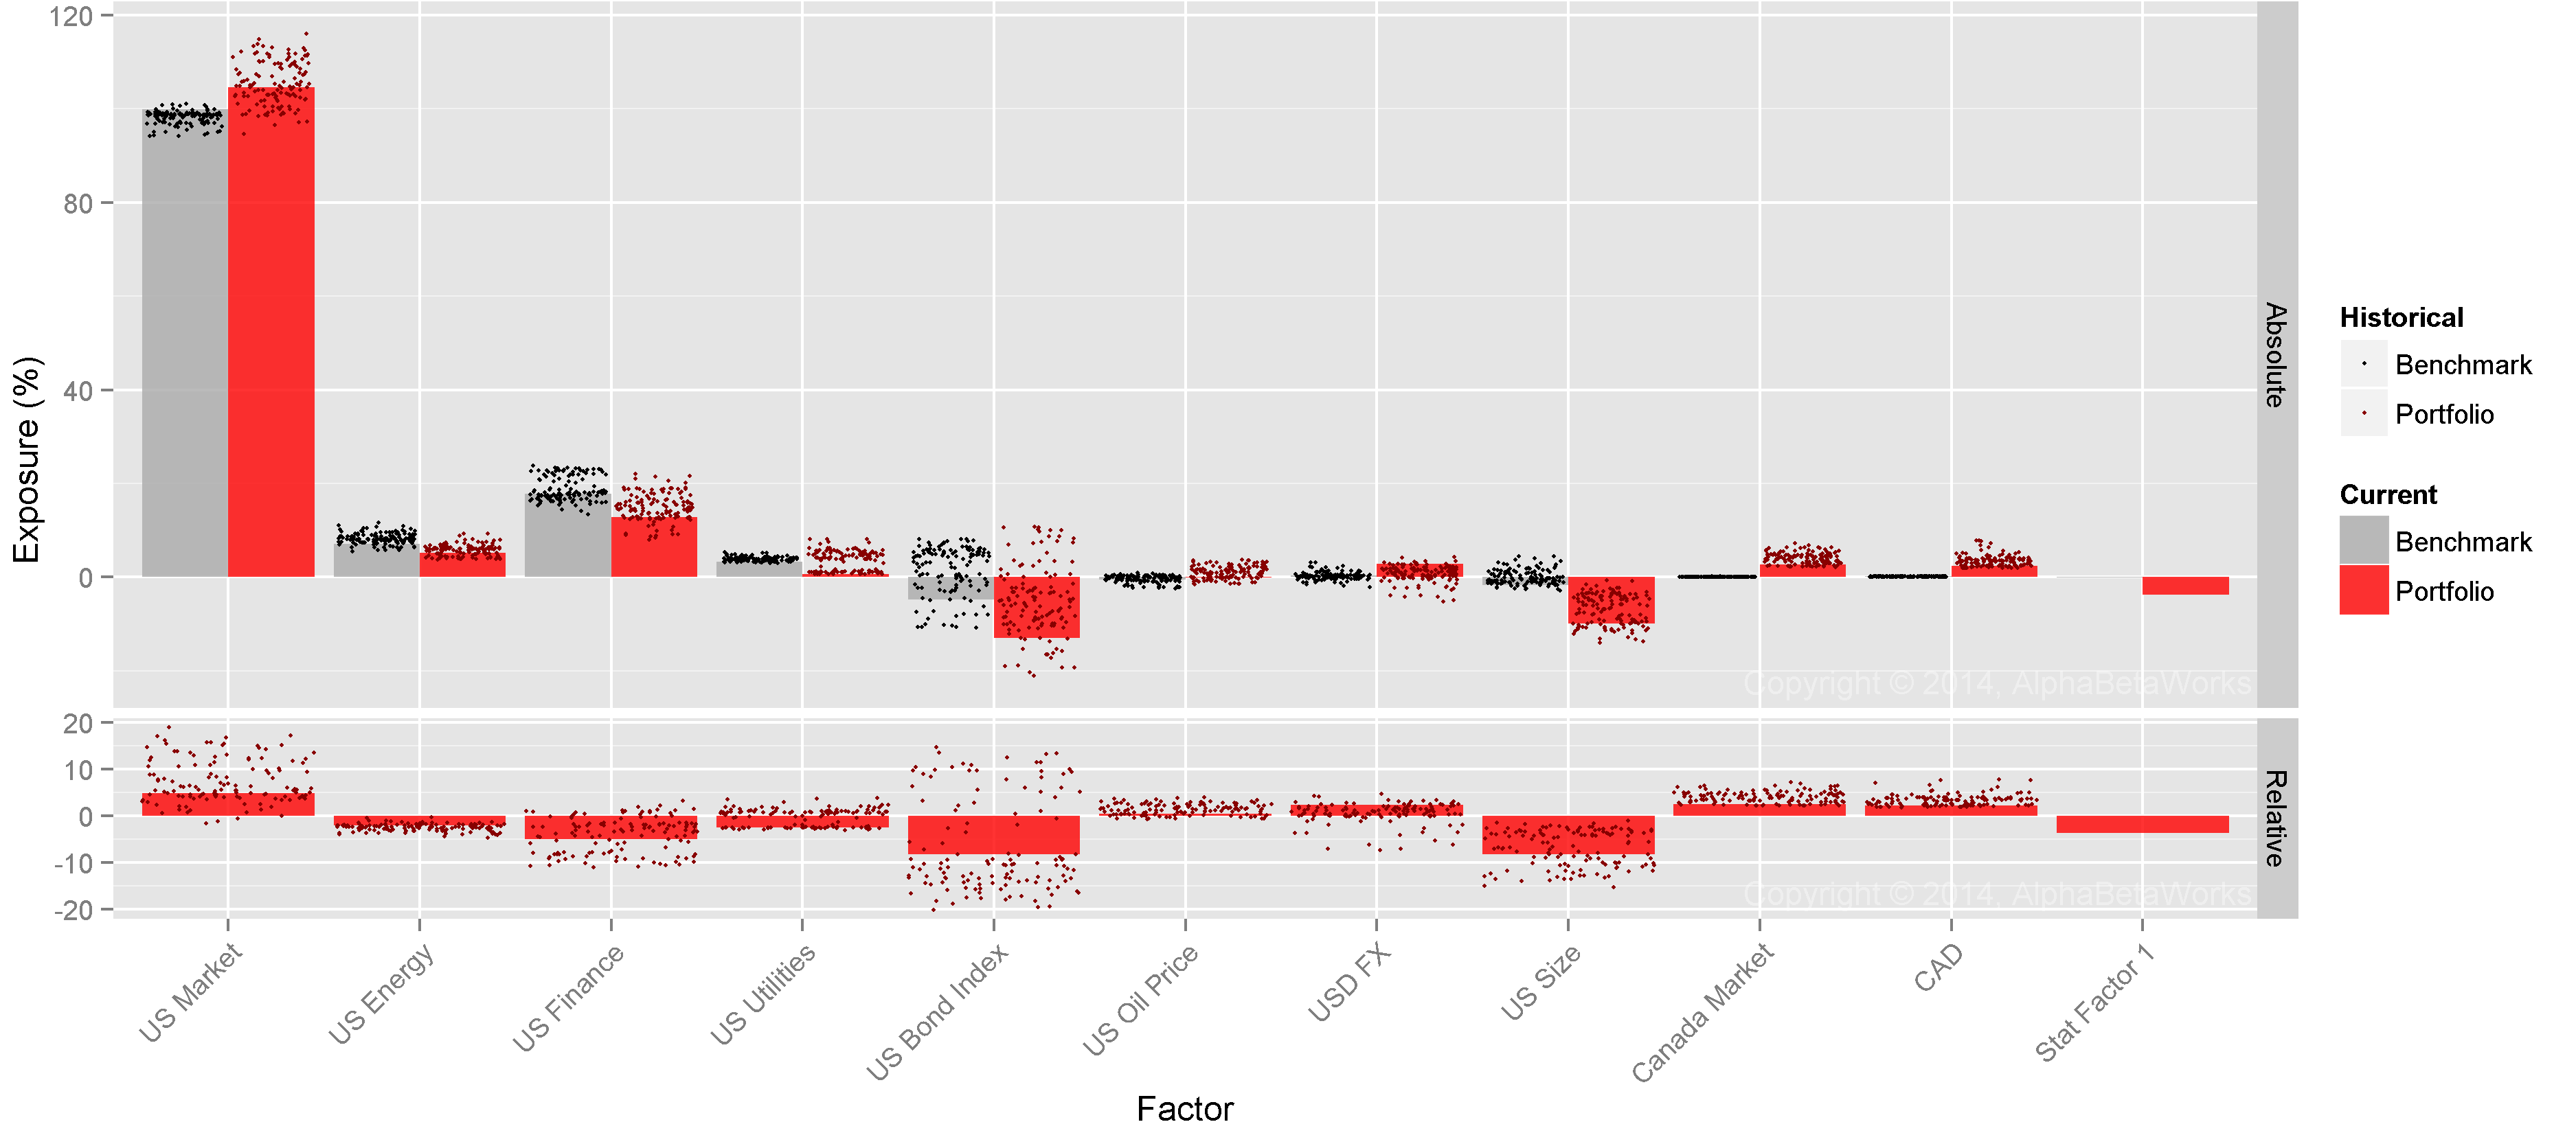
Factor Exposures of the Lumina-Longhorn Hedge Fund Cluster
Market (high-beta) and Size (small-cap) exposures are responsible for most of this cluster’s relative factor risk (i.e. systematic tracking error relative to the Market). Bond and Canadian Market exposures are the next two most significant contributors:
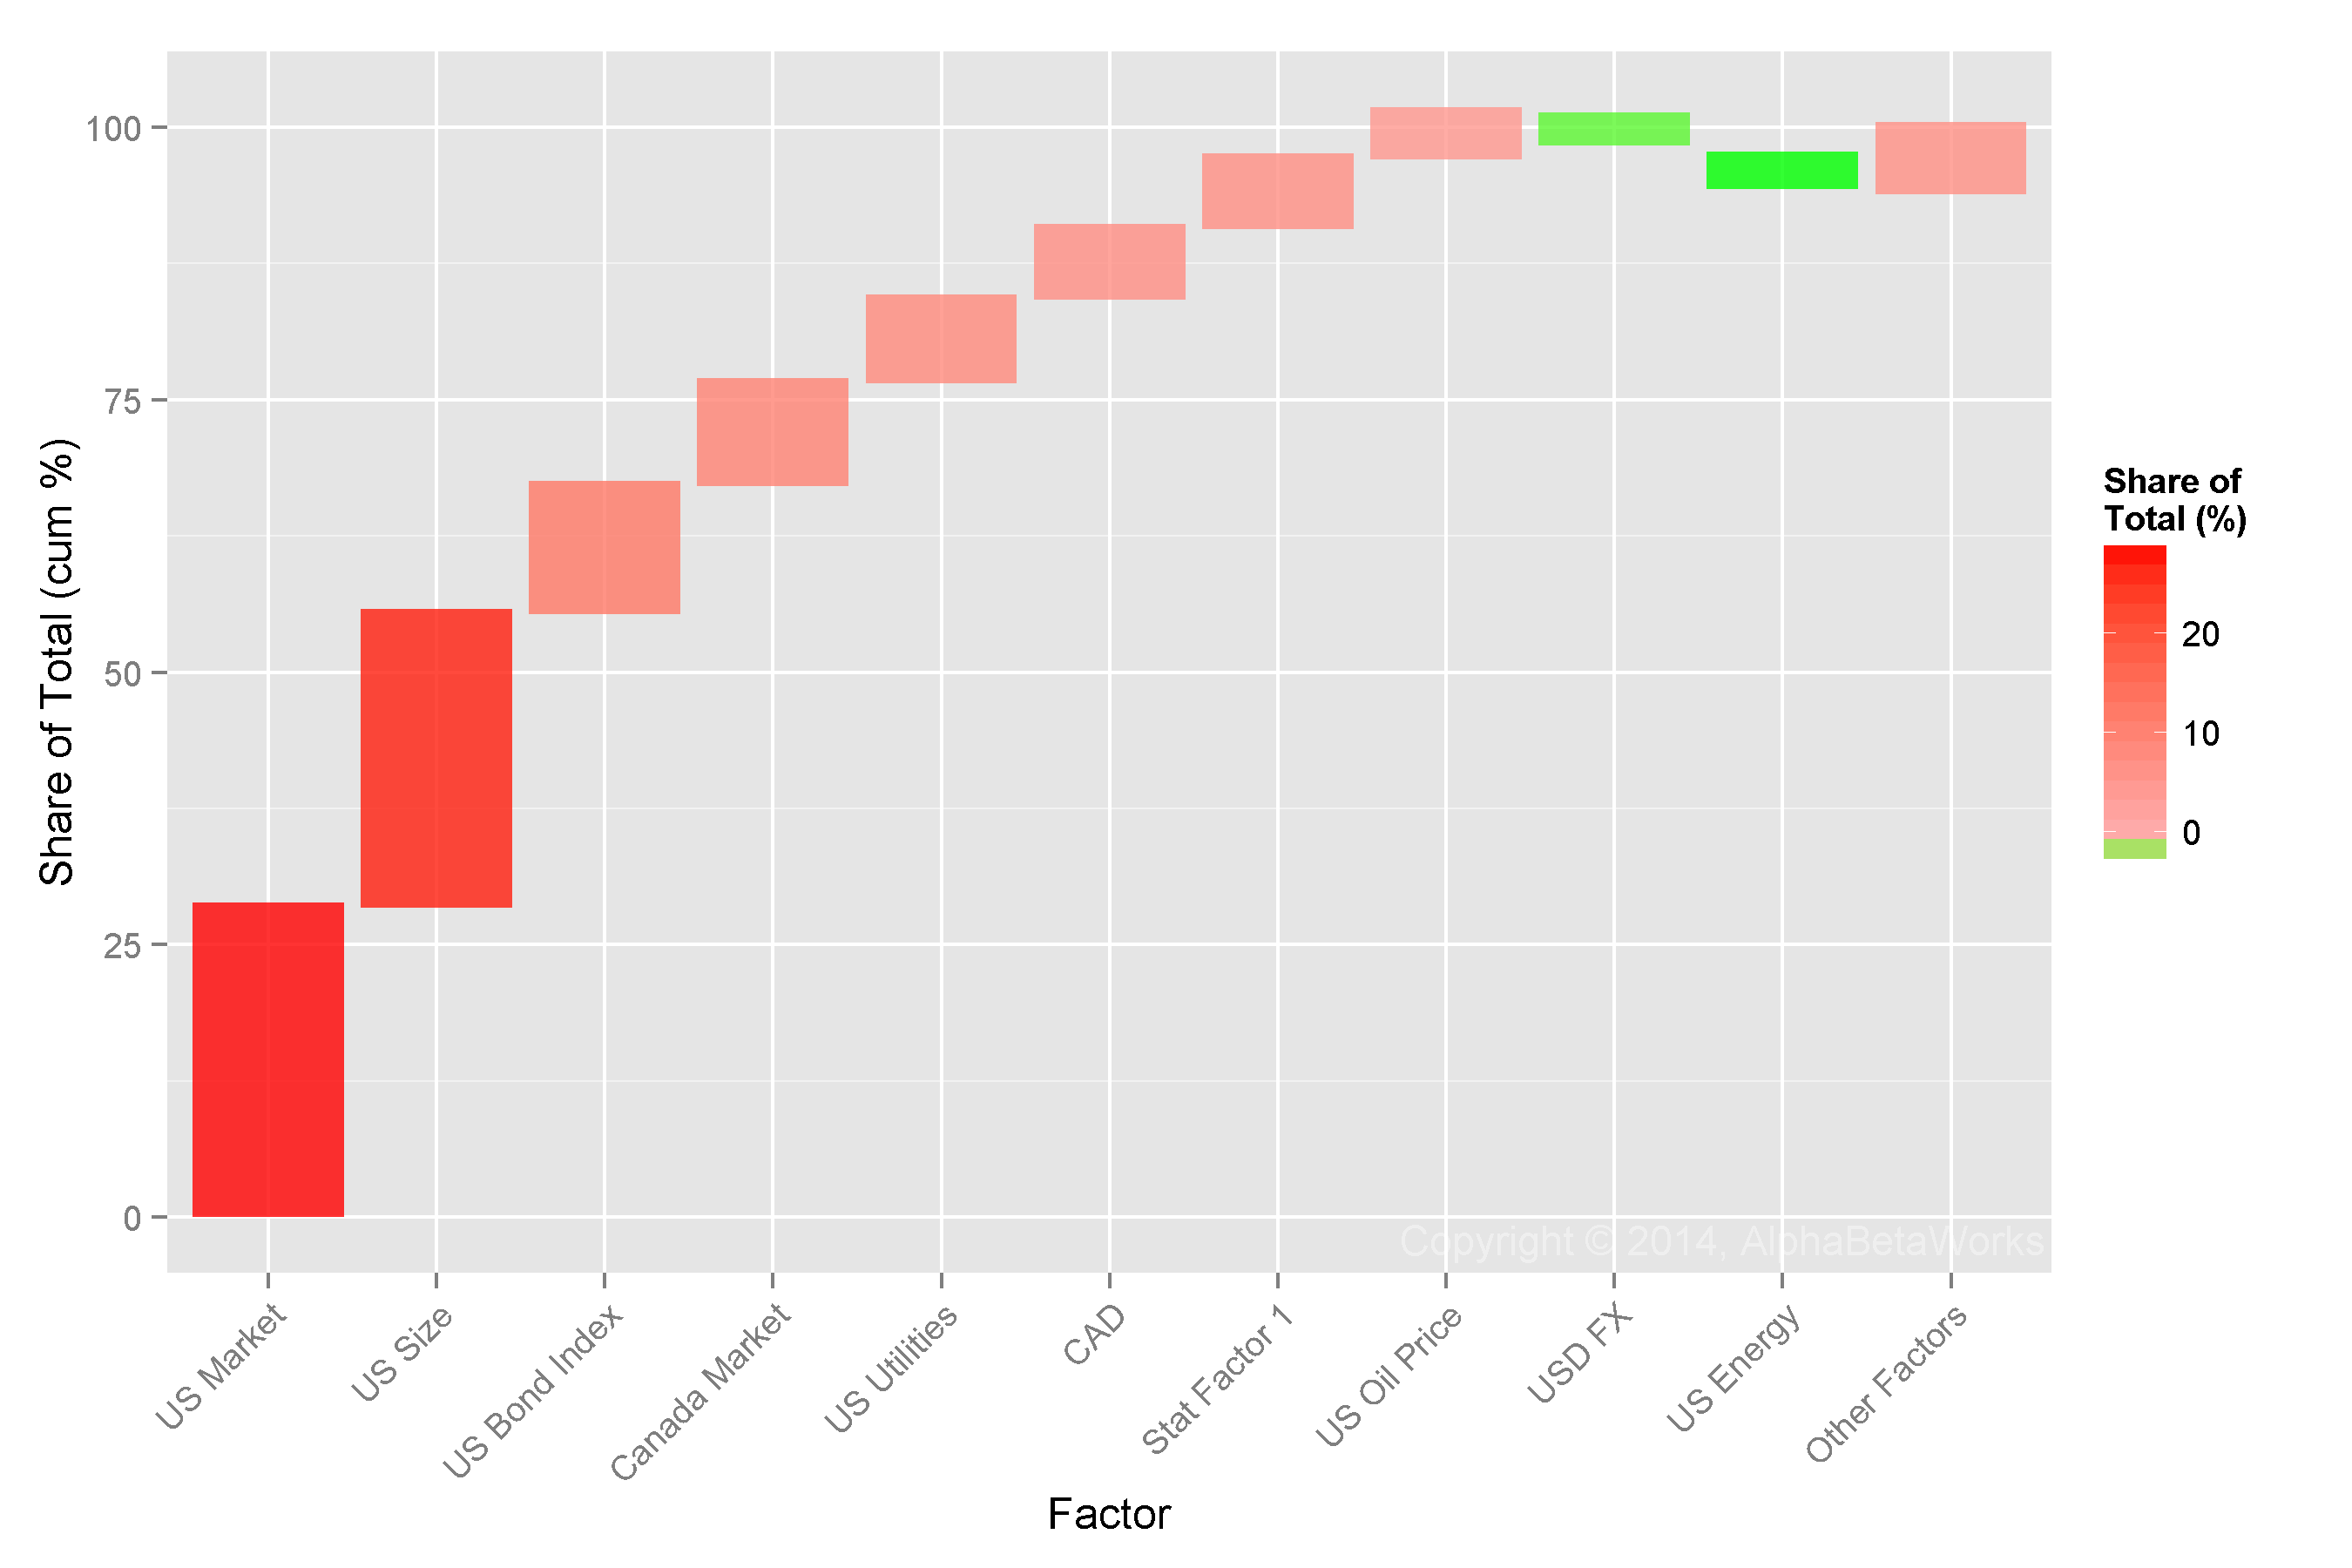
Factors Contributing Most to Relative Variance of the Lumina-Longhorn Hedge Fund Cluster
Lumina-Longhorn Cluster Residual (Idiosyncratic) Crowding
There is less residual crowding in this cluster than in the broader HF Aggregate. In the HF Aggregate, just six stocks were responsible for over half of the relative residual risk and just two stocks were responsible for over a quarter. By contrast, in the Lumina-Longhorn Cluster, four stocks are responsible for a quarter of the relative residual risk:
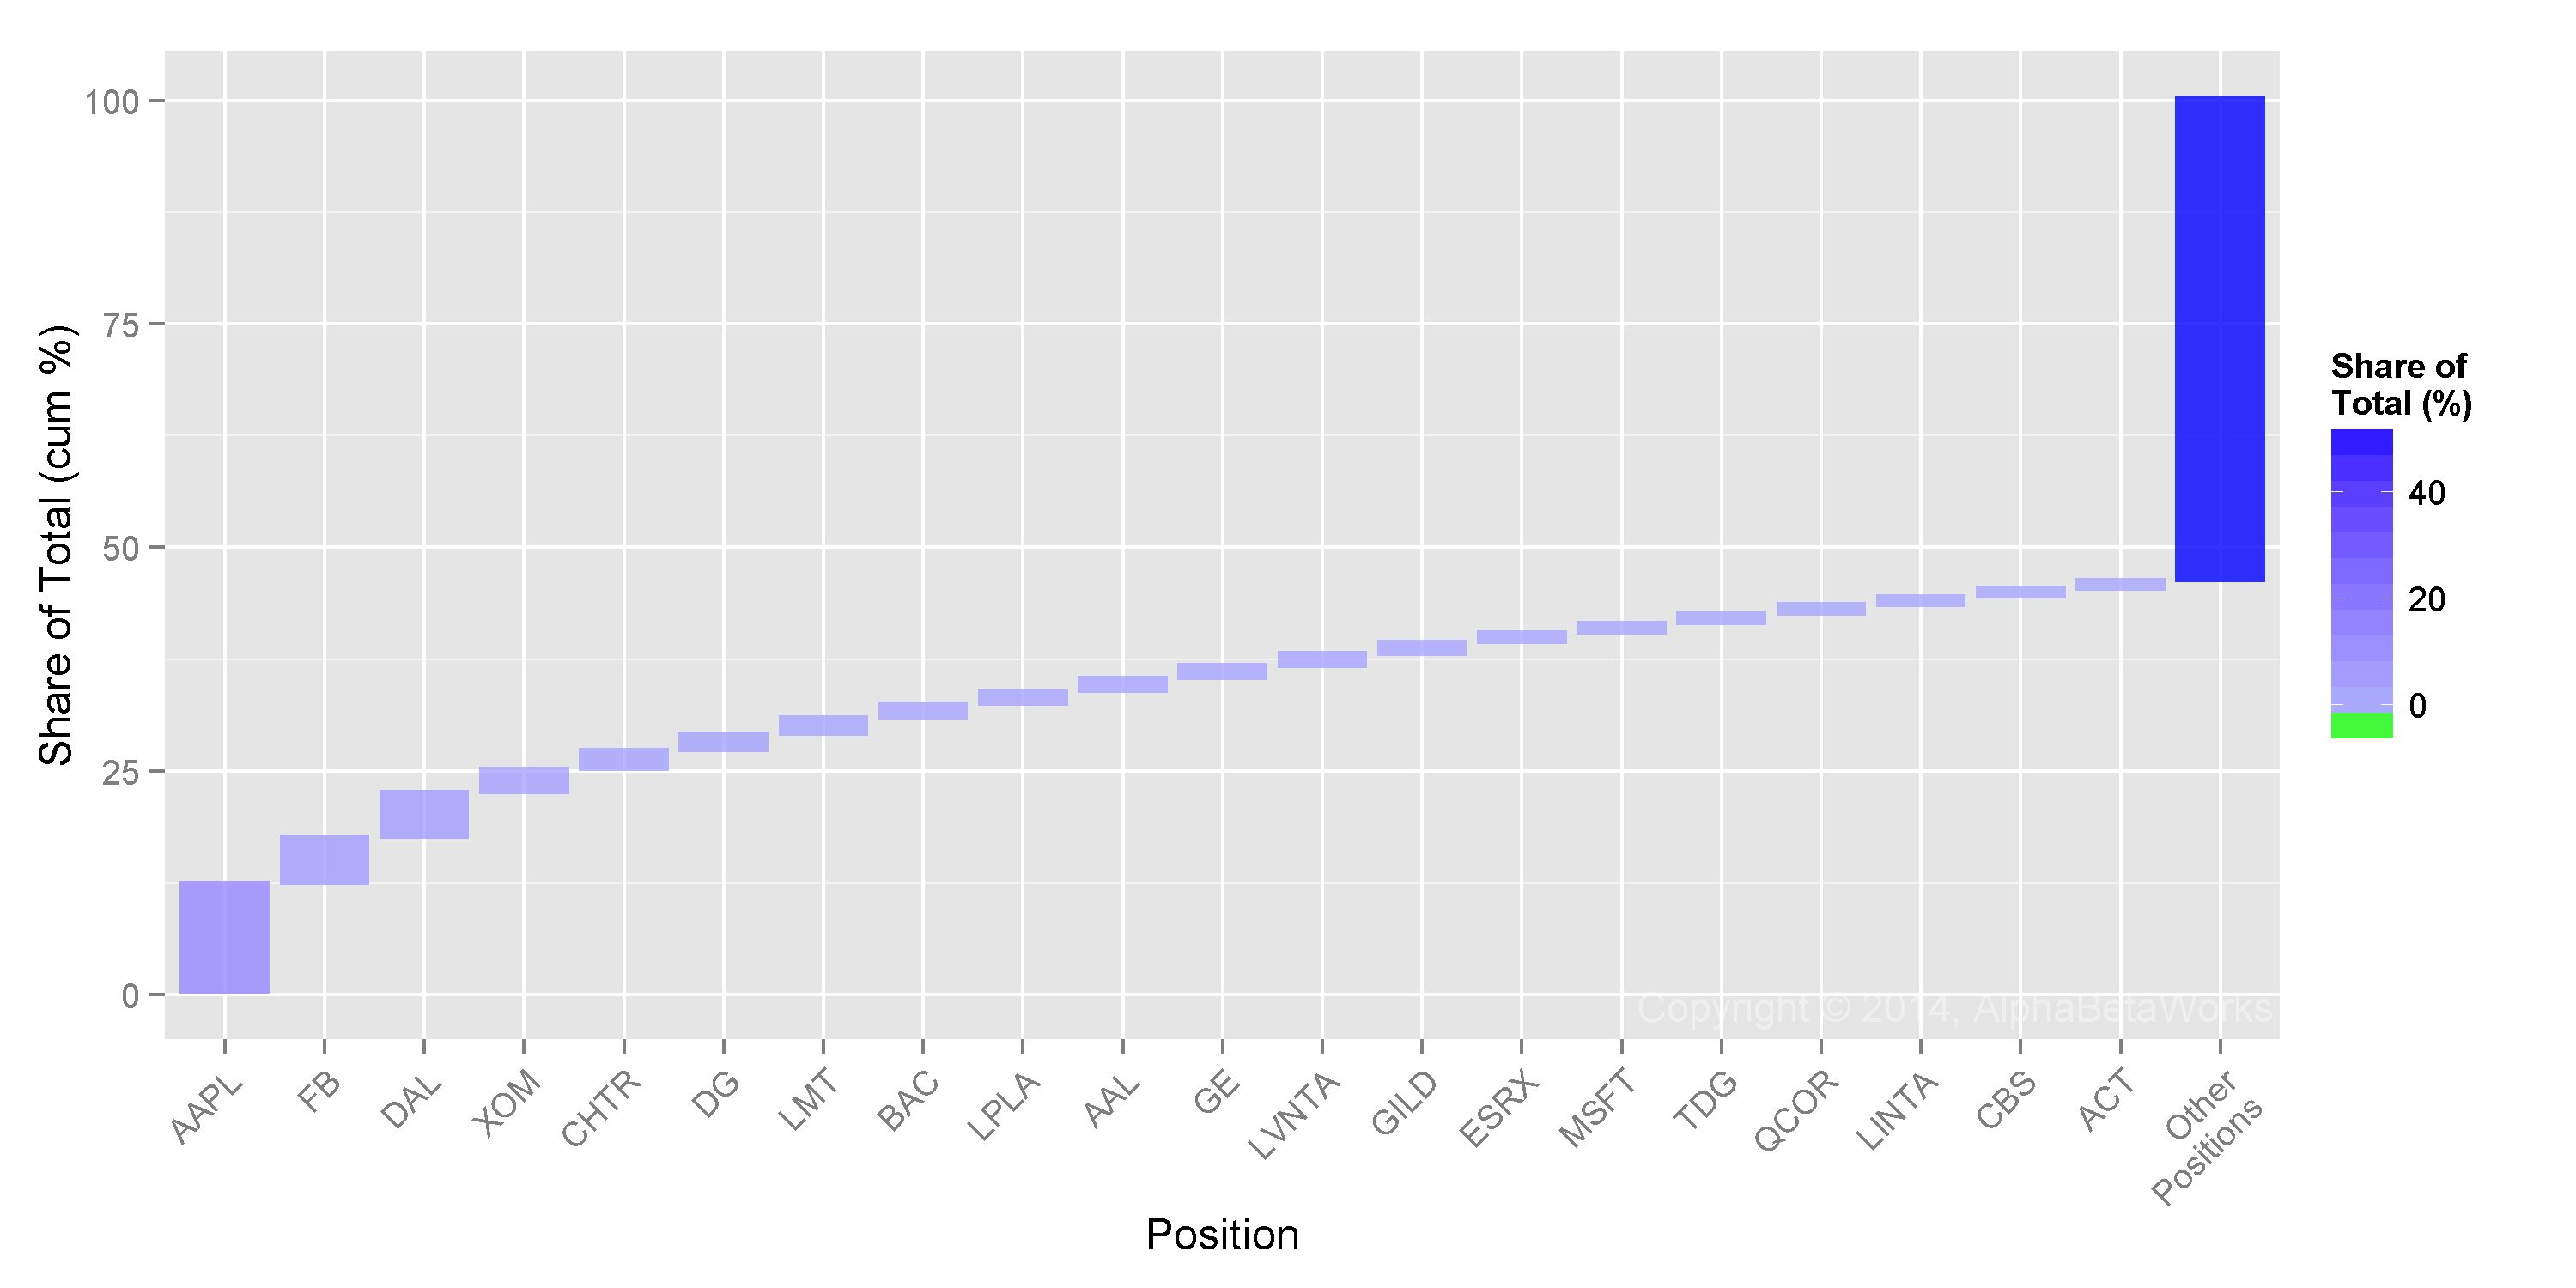
Stocks Contributing Most to Relative Residual Variance of the Lumina-Longhorn Hedge Fund Cluster
The stock-specific bets that these funds share differ from the HF Aggregate. AAPL, FB, and DAL are most prominent. In summary:
Stock-specific bets of the HF Aggregate:
| Symbol | Name | Share of Variance (%) |
| LNG | Cheniere Energy, Inc. | 13.01 |
| AGN | Allergan, Inc. | 11.56 |
| VRX | Valeant Pharmaceuticals International, Inc. | 9.74 |
| MU | Micron Technology, Inc. | 9.31 |
| BIDU | Baidu, Inc. Sponsored ADR Class A | 4.73 |
| AIG | American International Group, Inc. | 3.68 |
| CHTR | Charter Communications, Inc. Class A | 3.48 |
| PCLN | Priceline Group Inc | 2.43 |
| SUNE | SunEdison, Inc. | 1.91 |
| CAR | Avis Budget Group, Inc. | 1.57 |
Stock-specific bets of the Lumina-Longhorn Hedge Fund Cluster:
| Symbol | Name | Share of Variance (%) |
| AAPL | Apple Inc. | 12.15 |
| FB | Facebook, Inc. Class A | 5.19 |
| DAL | Delta Air Lines, Inc. | 5.00 |
| XOM | Exxon Mobil Corporation | 2.59 |
| CHTR | Charter Communications, Inc. Class A | 2.13 |
| DG | Dollar General Corporation | 1.86 |
| LMT | Lockheed Martin Corporation | 1.77 |
| BAC | Bank of America Corporation | 1.59 |
| LPLA | LPL Financial Holdings Inc. | 1.45 |
| AAL | American Airlines Group, Inc. | 1.44 |
Crowding within the Lumina-Longhorn Cluster may not sway AAPL, FB, or DAL. However, these consensus bets will be the primary contributors to the active returns of the Lumina-Longhorn Cluster and many member funds. As a result, moves in AAPL, FB, or DAL will be the primary (and unintended) drivers of some allocators’ idiosyncratic performance. Allocators unaware of hedge fund clustering and hedge fund crowding may be investing in an undifferentiated pool of consensus bets and paying high fees for closet indexing.
Note that crowding and clustering are common among mutual funds as well. Closet indexing may be practiced by 70% of “active” U.S. mutual funds. This article’s focus is hedge funds, where high fees make fund differentiation especially important.
Summary
- A more complete view of hedge fund crowding reveals clusters of funds with similar bets.
- The largest cluster consists of approximately 50 funds with shared factor and residual exposures.
- This cluster’s factor herding leans primarily toward Market (high-beta), Size (small-cap), Bond (levered and macroeconomically-sensitive companies), and Canadian Market bets.
- This cluster’s residual herding leans toward AAPL, FB, and DAL. Other stock-specific bets are diversified.
- Allocators unaware of the clustering of their funds may be investing in undifferentiated portfolios of consensus ideas.


Curious, a couple questions:
1. What do the colors signify?
2. Were the groupings done solely by tracking error? Or by concentration of specific securities? Over what time period?
Thanks, great analysis.
Thank you!
The main clustering diagram (https://abwinsights.com/wp-content/uploads/2014/10/HedgeFundLongClustering.png) is divided into clusters of funds with forecasted annual relative tracking errors <= 10%. Each of these is colored to aid in visual identification of the clusters. So cluster colors here signify groups of similar funds. Groupings are done by estimated future tracking error, as determined by funds’ long positions at the time of analysis. I believe we used Q3 2014 filings. The tracking error estimate takes into account both, clustering of idiosyncratic risk due to shared securities and clustering of systematic risk due to shared factor exposures of these securities. Importantly, this does not perform returns-based analysis of fund performance since RBSA tends to fail for hedge funds. We apply factor models to funds’ positions and assemble fund exposures from individual positions’ exposures. Security factor exposures are built using 5 years of return history and exponentially weighted with approximately 3 year half-life.