
In periods of high oil price volatility, there is much discussion of its impact on various industries. Market noise obscures true industry-specific performance, so Oil’s impact is impossible to judge from simple index returns. But, by stripping away market effects, we observe the relationships between pure sector and oil returns. Airlines have the largest negative exposure to Oil, yet REITs provide the most consistent negative exposure. In addition, sectors that benefit from increased discretionary spending are significantly negatively levered to Oil. Here we discuss the sectors most exposed to oil price, and quantify the relationships.
Pure Sector Performance
As we illustrated earlier, market noise obscures relationships among individual sectors, concealing industry-specific performance. Without separating pure industry-specific returns from the market, robust risk management, performance attribution, and investment skill evaluation are impossible.
For example, the oilfield services sector generally follows the market – industry trends are indiscernible:
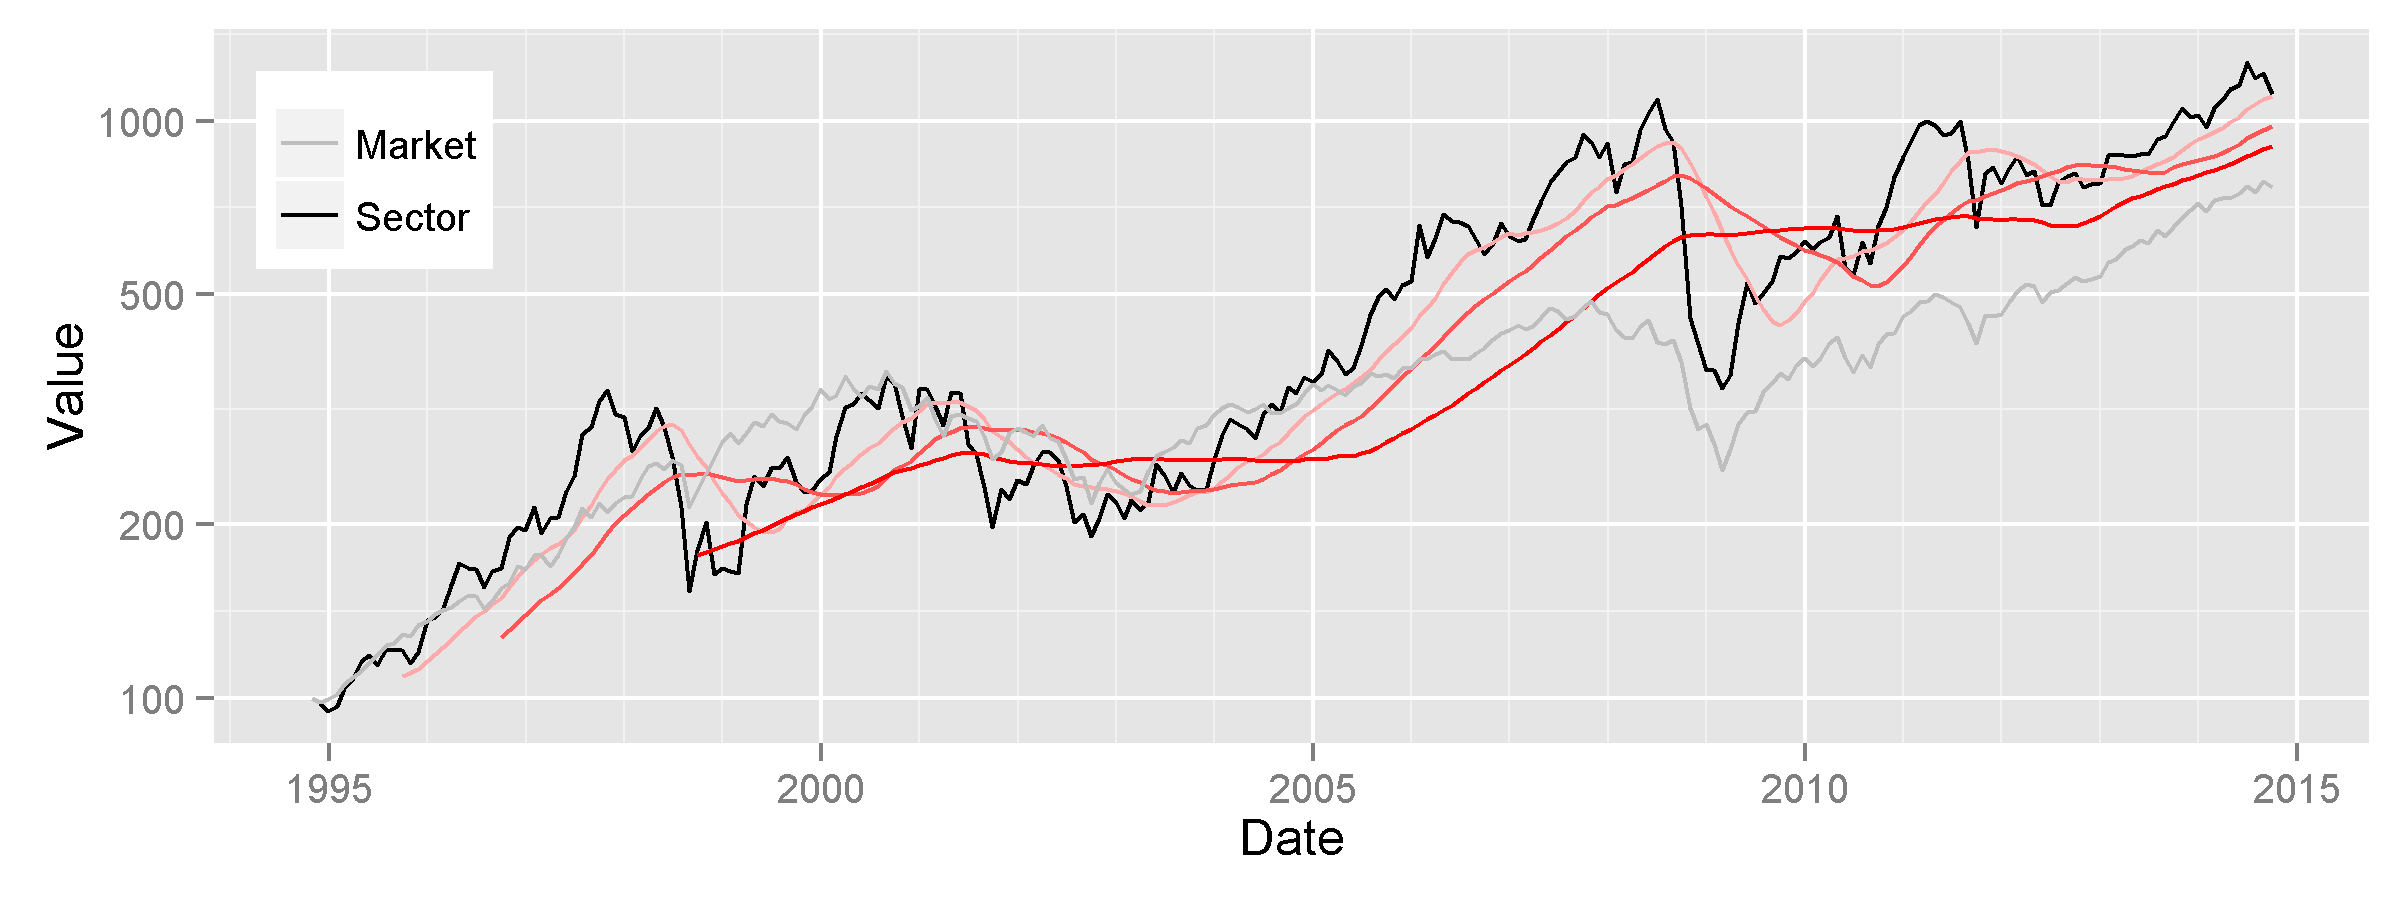
Oilfield Services Sector Index Return
By removing market and macroeconomic effects from security returns and calculating the performance of the pure sector factor, we reveal sector-specific trends:
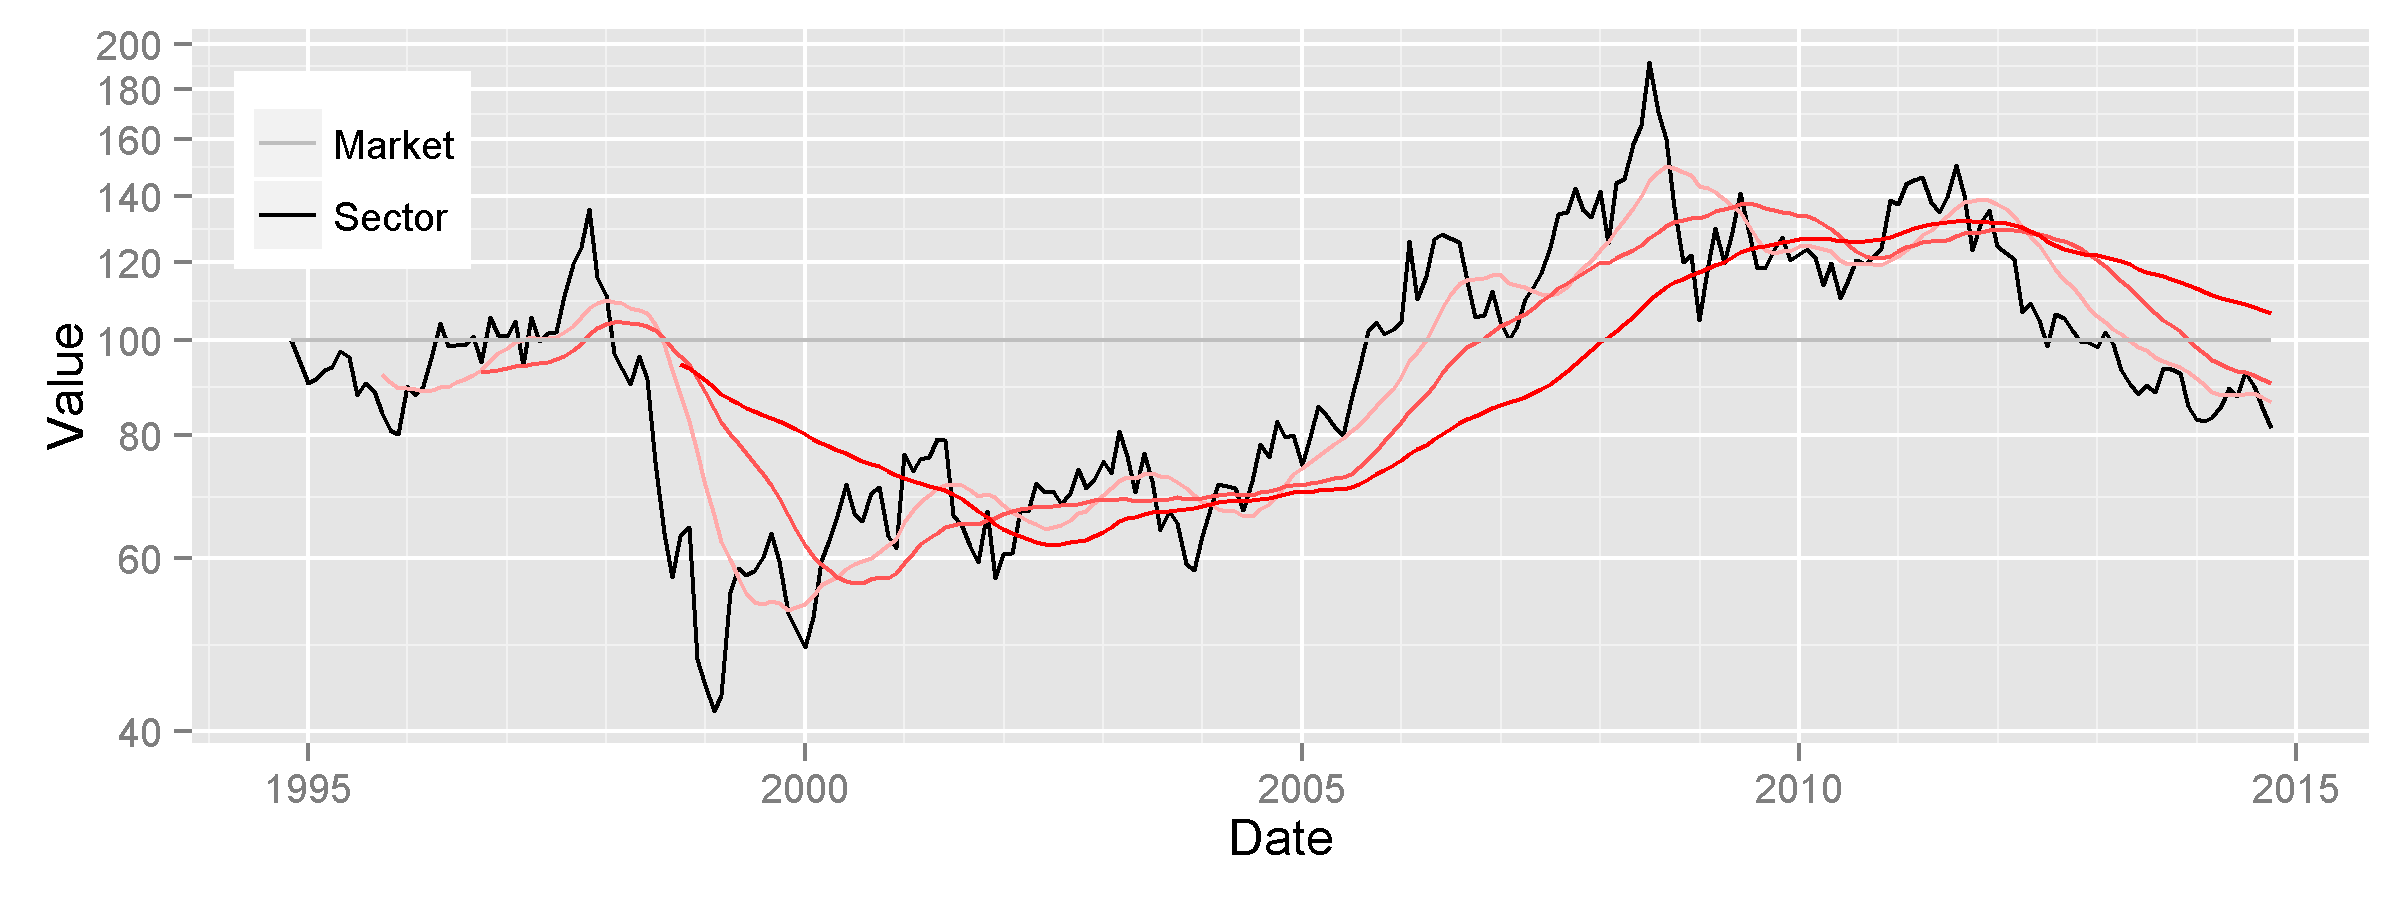
Oilfield Services Pure Sector Return
Within this pure sector performance, we can now identify:
- The late-90s energy industry crash;
- Slow absorption of overcapacity between 2000 and 2005;
- The oilfield services shortage and the energy sector boom between 2005 and 2008;
- Low-cost production growth, over-investment, and a return to overcapacity after 2008.
Since pure sector factors capture sector-specific trends and risks, they also capture sector-specific oil exposure.
Equity Market’s Oil Exposure
In addition to industry-specific oil exposure, the broad equity market is significantly correlated with Oil. Broad macroeconomic risks affect both commodity prices and the equity market:
Oil Price and U.S. Market Return Correlation
Over the past five years, when oil prices increased by 1%, the U.S. equity market increased by approximately 0.4%. Oil price variance explains approximately 28% of U.S. market variance. Perhaps more accurately, 28% of the market variance is explained by shared macroeconomic variables.
The exposure of an individual stock to Oil is a combination of exposures due to its market and pure sector risks.
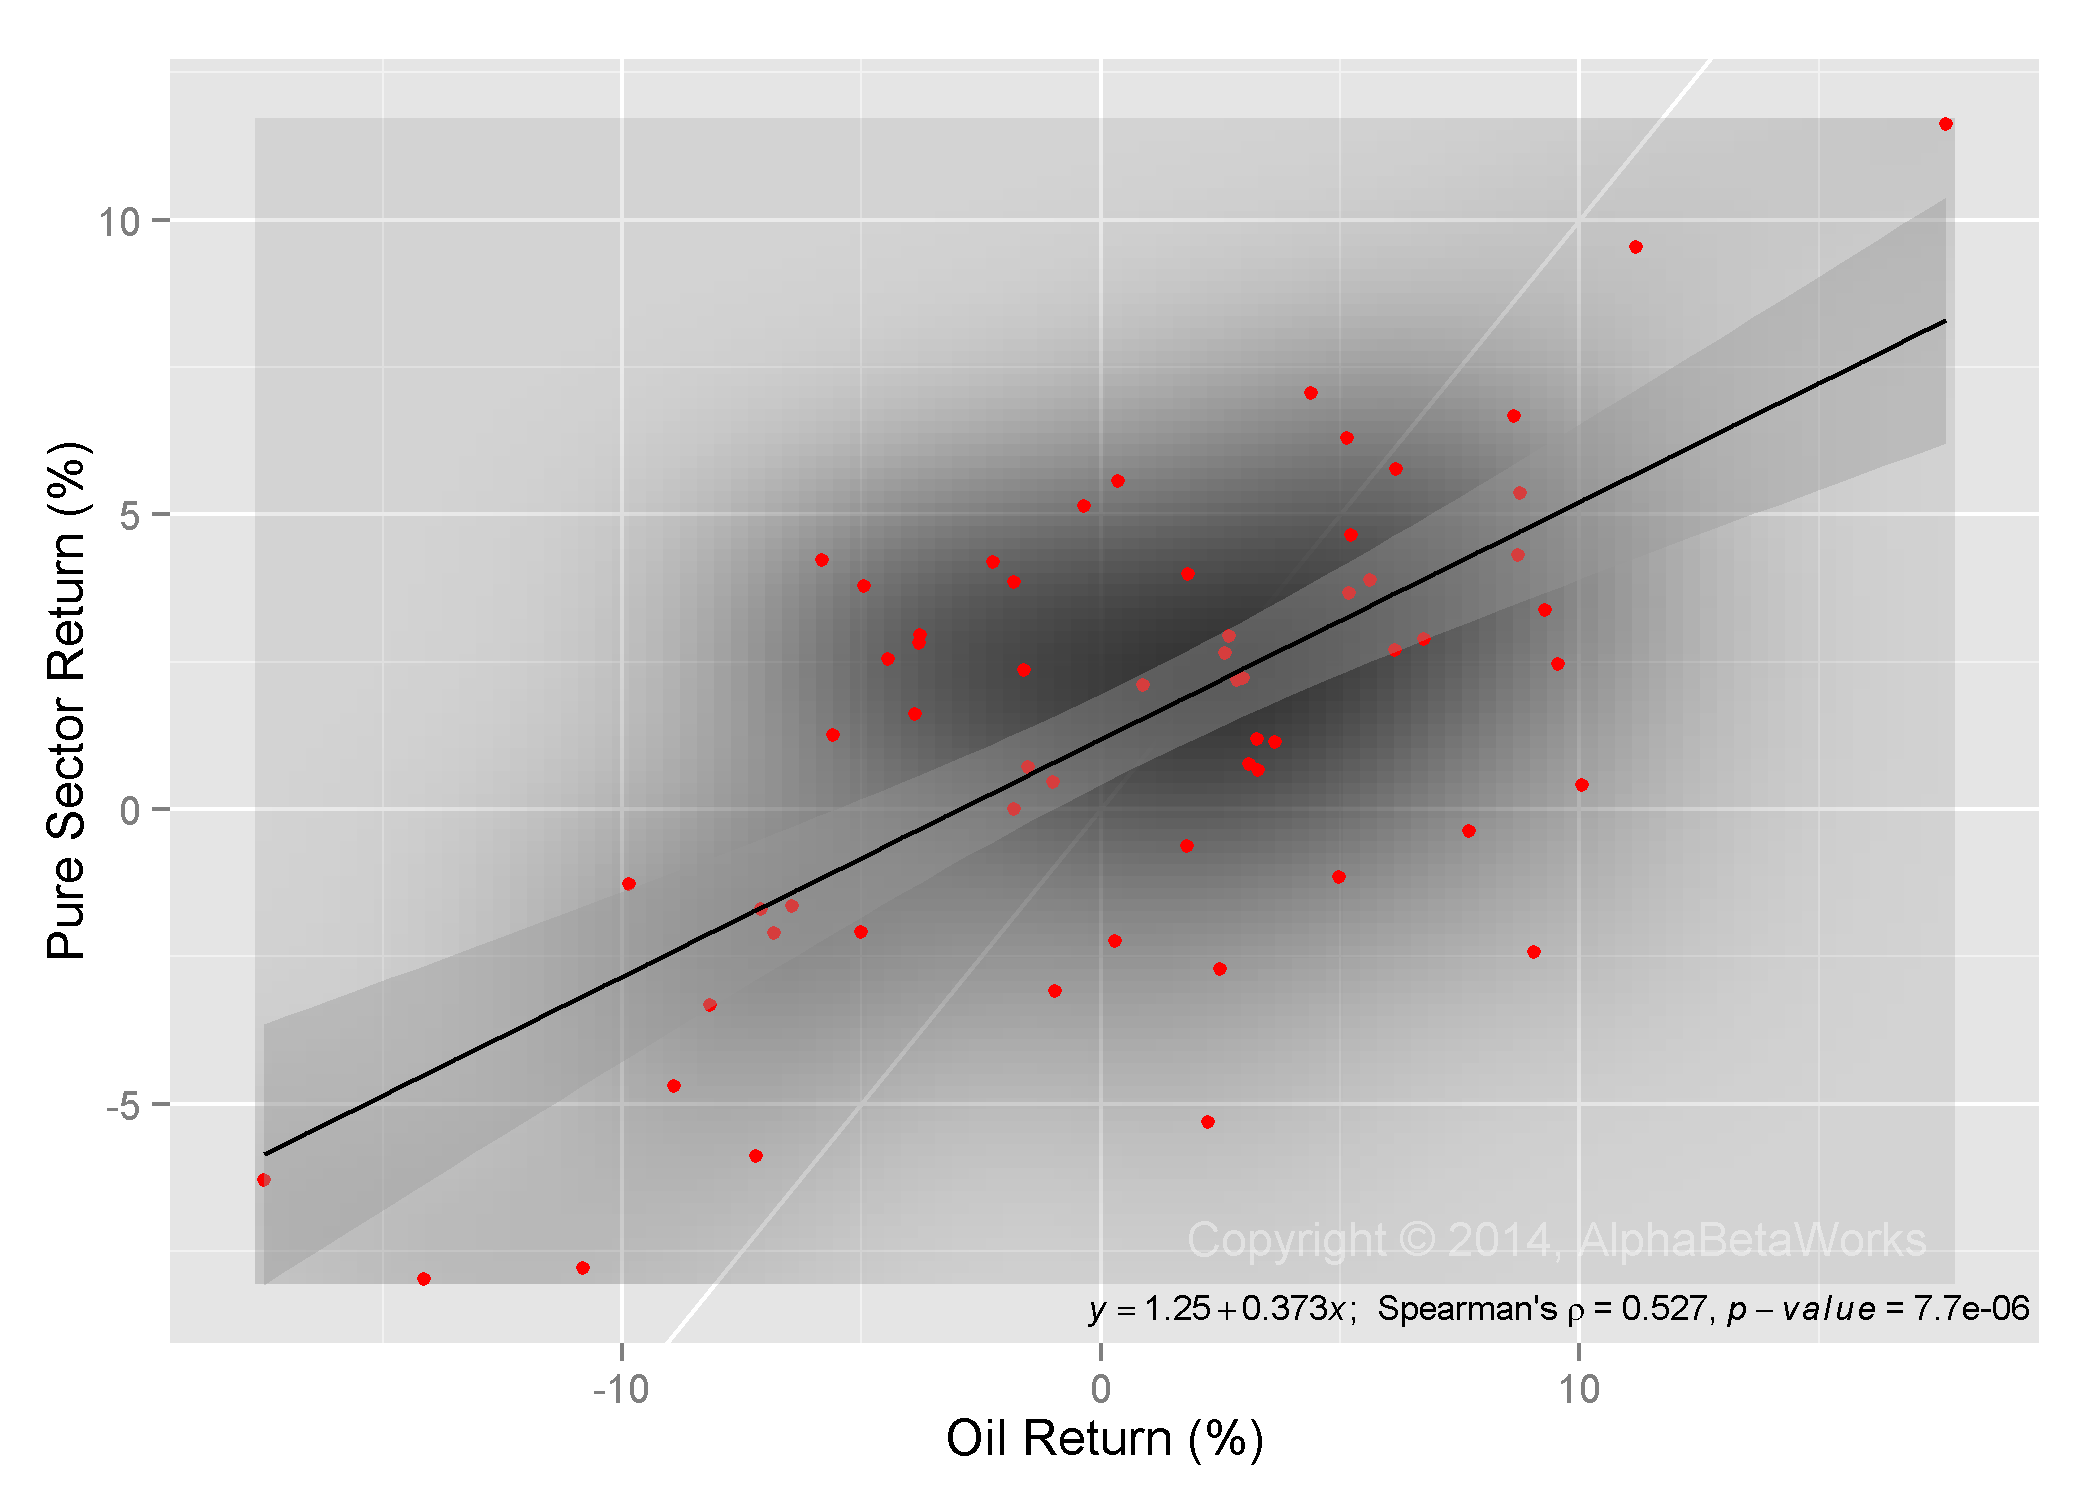
Sectors Most Positively Correlated to Oil
The list of sectors with the highest positive correlation to Oil is hardly surprising:
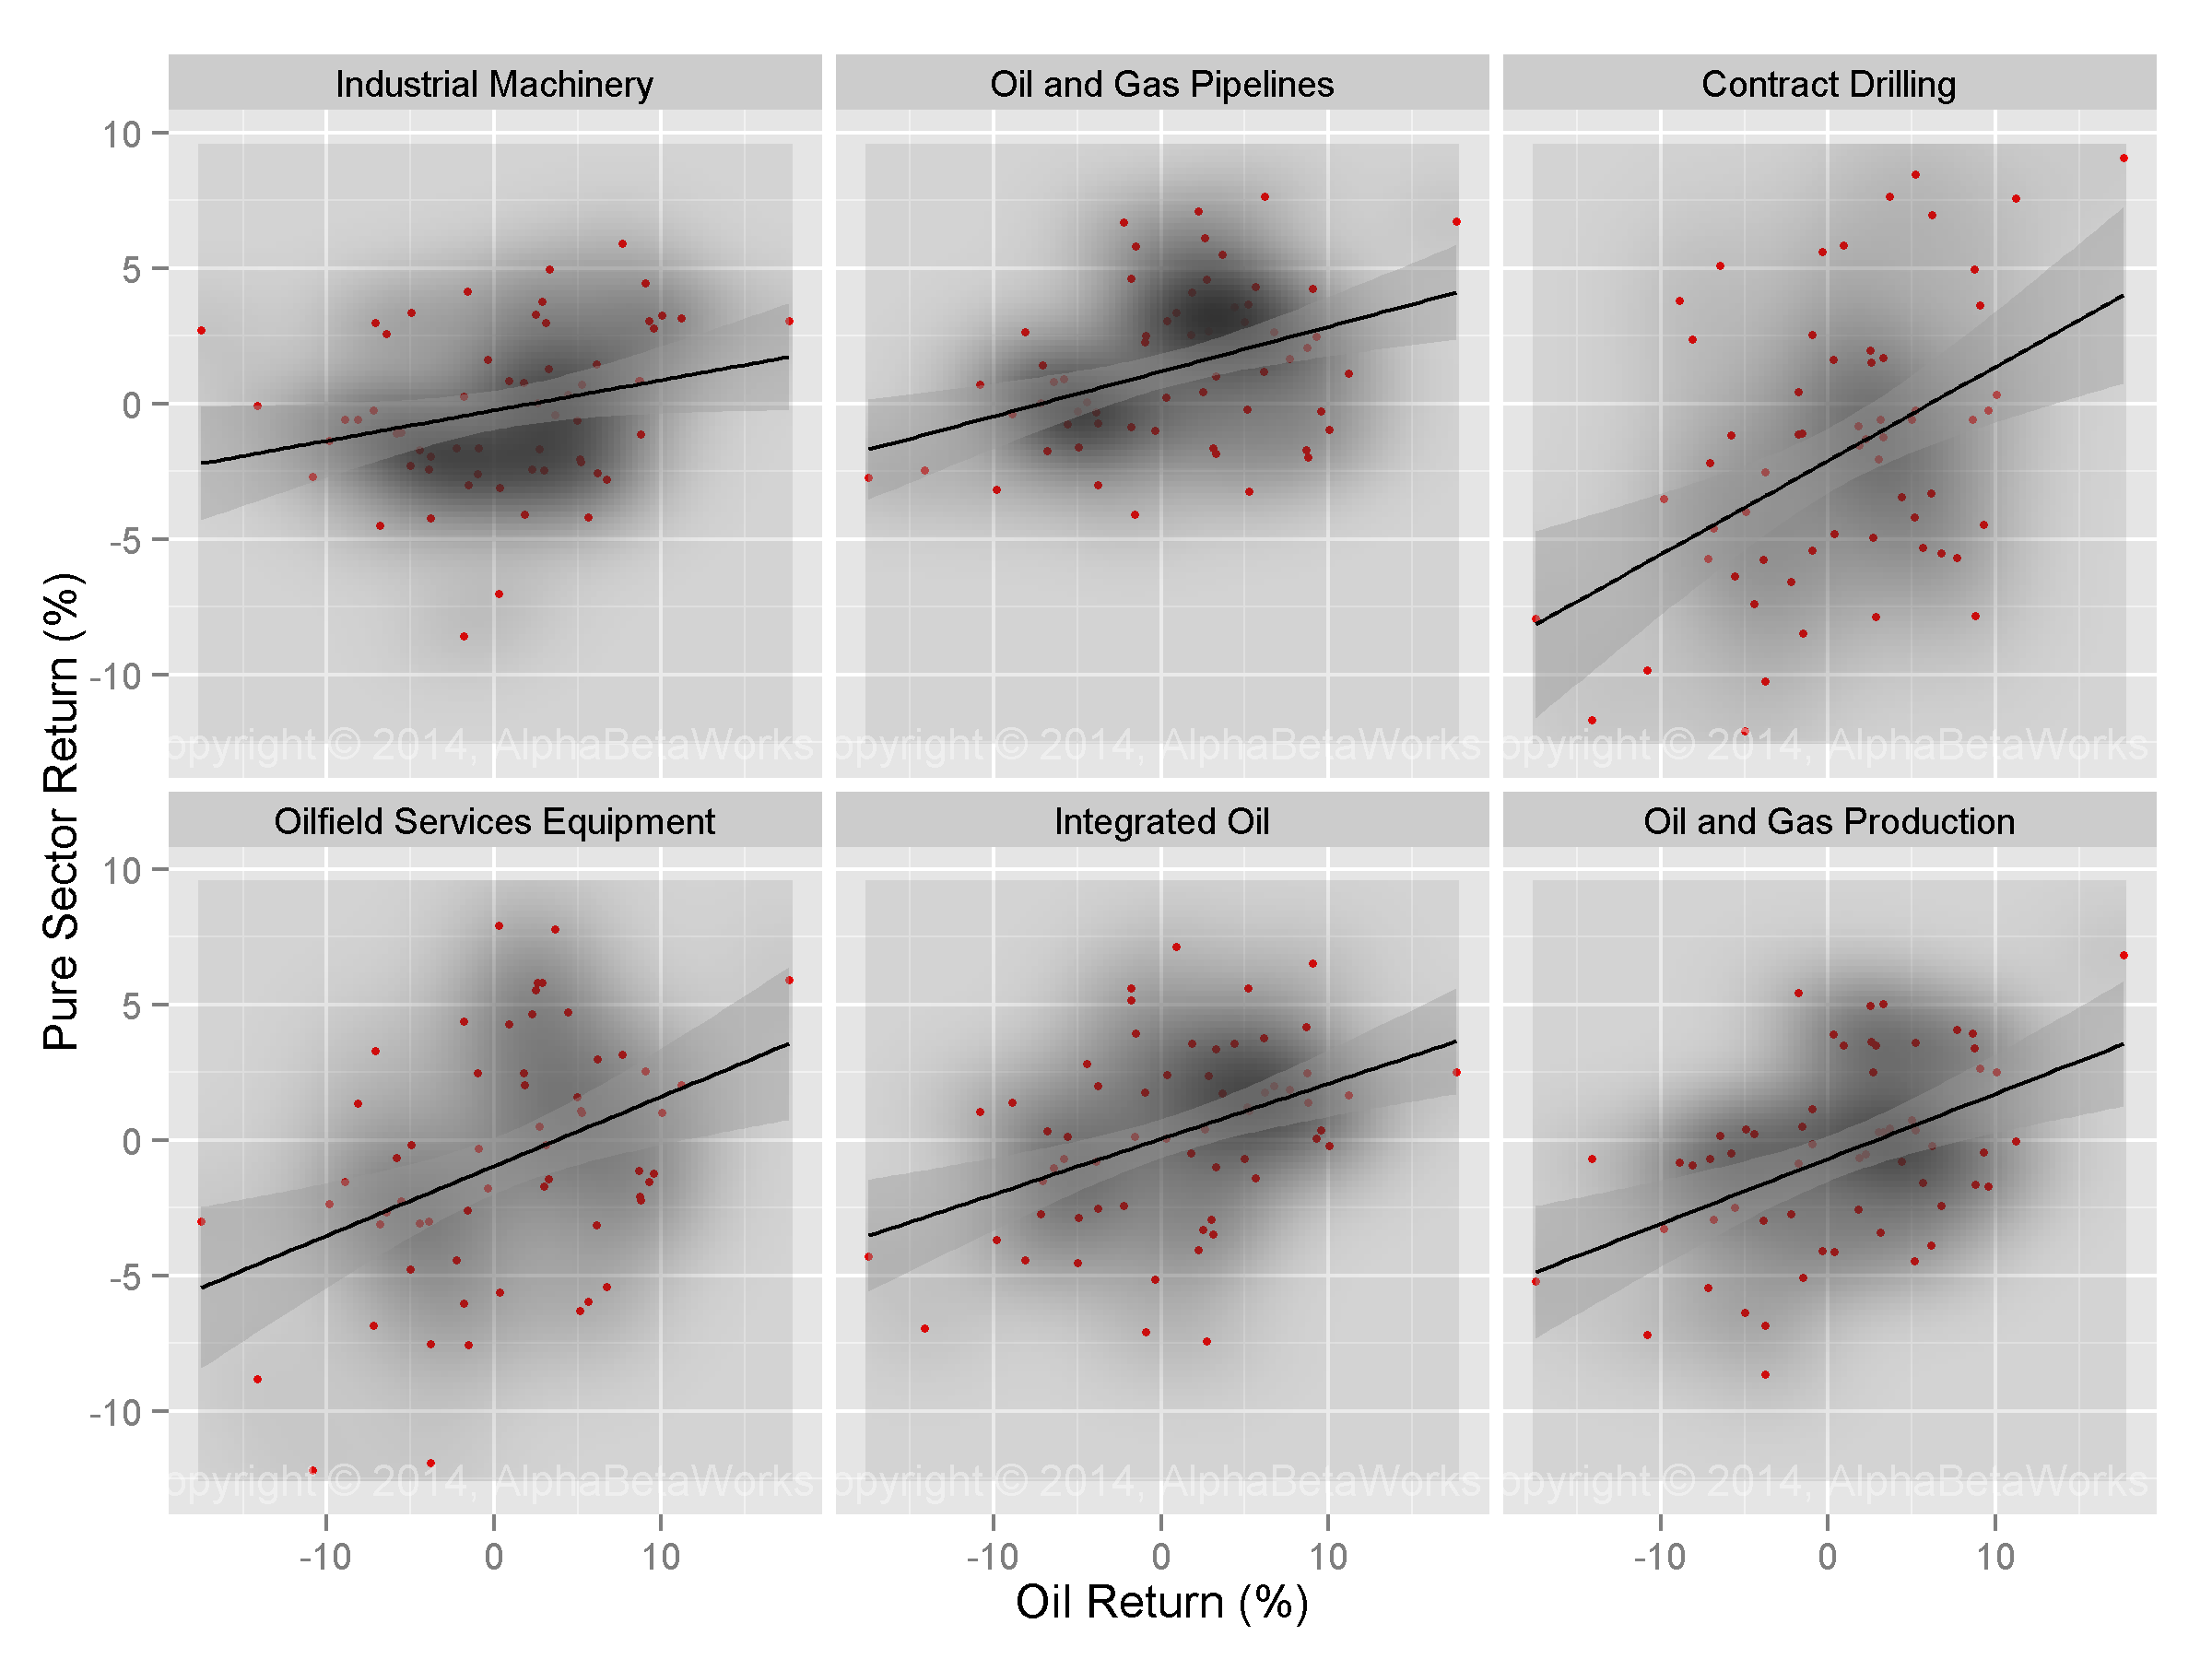
Pure Sector Factors Most Positively Correlated with Oil Price
| Sector | Oil Correlation | p-value |
| Industrial Machinery | 0.29 | 0.0117 |
| Oil and Gas Pipelines | 0.31 | 0.0075 |
| Contract Drilling | 0.37 | 0.0018 |
| Oilfield Services Equipment | 0.38 | 0.0016 |
| Integrated Oil | 0.41 | 0.0006 |
| Oil and Gas Production | 0.43 | 0.0003 |
(We use the Spearman’s rank correlation coefficient to evaluate correlation. Spearman’s correlation is robust against outliers, unlike the commonly used Pearson’s correlation. All correlations are significant; most at 1% level or better.)
Some may find the oil price influence over the industrial machinery sector unexpected. This exposure reflects this sector’s dependence on the energy value chain.
Sectors Most Negatively Correlated to Oil
The list of sectors with the highest negative correlation to Oil is unexpected:
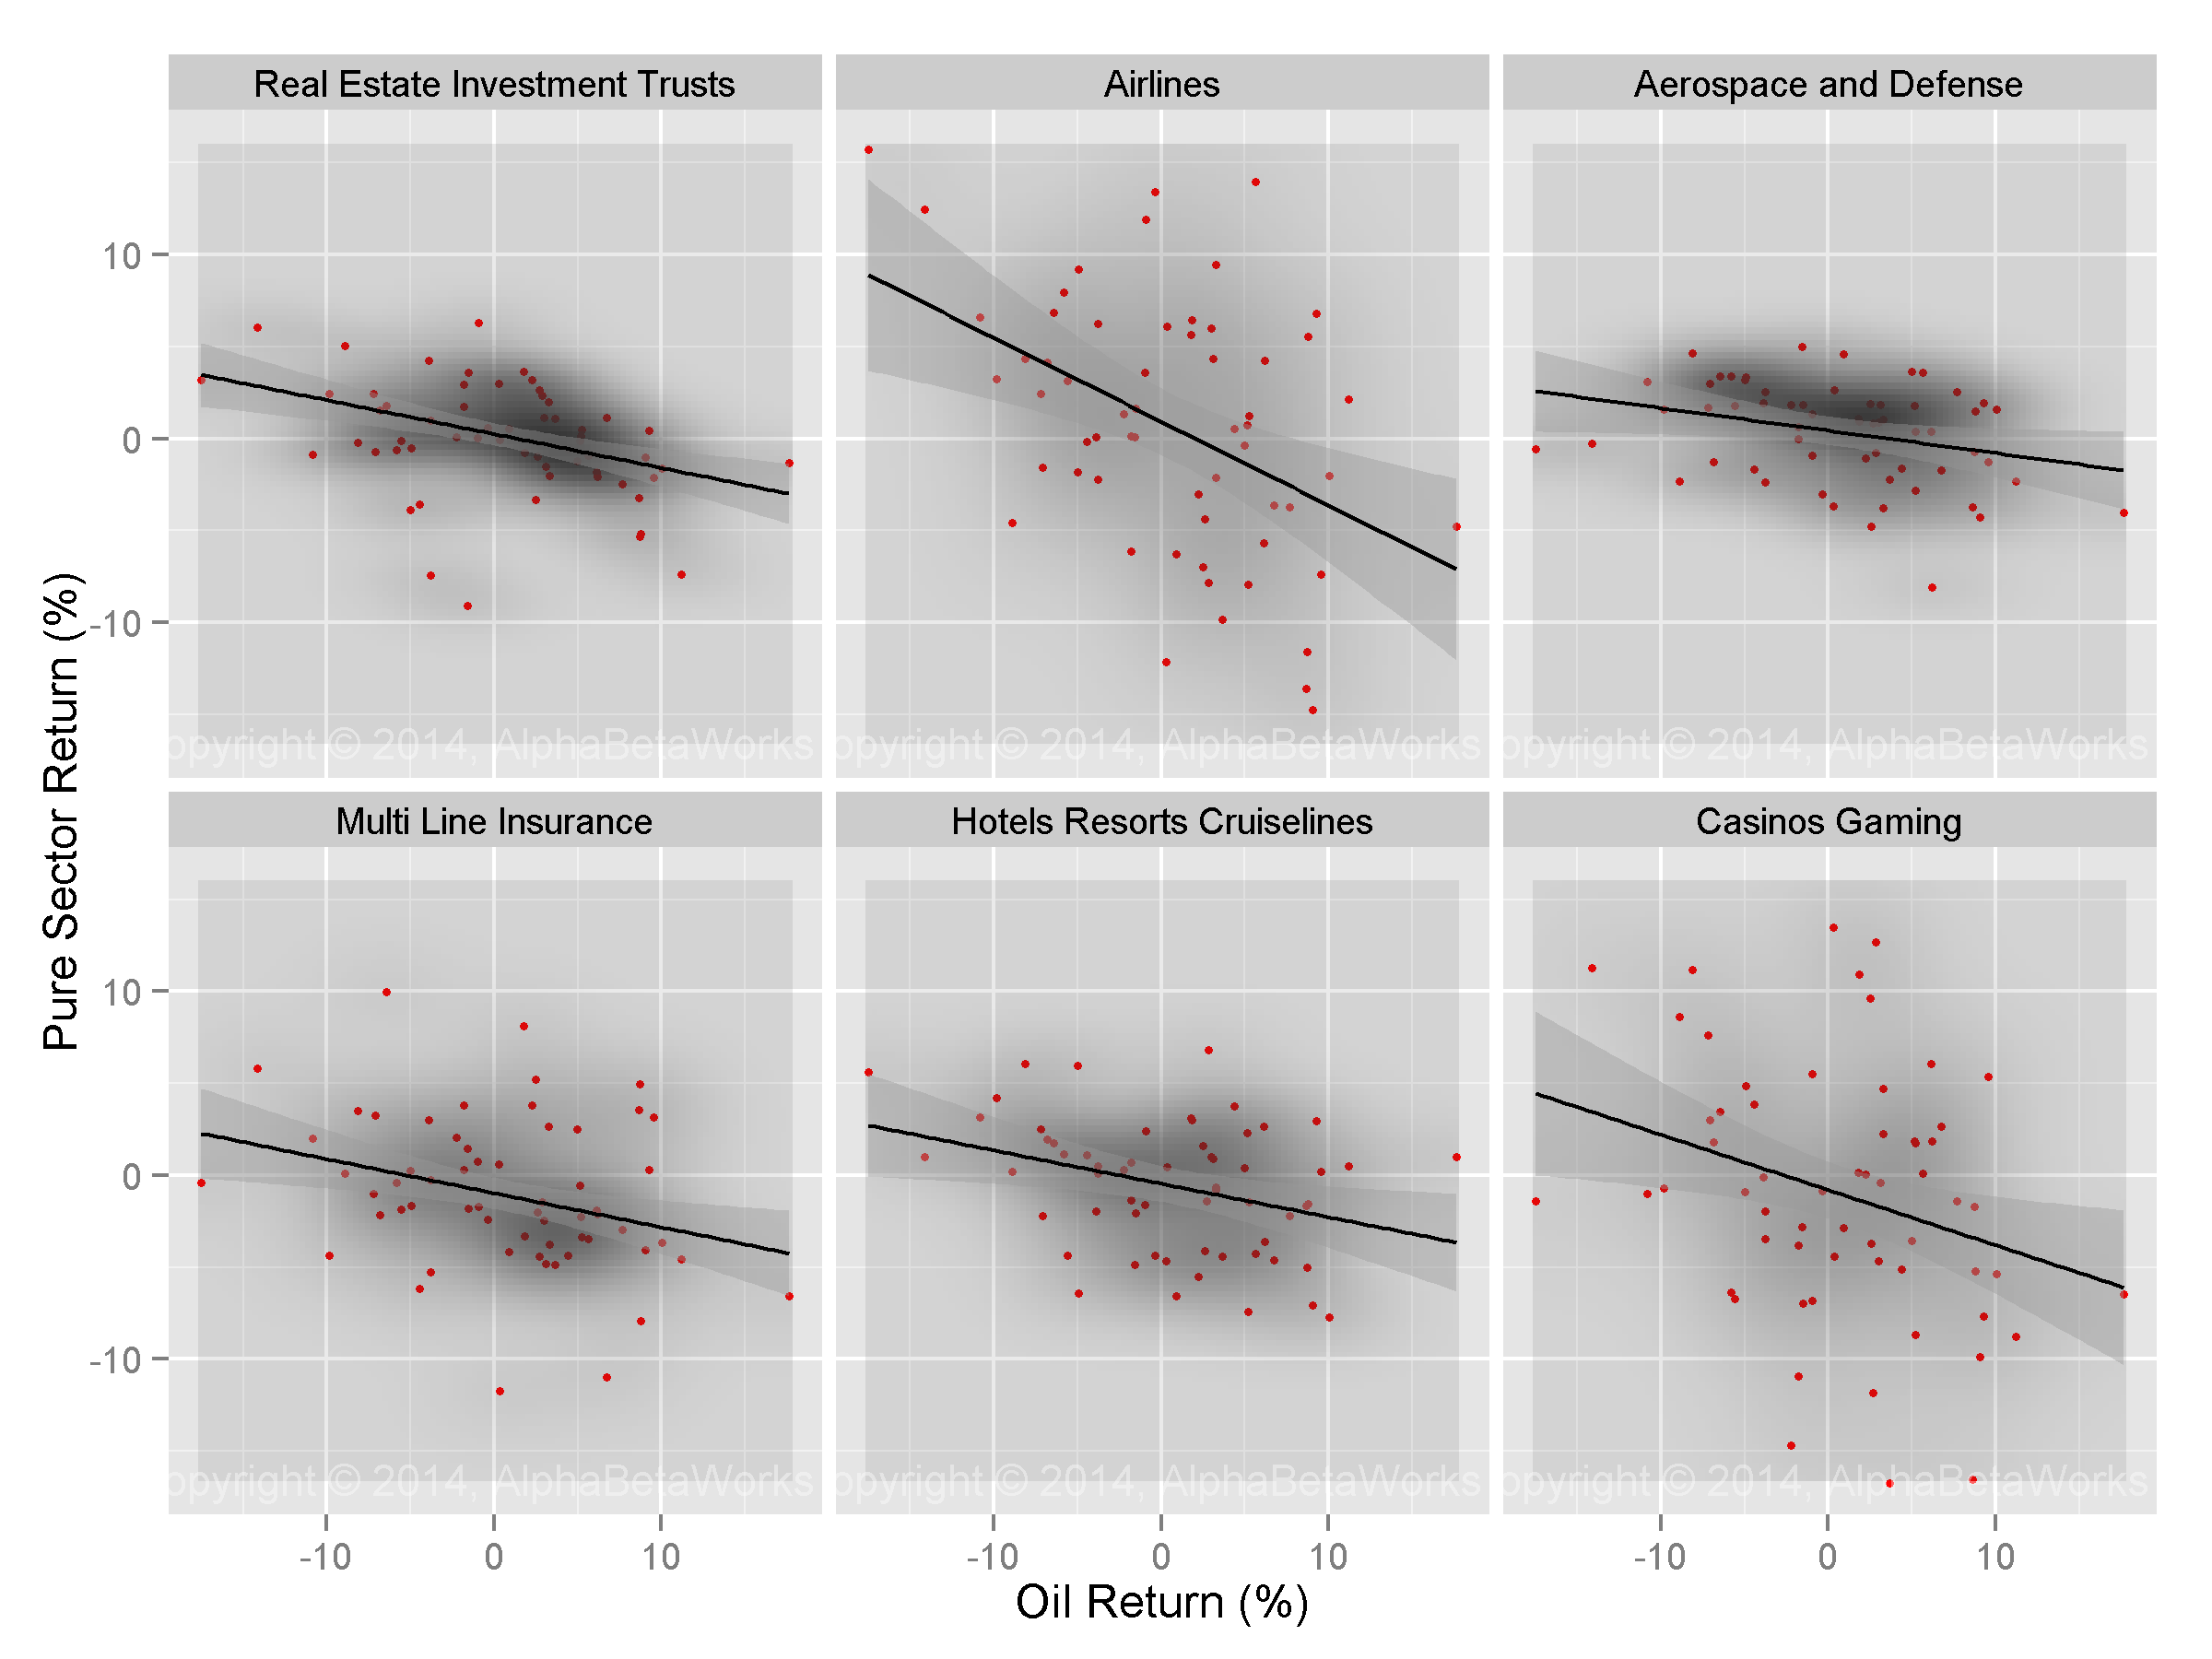
Pure Sector Factors Most Negatively Correlated with Oil Price
Once again, all correlations are statistically significant, generally at 1% level or better:
| Sector | Oil Correlation | p-value |
| Real Estate Investment Trusts | -0.43 | 0.0003 |
| Airlines | -0.36 | 0.0021 |
| Aerospace and Defense | -0.34 | 0.0044 |
| Multi Line Insurance | -0.33 | 0.0053 |
| Hotels Resorts Cruiselines | -0.32 | 0.0067 |
| Casinos Gaming | -0.28 | 0.0142 |
A maxim among investors is that Airlines are the best way to get exposure to falling oil prices. Economic reality is more complex.
In fact, over the past five years, Real Estate Investment Trusts (REITs) have been most consistently negatively related to oil prices:
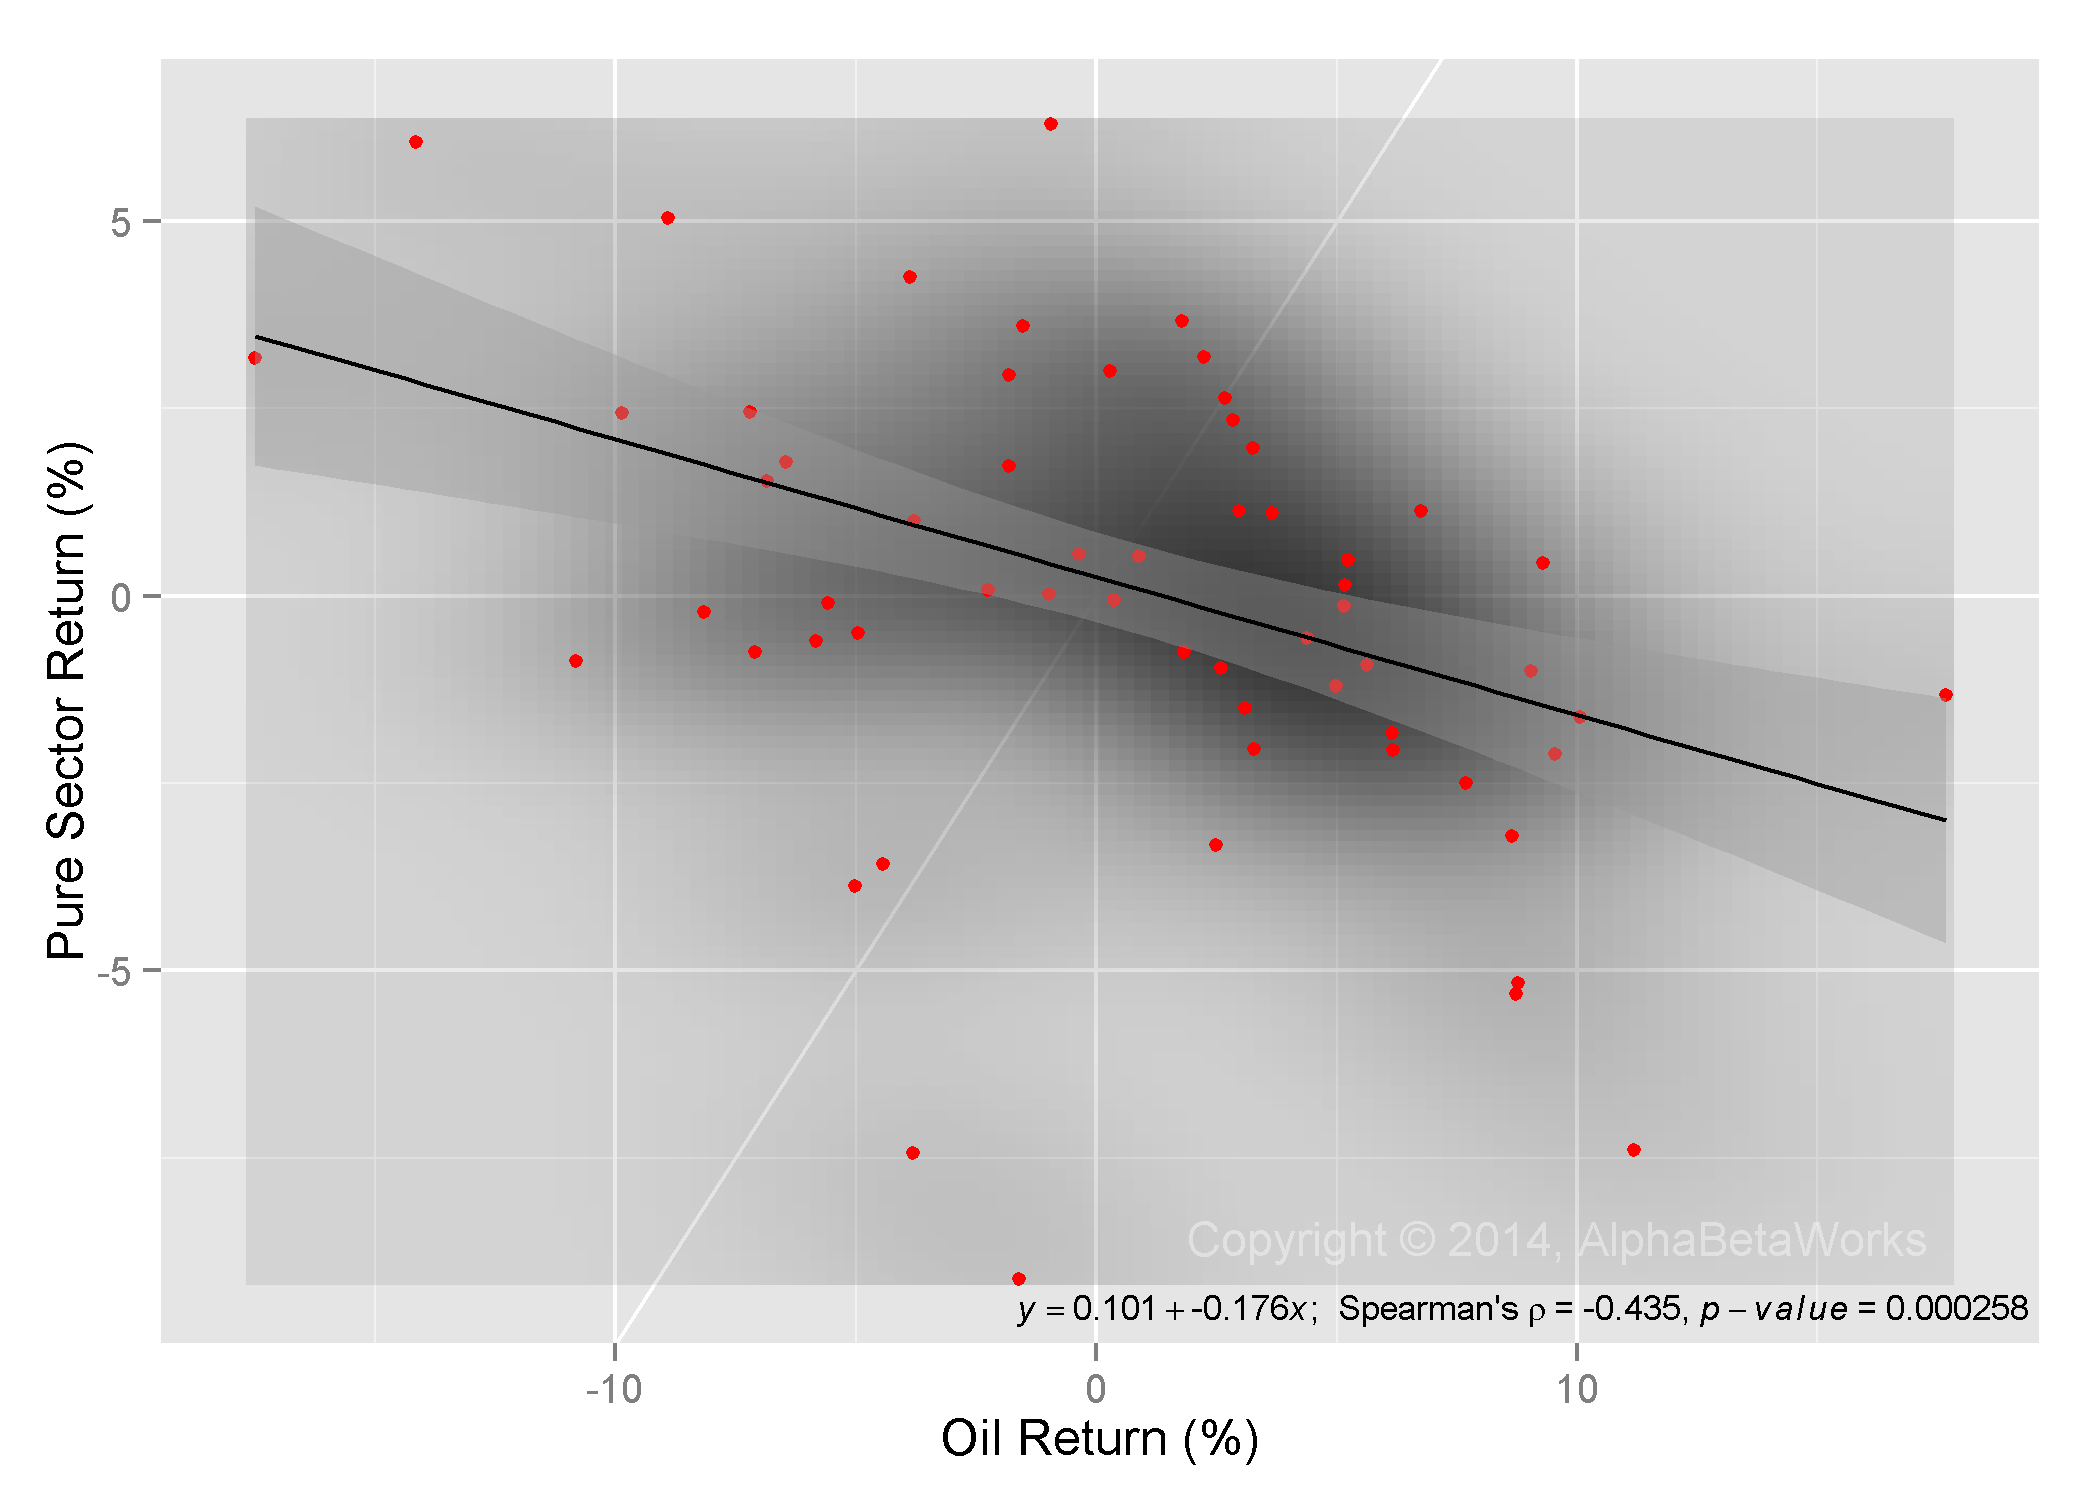
Real Estate Investment Trusts Pure Sector and Oil Return Correlation
Oil price variance explains approximately 19% of increases and decreases in REIT share prices.
Shared variables drive the performance or REITs and the performance of Oil: inflation, growth, and macroeconomic uncertainty.
Sectors Most Negatively Exposed to Oil
Correlation captures the strength of a relationship, or how well changes in one variable explain changes in the other, but it does not capture the magnitude of relative changes.
The magnitude of changes is captured by a regression: exposure (beta or regression term) measures the magnitude of pure sector changes due to oil price changes. Sectors with the largest oil exposure (beta) are:
Pure Sector Factors Most Negatively Exposed to Oil Price
Airlines do indeed benefit the most when oil prices decline:
| Sector | Oil Exposure (Beta) | p-value |
| Airlines | -0.44 | 0.0007 |
| Casinos Gaming | -0.21 | 0.0531 |
| Aluminum | -0.20 | 0.0413 |
| Hotels Resorts Cruiselines | -0.18 | 0.0056 |
| Motor Vehicles | -0.18 | 0.0944 |
| Real Estate Investment Trusts | -0.18 | 0.0005 |
Over the past five years, when oil prices declined by 1%, the sector-specific performance of airlines has been approximately +0.4%:
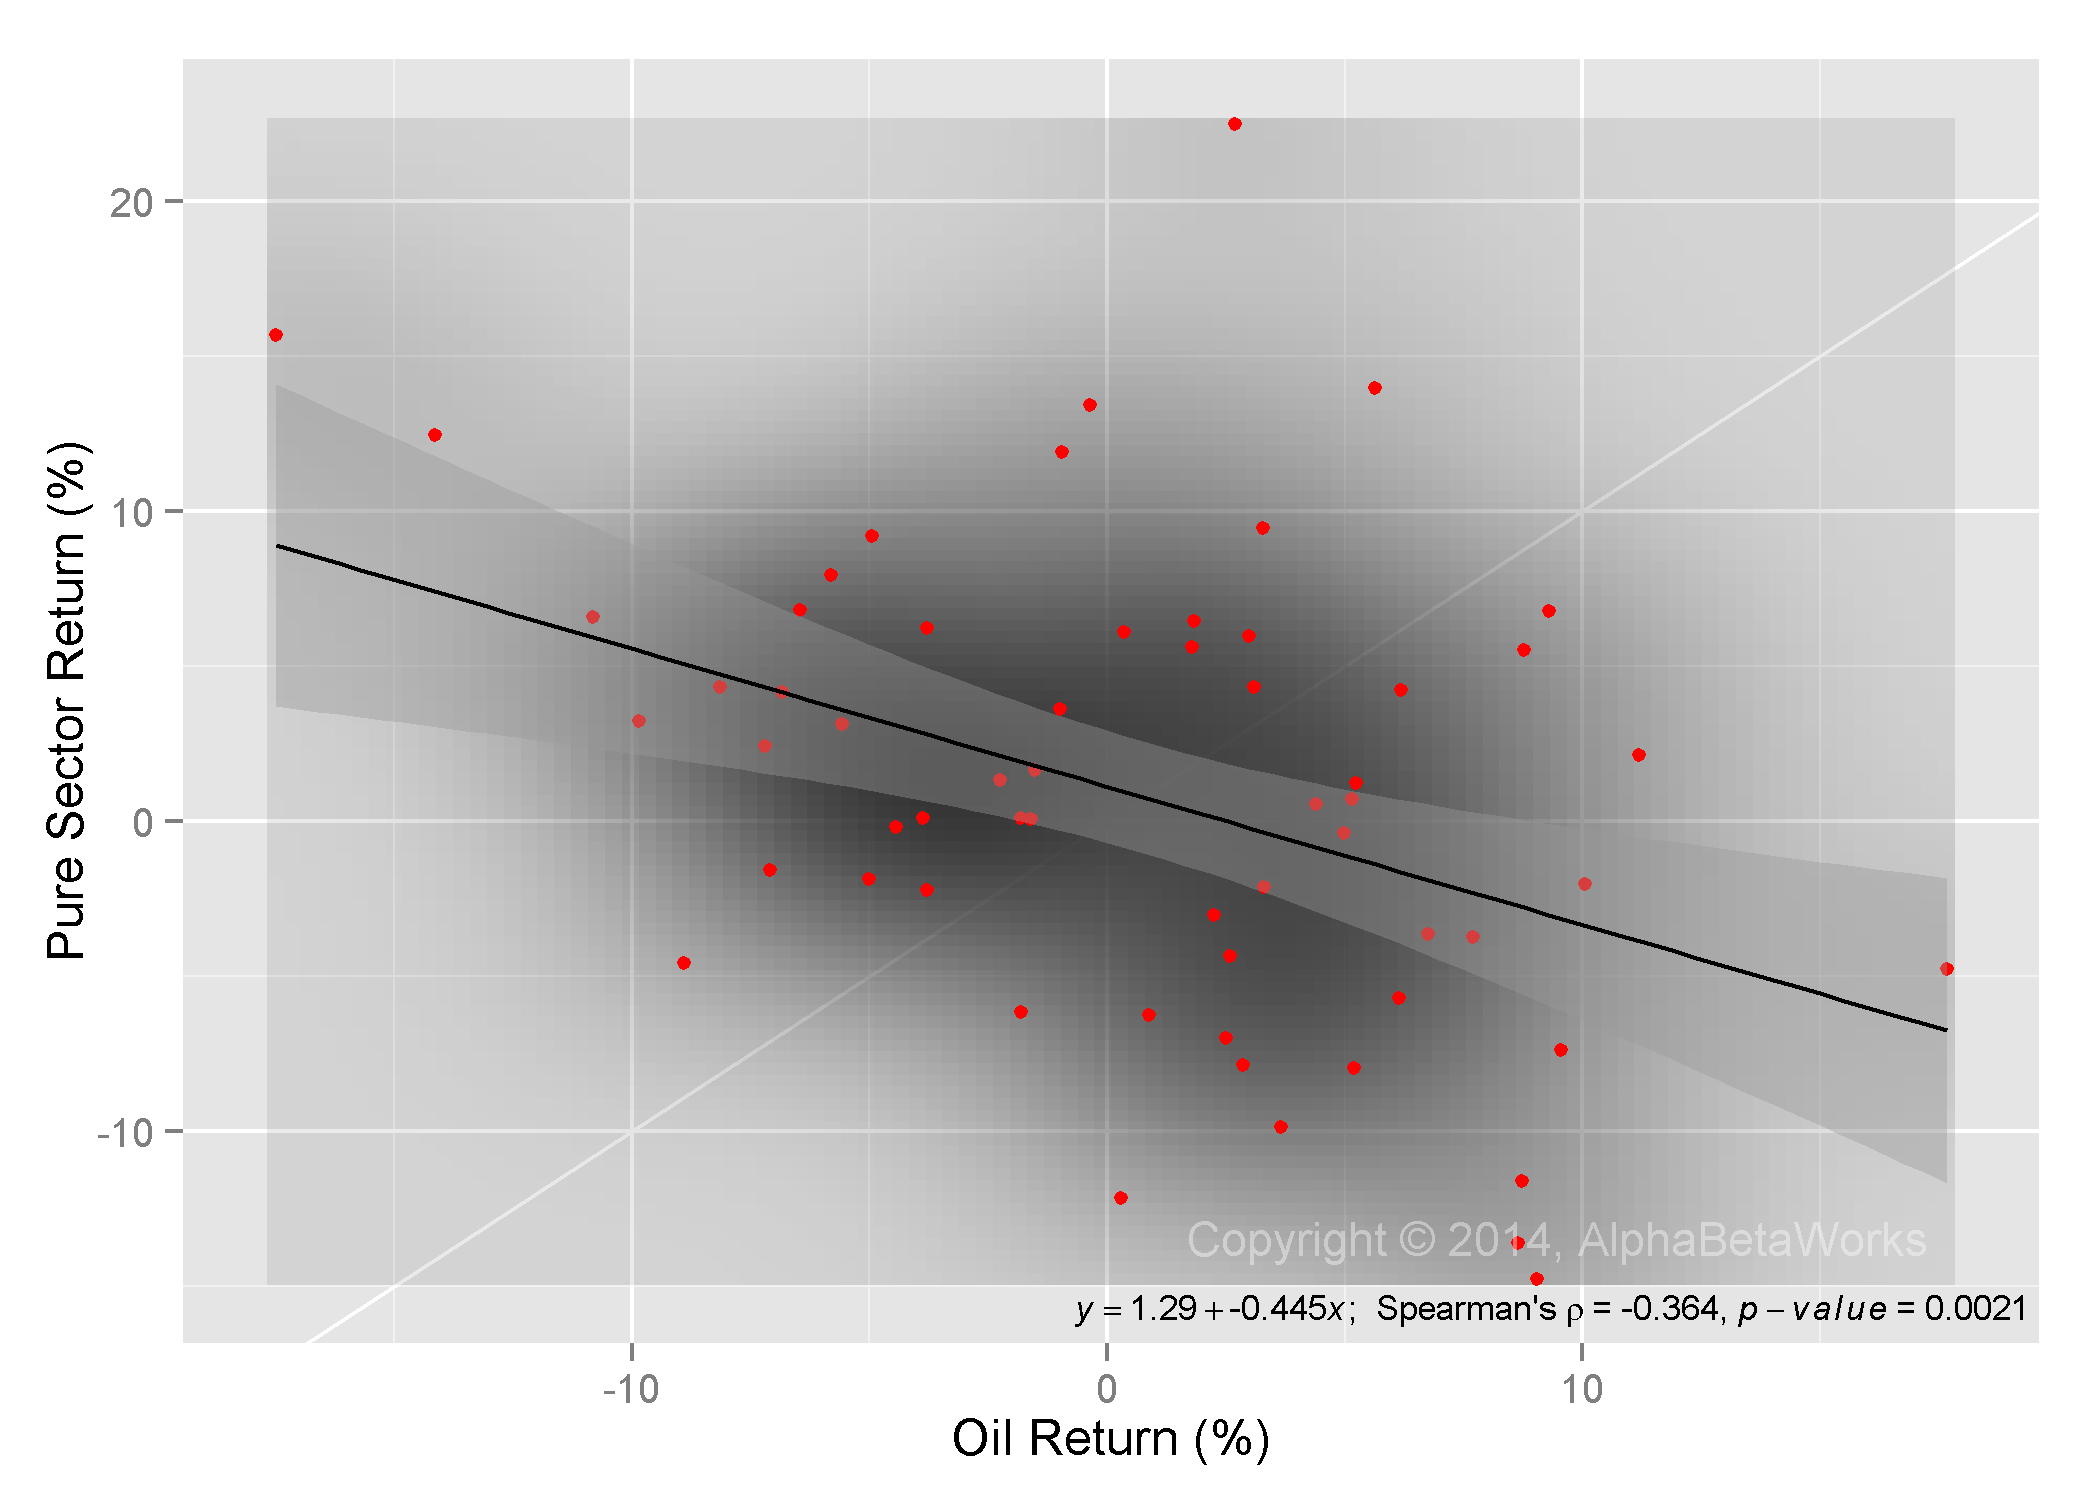
Airlines Pure Sector and Oil Return Correlation
The relationship between Oil and Airlines has not been as consistent as the relationship between Oil and REITs. However, the magnitude of changes in Airlines has been more than twice as large.
- If investors seek short oil exposure with the most consistency, they should go long REITs.
- If investors seek short oil exposure with the most “bang for the buck,” they should go long Airlines.
Hotels, Cruiselines, and Gaming are also featured on both lists. They offer a combination of consistency and “bang for the buck.” Presumably, they benefit from increases in consumer disposable incomes due to declines in energy prices.
Conclusion
- Industry-specific performance is clouded by market noise.
- By stripping away the effects of market and macroeconomic variables, we reveal the performance of pure sector factors and their relationships with oil prices.
- Airlines are not the only, and not always the best, way to benefit from falling oil prices.
- REITs benefit from falling oil prices most consistently.
- Airlines benefit from falling oil prices less consistently than REITs, but with more leverage.


