
Extraordinary Popular Delusions and the Madness of Crowding
U.S. hedge funds share a few systematic and stock-specific long bets. These crowded bets are the main sources of aggregate long hedge fund relative performance as well as many individual funds’ returns. Two risk factors and six stocks are behind most of this herding. The crowded stocks may experience elevated volatility due to the congestion of their hedge fund investor base. The returns of these consensus bets may also disappoint.
Hedge fund crowding consist of:
- High-beta bets,
- Small-cap bets, and
- A handful of individual stocks.
Combined, these account for two thirds of aggregate long hedge fund risk relative to the market.
Identifying Crowding
We created an aggregate position-weighted portfolio (HF Aggregate) consisting of over 200 popular securities held by over 400 U.S. hedge funds with medium to low turnover: If at least ten funds owned a particular security, we included it in HF Aggregate. Within HF Aggregate, the size of each position is the dollar value of its ownership by the funds.
We then evaluated the risk profile of HF Aggregate relative to the U.S. Market (Russell 3000) using AlphaBetaWorks’ Statistical Equity Risk Model and looked for evidence of crowding. Finally, we analyzed risk and calculated the tracking error of each fund relative to HF Aggregate to see which funds most closely resemble it.
Hedge Fund Aggregate Risk
HF Aggregate has approximately 3% estimated future tracking error relative to the market. Risk is evenly split between factor (systematic) and residual (idiosyncratic) bets:
Sources of Relative Risk for U.S. Hedge Fund Aggregate
| Source | Volatility (%) | Share of Variance (%) |
| Factor | 2.48 | 55.51 |
| Residual | 2.22 | 44.49 |
| Total | 3.32 | 100.00 |
With a forecasted relative tracking error near 3%, HF Aggregate will have a very hard time earning a typical fee (1.5% management fee plus incentive). HF Aggregate is nearly passive. Even if one is not concerned with hedge fund closet indexing, investing in a broadly diversified portfolio of long-biased hedge funds is a bad idea.
Hedge Fund Factor (Systematic) Crowding
Below are HF Aggregate’s (red) most significant factor exposures relative to U.S. Market (grey):
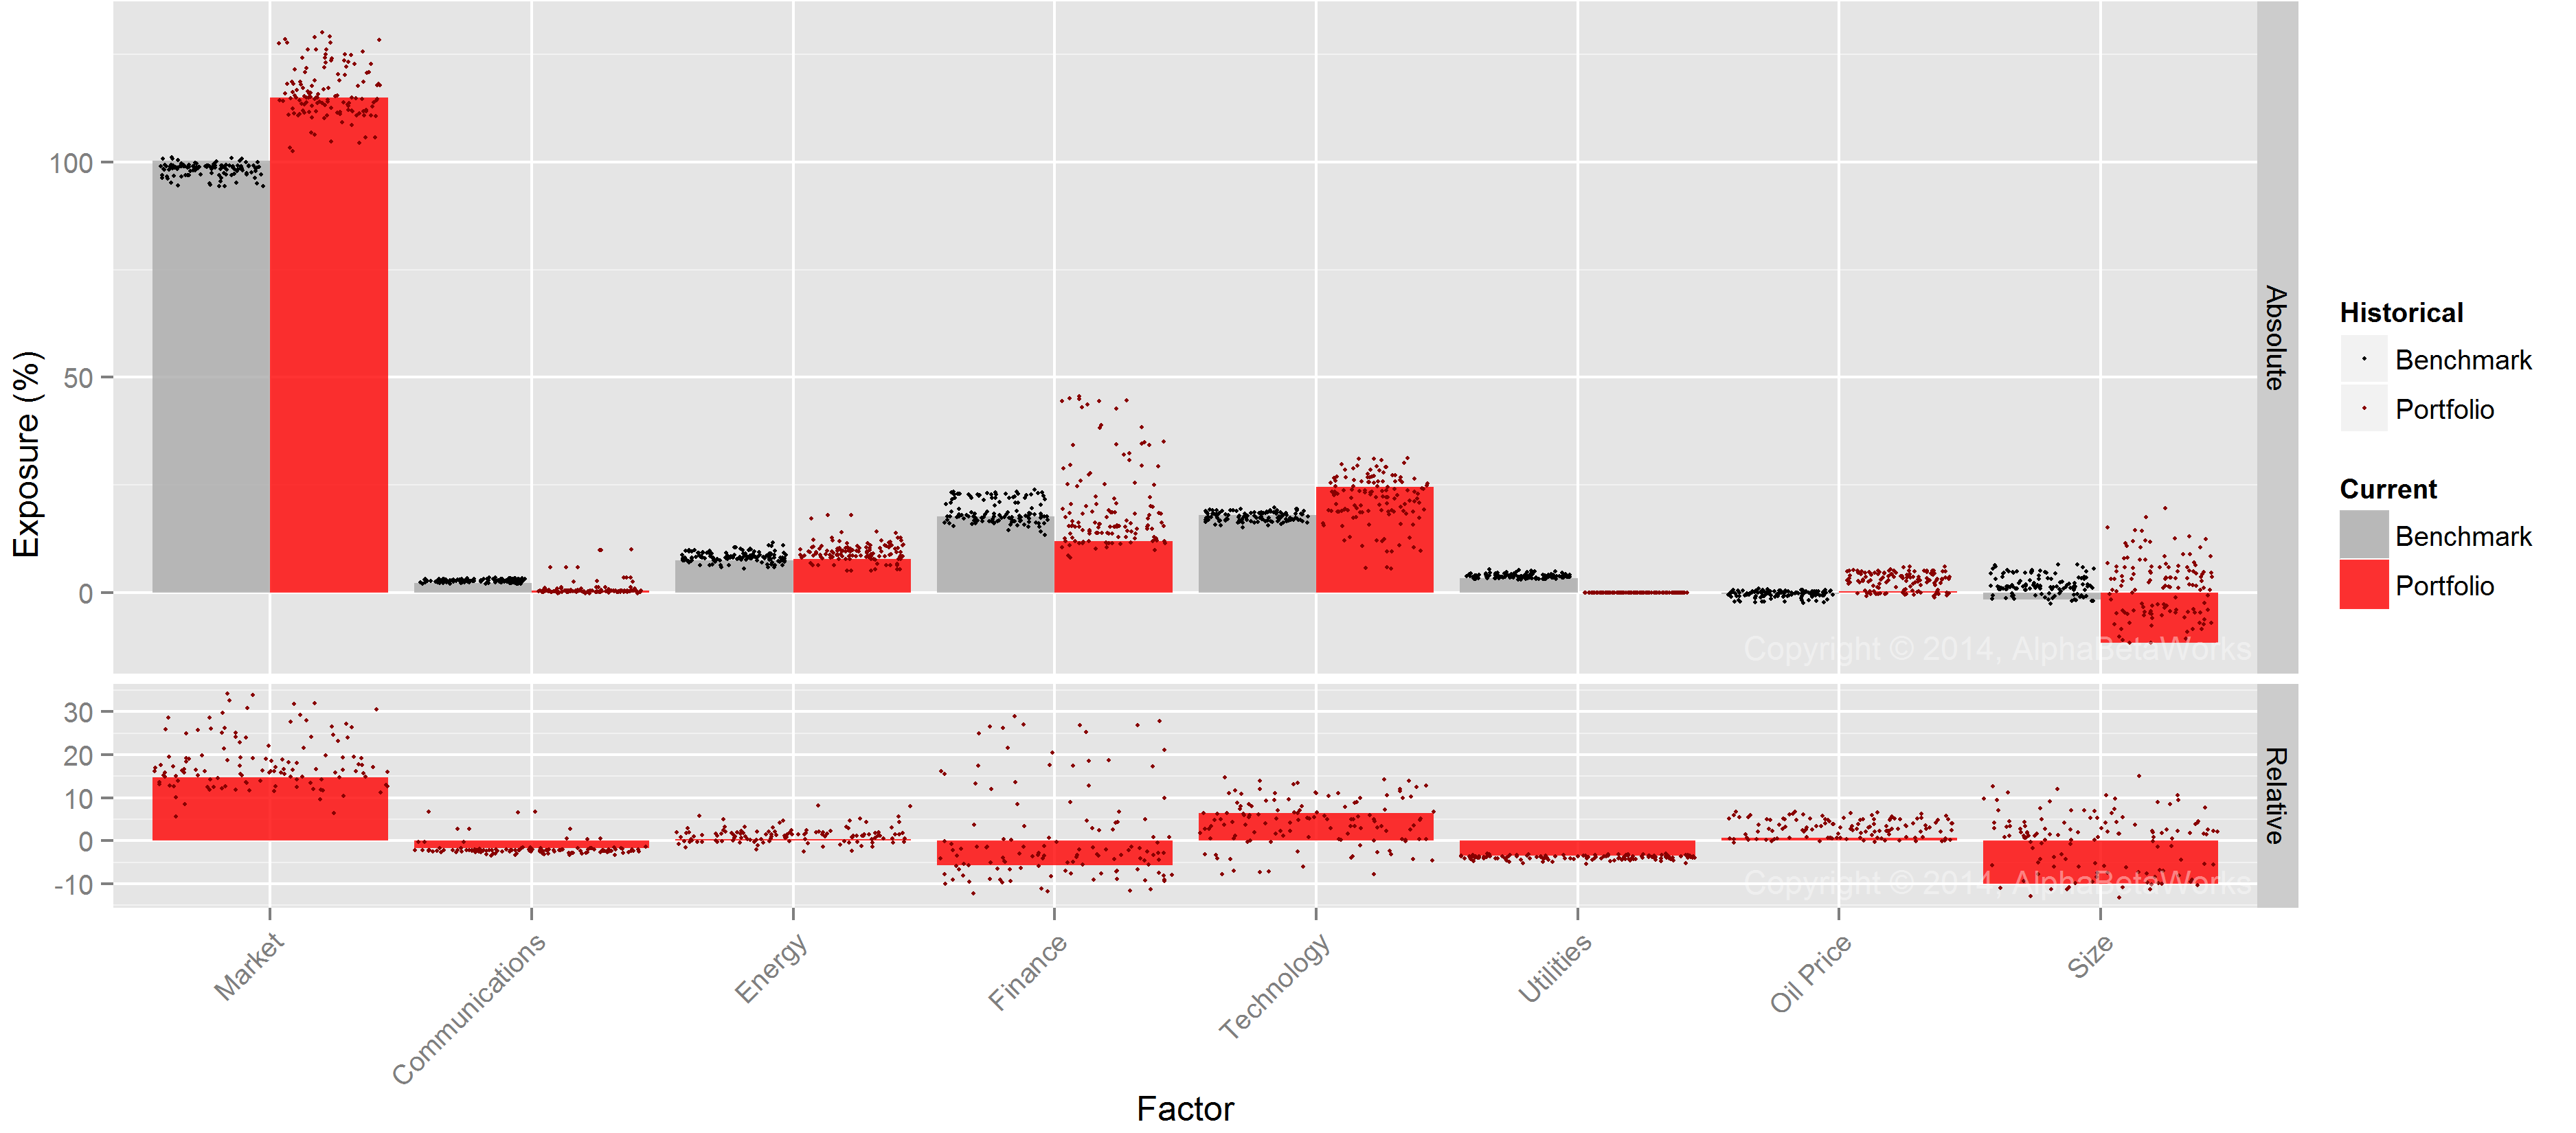
Factors Contributing Most to the Relative Risk for U.S. Hedge Fund Aggregate
Let’s look at the build-up of HF Aggregate’s sources of relative factor variance (market risk). These are the individual components of the red “Factor Variance” in the above chart. Market (high-beta) and Size (small-cap) bets are responsible for over 75% of the relative factor risk (i.e. risk relative to U.S. Market):

Factors Contributing Most to Relative Factor Variance of U.S. Hedge Fund Aggregate
There is systematic crowding among hedge funds. Two factors are the principal bets – high beta (Market) and small-cap stocks (Size). Both factors have done well in recent years, but small-caps have struggled lately.
Hedge Fund Residual (Idiosyncratic) Crowding
Let’s look at a build-up of HF Aggregate’s sources of relative residual variance. These are the individual components of the blue “Residual Variance” in the above chart. This too is a crowded list. Just six stocks are responsible for over half of the relative residual (idiosyncratic) risk:
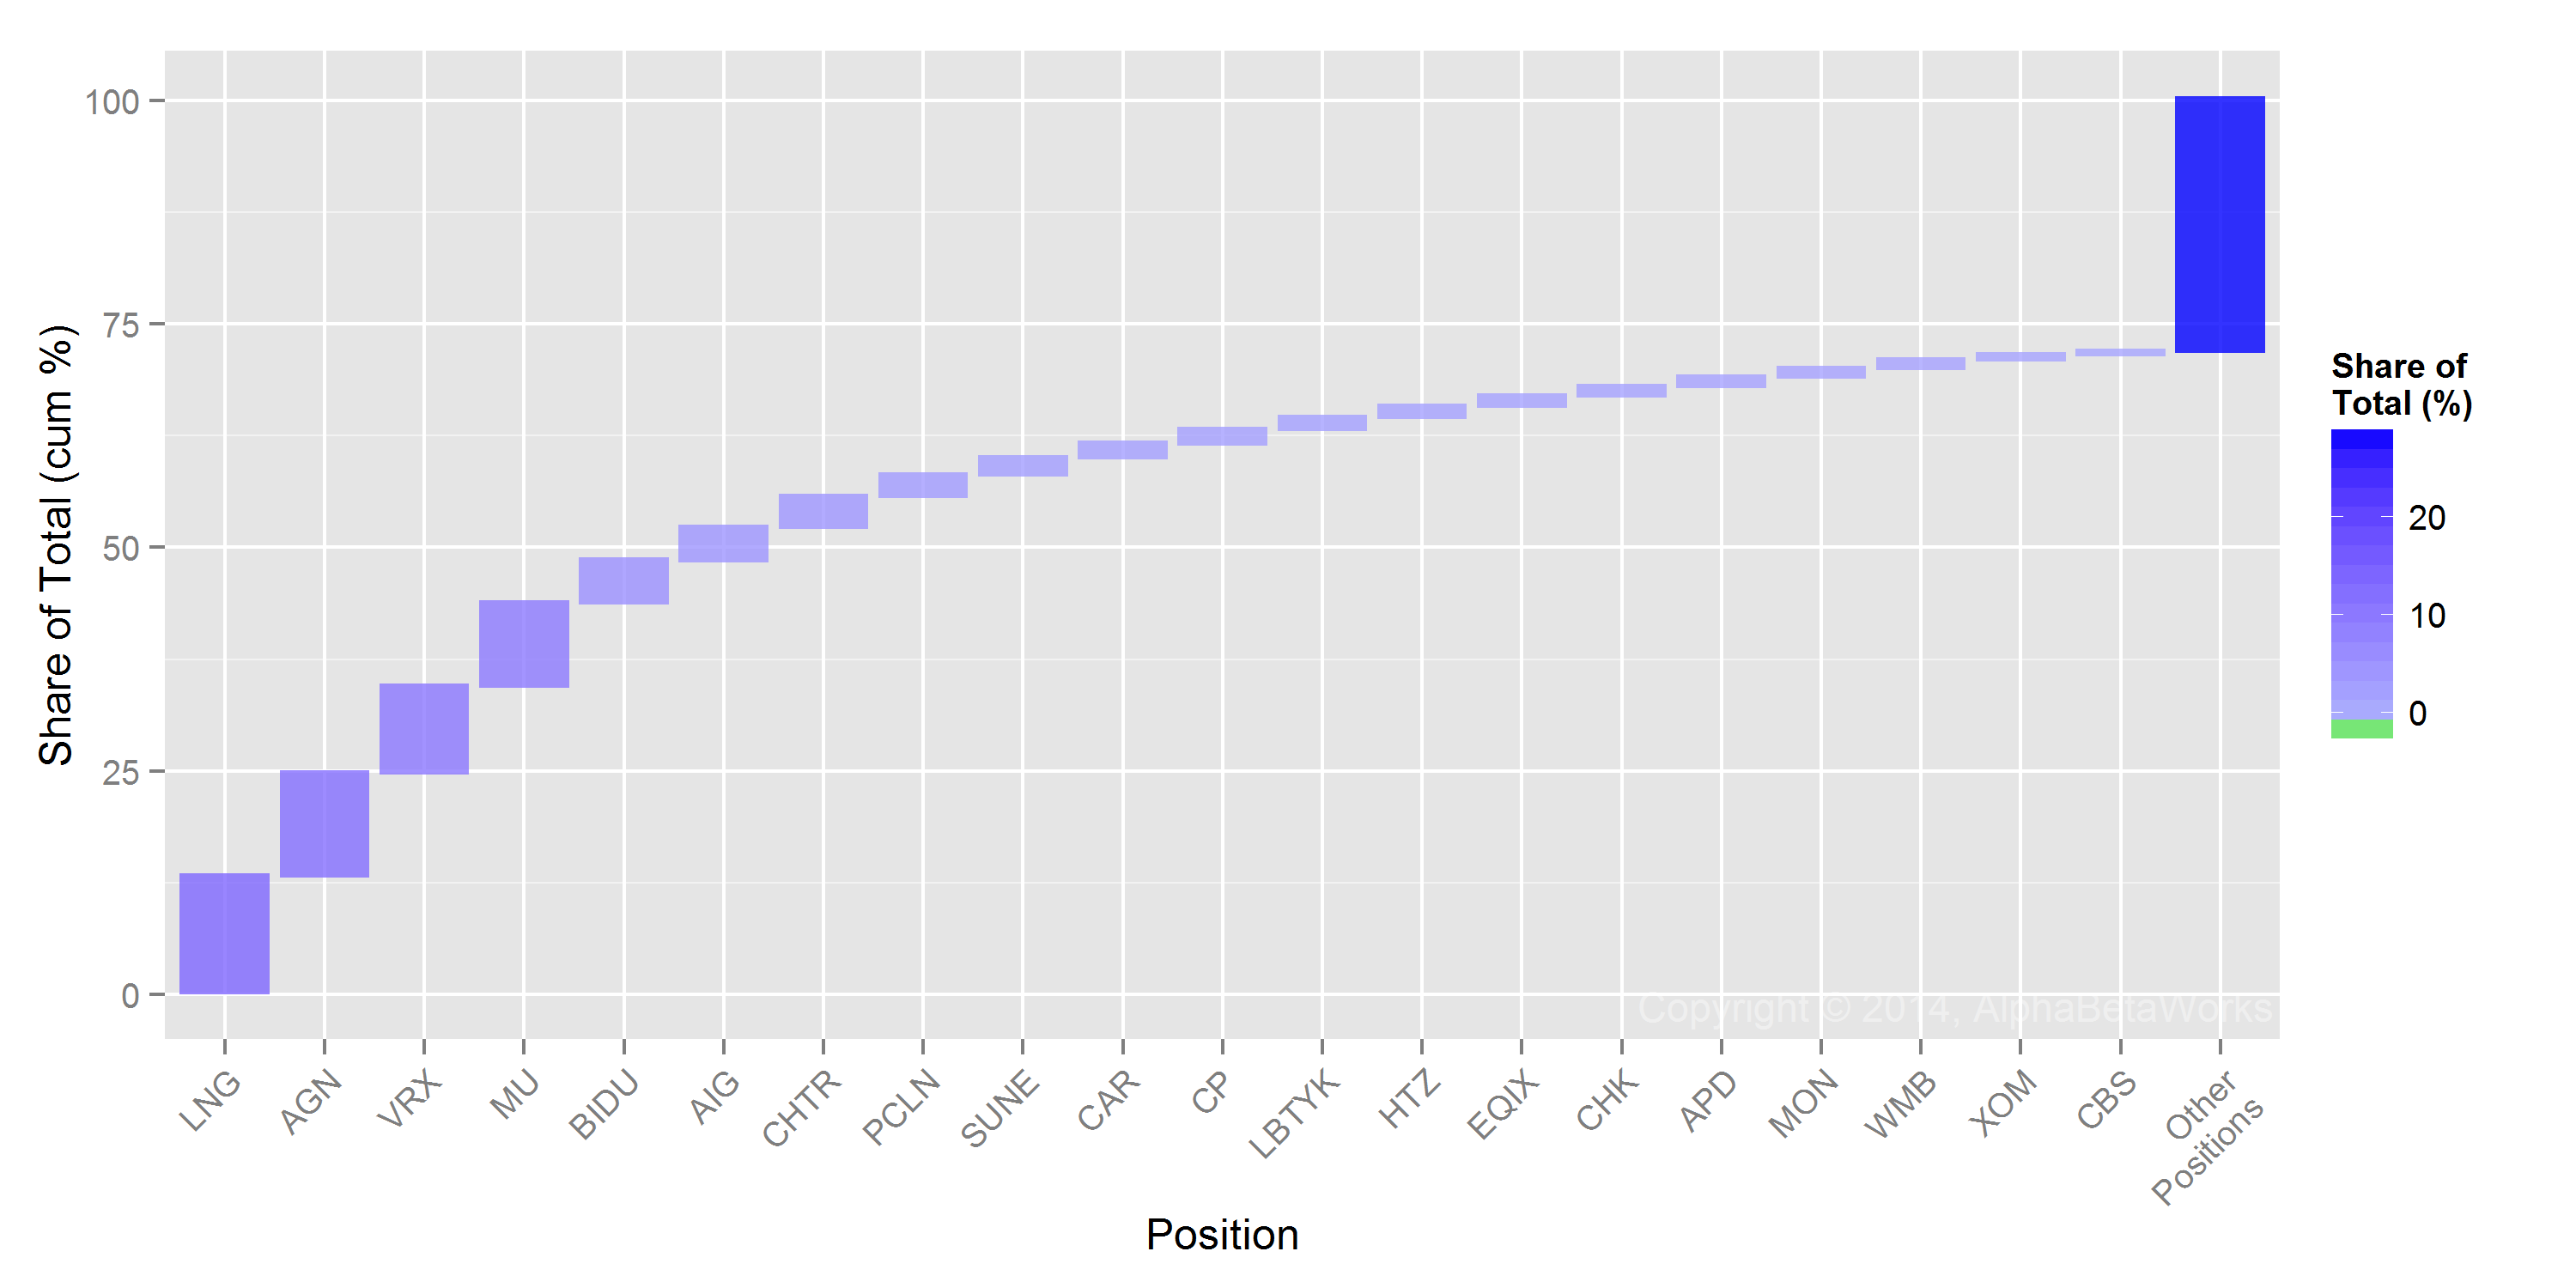
Stocks Contributing Most to Relative Residual Variance of U.S. Hedge Fund Aggregate
These stocks may be wonderful individual investments, but they have a lot of sway on the way HF Aggregate – and individual funds closely correlated with it – will move. They will also be affected by the whims of hedge fund capital allocation. Investors should be ready for seemingly inexplicable volatility in these names – especially the top few:
| Symbol | Name | Share of Total Variance (%) |
| LNG | Cheniere Energy, Inc. | 13.01 |
| AGN | Allergan, Inc. | 11.56 |
| VRX | Valeant Pharmaceuticals International, Inc. | 9.74 |
| MU | Micron Technology, Inc. | 9.31 |
| BIDU | Baidu, Inc. Sponsored ADR Class A | 4.73 |
| AIG | American International Group, Inc. | 3.68 |
| CHTR | Charter Communications, Inc. Class A | 3.48 |
| PCLN | Priceline Group Inc | 2.43 |
| SUNE | SunEdison, Inc. | 1.91 |
| CAR | Avis Budget Group, Inc. | 1.57 |
| CP | Canadian Pacific Railway | 1.55 |
| LBTYK | Liberty Global Plc Class C | 1.40 |
| HTZ | Hertz Global Holdings, Inc. | 1.22 |
| EQIX | Equinix, Inc. | 1.15 |
| CHK | Chesapeake Energy Corporation | 1.11 |
| APD | Air Products and Chemicals, Inc. | 1.02 |
| MON | Monsanto Company | 1.00 |
| WMB | Williams Companies, Inc. | 0.96 |
| XOM | Exxon Mobil Corporation | 0.58 |
| CBS | CBS Corporation Class B | 0.38 |
There is stock-specific crowding among hedge funds – six stocks are the principal bets.
Summary
- There is both factor (systematic/market) and residual (idiosyncratic/security-specific) crowding of long hedge fund portfolios.
- The main sources of factor crowding are: Market (high beta) and Size (small-cap).
- The main sources of residual crowding are: LNG, AGN, VRX, MU, BIDU, and AIG.
- Investors in the crowded stocks should be ready for elevated volatility due to hedge fund capital flows.
- Collectively, hedge funds’ long U.S. equity portfolios tend to generate negative risk-adjusted returns. Consequently, their consensus bets may disappoint.


I see three Pershing Square positions in your list AGN, CP and APD.
In the case of APD it looks like PS own 9.65% of the outstanding shares. Are the aggregate holdings for the other hedge funds in APD actually material? I am asking because PS doesn’t trade in an out of their positions which means performance variance due to Hedge Funds might be more muted than some of the other names on the list.
You are onto something:
APD’s value in the aggregate is $3.8 bil: Pershing Square is $2.6 bil of this and $1.2 bil (~5% of the float) comes from other aggregate members The aggregate only includes funds that, to our heuristics, look like lower turnover stock pickers, so this is lower than the total hedge fund ownership.
Not sure how material this crowding is. The answer might depend on the thesis of those holders: their own work vs. piggy-backing on Pershing Square. APD is certainly less crowded than it appears – good catch.