ESG constraints and overlays can create significant systematic exposures within equity portfolios. Whereas some of these exposures may be intentional long and short industry bets, others are unintentional bets on the overall equity market or other macroeconomic factors. In order to deploy ESG strategies successfully, it is vital to identify, quantify, and manage the effect of ESG constraints on systemic risk. That is the only way to avoid unintended hidden risks and the poor performance that results.
Background and Methodology
Over the past decade, institutional investors have been increasingly incorporating Environmental, Social, and Governance (ESG) metrics into their portfolios. Common approaches include separate ESG mandates and ESG constraints applied across entire portfolios. The investors who have implemented these strategies have too often paid little attention to the changes they cause in their portfolios’ factor exposures. This oversight is regrettable, since such changes in systematic risk can dominate subsequent tracking error.
To illustrate a typical ESG overlay effect, we created a constrained portfolio using the FTSE-Russell ESG ratings for S&P 500 Index constituent. The constrained portfolio excluded approximately 18% of the index’s market capitalization with low ESG ratings (below 2.5). A highly predictive multi-factor equity risk model allowed us to analyze the constrained portfolio’s tracking error relative to the unconstrained index.
Tracking Error Due to ESG Constraints
This ESG overlay resulted in an estimated 1.2% tracking error:
The Effect of ESG Constraints on Systematic Risk: Factor and Residual Shares of Tracking Error
Approximately 80% of the tracking error was due to relative factor exposures – relative systematic bets of the constrained portfolio.
Relative Factor Exposures Due to ESG Constraints
Some relative factor bets – for instance, oil price and Energy sector exposures – are reasonable and expected consequences of the overlay. Others look like risky unintended macro tilts:
The Effect of ESG Constraints on Systematic Risk: Key Factors Contributing to Systematic Risk
At nearly 50%, the Equity Market is by far the largest relative factor bet. Market, FX, and Style factor exposures are frequent unintended side-effects of ESG overlays. Fortunately, this risk to strategy’s long-term viability is easy to mitigate. Cheap passive investment vehicles such as index funds, ETFs, futures, and swaps can offset unintended effects of ESG constraints.
The above simple example is representative of the impact of ESG constraints on systematic risk in the real world. Such rules often create factor bets that are undiscovered until they lead to costly underperformance. The effect can be so dramatic that a completely different benchmark could be necessary for this type of strategy. Yet, this solution may not always be feasible and leaves the sacrificed performance unaddressed. Instead, institutions that deploy ESG criteria would benefit from analyzing the resulting exposures and managing any unintended factor bets. Predictive multi-factor models built with liquid investable factors are powerful tools for this task. Such models can identify the inadvertent market bets and guide their mitigation with cheap passive investments, thus avoiding style drift and costly underperformance.
Conclusions
ESG constraints and portfolio overlays can lead to unintended systematic bets.
Some effects of ESG constraints on systematic risk, such as reducing energy sector exposure, may be intentional.
Other effects of ESG constraints may be unintentional long/short market and macro bets.
A robust and predictive equity risk model built with investable factors can identify such unintended effects of ESG constraints and guide their mitigation with cheap and liquid passive instruments.
Factor analysis is a popular and effective
technique that explains and forecasts security returns. The factor models prevalent
in academic circles (Fama-French, Carhart) tend to
rely heavily on the size and value style
factors. Meanwhile, effective industry models often attribute
risk to sector and industry factors before style. Which approach is more
effective? Though claims that style
explains stock returns are common, they usually lack evidence – there is a
paucity of research that compares the explanatory power of sectors and style.
This paper provides the missing
data and analyzes the explanatory power of sectors and style for U.S. stocks.
We find that, after controlling for the market exposure, sectors are slightly more effective than size
and approximately four times more effective than value in explaining monthly returns.
Measuring the Explanatory Power of Sectors and Style for U.S. Stock Returns
We analyze the monthly returns of U.S. stocks
over the 15-year interval 4/30/2004-4/30-2019. We start with approximately
6,000 stocks that pass minimum market
capitalization and liquidity thresholds – a universe similar to the Russell
3000 Index.
For each month in the historical interval and
each stock in the sample, we estimate the stock’s market beta.
We calculate (out-of-sample) market residuals (alphas) for a given month using the prior month’s market beta
for each stock.
We restrict the analysis to stocks with at least
five years of defined market residuals to
have a significant sample. This final sample comprises approximately 3,600 stocks.
We construct sector, size, and value factors as
follows:
The sector factors are cap-weighted portfolios
of market residuals for the nine sectors
equivalent to the top-level GICS sectors.
The size
factor is long the cap-weighted portfolio
of stocks in the top 25% and short stocks
in the bottom 25%, as ranked by market capitalization.
The value factor
is long the cap-weighted portfolio of
stocks in the top 25% and short stocks in
the bottom 25%, as ranked by Book/Price.
The results below are insensitive to the
specific factor definition and hold across different sector and style portfolios.
For sector, size, and value factors, we regress
stocks’ market residuals on the corresponding factor
returns and measure each regression’s R². This measures the theoretical
(in-sample) explanatory power of sectors and style.
We estimate factor exposures by robust
regression. We fit models with iterated re-weighted least squares (IRLS).
Observations are exponentially weighted
with a half-life of approximately 36-months.
A Comparison of the Explanatory Power of Sectors and Style for U.S. Stock
Returns
The chart below plots the distributions of R² from the regressions of U.S. stocks’ market residuals against the sector, size, and value factors. The x-axis plots the intervals of regression R², and the y-axis plots the number of stocks in each interval. Since the distributions approximately follow a power law, we use a log y-axis:
U.S. Stocks: The Distributions of R² for the Regressions of U.S. Stock Market Residuals (Alphas) on the Sector, Size, and Value Factors
The distributions above illustrate the higher explanatory power of sectors compared to style: Whereas sector factors explain over 25% of the variance in market residuals for hundreds of stocks, style factors do so for only a small handful.
The chart below plots the mean R² values:
U.S. Stocks: Mean R² for the Regressions of U.S. Stock Returns and Market Residuals on the Various Factors
Reasons for Sectors’ Higher Explanatory Power
This higher explanatory power of sectors is unsurprising, given that commentary on style
performance usually relies on sector factors: “Value underperformed because oil
price crashed, and oil producer stocks, which are cheap, suffered.” On the
other hand, even the most ideologically pure believer in the primacy of style
would not make the statement: “Oil price crashed because oil producer stocks
are cheap and value has recently underperformed.” Whereas sector factors can generally explain the reasons for style
factor returns, style factors cannot explain the reasons for sector factor returns.
Since style factors capture systematic risk less effectively,
portfolio construction from style building blocks can lead to significant unintended exposures. Studies
of common smart beta strategies do indeed find such risks and significant market timing. On the other hand,
sector and industry exposures offer superior
control of systematic risk and more effective building blocks for portfolio construction.
In the sections that follow, we share the statistics on the
explanatory power of the various factors.
The Explanatory Power of Market for U.S. Stock Returns
The chart below plots the distribution of R² from the regressions of U.S. stocks’ returns against the Market factor. This step of the analysis allows us to control for market risk and to analyze the explanatory power specific to the other factors:
U.S. Stocks: The Distribution of R² for the Regressions of U.S. Stock Returns on the Market Factor
Min. 1st Qu. Median Mean 3rd Qu. Max. 0.0000 0.1117 0.1770 0.1914 0.2563 0.6525
Market explains approximately 20% of the (in-sample)
variance of stock returns. The tests below analyze the out-of-sample (investable)
market residuals that this step produces.
The Explanatory Power of Sectors for U.S. Stock Returns
The chart below plots the distribution of R² from the
regressions of U.S. stocks’ market residuals against sector factors:
U.S. Stocks: The Distribution of R² for the Regressions of U.S. Stock Market Residuals on Sector Factors
Min. 1st Qu. Median Mean 3rd Qu. Max. 0.0000 0.0070 0.0267 0.0618 0.0767 0.6166
For most stocks, sectors explain 2.7% or more of return
variance, after controlling for market risk. The average effectiveness is statistically
much higher, since sectors explain a large fraction of return variance for some
stocks (e.g., Energy sector for Exxon
Mobil).
The Explanatory Power of Size for U.S. Stock Returns
The following chart plots the distribution of R² from the regressions of U.S. stocks’ market residuals against the Size factor:
U.S. Stocks: The Distribution of R² for the Regressions of U.S. Stock Market Residuals on the Size Factor
Min. 1st Qu. Median Mean 3rd Qu. Max. 0.0000 0.0089 0.0290 0.0415 0.0599 0.3366
These results support the popularity of the size factor in
academic research. For most stocks, the size
factor explains 2.9% or more of return variance, after controlling for market
risk. Nevertheless, the average explanatory power of sectors is approximately 1.5
times greater.
The Explanatory Power of Value for U.S. Stock Returns
The following chart plots the distribution of R² from the regressions of U.S. stocks’ market residuals against the Value factor:
U.S. Stocks: The Distribution of R² for the Regressions of U.S. Stock Market Residuals on the Value Factor
Min. 1st Qu. Median Mean 3rd Qu. Max. 0.0000 0.0020 0.0092 0.0202 0.0251 0.3350
Contrary to its vogue in academic research, the explanatory
power of Value is low, even in these in-sample results. The Value factor
explains less than 1% of return variance, after controlling for market risk.
Even for the 25% of stocks where the value factor has the greatest explanatory
power, it only explains about 2.5% of return variance.
Notes on the Quantitative Methodology
This study controls for market risk before
analyzing the explanatory power of sector and style factors. This two-step approach is necessary to avoid
the multicollinearity problems that
plague academic research into style factors. Since small and large companies
typically have different market betas, and since cheap and expensive companies
also typically have different market
betas, the Fama-French and Carhart factors are collinear. Though this multicollinearity
does not necessarily undermine the overall model, it does render individual
factor betas and associated statistics meaningless.
We measured the in-sample explanatory power of various factors, similarly to typical academic research on the subject. These results are theoretical and do not represent practically attainable investment outcomes – they are the upper bound for out-of-sample explanatory power: This approach calculates factor exposures and residuals using a regression of stock returns on one or more factors. For instance, the regression of AAPL in the 4-factor Carhart model for 2010-2015 produces betas and alphas that are un-investable. To realize this alpha, one would need to know 2014 returns in order to effectively hedge AAPL in 2010. We use a similar approach in this study, and our analysis suffers from the same limitations – the results are in-sample.
Conclusions
Academic analysis favors factors with less
explanatory power than industry’s real-world modeling.
The explanatory power of sectors is slightly
higher than that of size, and approximately four times greater than that of
value/growth.
Portfolio construction and manager allocation with
sector, rather than style building blocks, provide
greater control over systematic risk.
Risk models that seek to capture effectively systematic
risk should account for sector or industry risk before style risk.
Sectors’ higher
explanatory power holds across different industry classifications and style
factor definitions.
Active Share is a popular metric that purports to measure portfolio activity. Though Active Share’s fragility and ease of manipulation are increasingly well-understood, there has been no research on its predictive power. This paper quantifies the predictive power of Active Share and finds that, though Active Share is a statistically significant predictor of the performance difference between portfolio and benchmark (there is a relationship between Active Share and how active a fund is relative to a given benchmark), it is a weak one. The relationship explains only about 5% of the variation in activity across U.S. equity mutual funds. The predictive power of Active Share is a small fraction of that achieved with robust and predictive equity risk models.
Active
Share — the absolute percentage difference between portfolio and
benchmark holdings – is a common metric of fund activity. The flaws of this measure
are evident from some simple examples:
If a fund with S&P 500 benchmark buys SPXL (S&P 500 Bull 3x
ETF), it becomes more passive and more similar to its benchmark, yet its Active Share increases.
If a fund uses the S&P 500 as its benchmark but
indexes Russell 2000, it is passive, yet its Active Share is 100%.
If a fund differs from a benchmark by a single
5% position with 20% residual (idiosyncratic, stock-specific) volatility, and another fund differs from the benchmark by a single 10%
position with 5% residual volatility, the
second fund is less active, yet it has a higher
Active Share.
If a fund holds a secondary listing of a
benchmark holding that tracks the primary
holding exactly, it becomes no more active, yet its Active Share increases.
Given the flows above, the evidence that Active Share funds that outperform may merely index higher-risk benchmarks is unsurprising.
Measuring Active Management
A common defense is that these criticisms are pathological or
esoteric, and unrepresentative of the actual portfolios. Such defense asserts
that Active Share measures active management of
real-world portfolios.
Astonishingly, we have not seen a single paper assess whether Active Share has any effectiveness in doing what it is supposed to do – identify which funds are more and which are less active. This paper provides such an assessment.
We consider two metrics of fund activity: Tracking Error and monthly active returns (measured as Mean Absolute Difference between portfolio and benchmark returns). Both these metrics measure how different the portfolios are in practice. Whether Active Share measures actual fund activity depends on whether it can differentiate among more and less active funds.
The study dataset comprises portfolio histories of approximately 3,000 U.S. equity mutual funds that are analyzable from regulatory filings. The funds all had 2-10 years of history. Our study uses the bootstrapping statistical technique – we select 10,000 samples and perform the following steps for each sample:
Select a random fund F and a random date D.
Calculate Active Share of F to the S&P 500 ETF (SPY) at D.
Keep only those samples with Active Share between 0 and 0.75. This filter ensures that SPY may be an appropriate benchmark, and excludes small- and mid-capitalization funds that share no holdings with SPY. Such funds would all collapse into a single point with Active Share of 100, impairing statistical analysis.
Measure the activity of F for the following 12 months (period D to D + 12 months). We determine how active a fund is relative to a benchmark by quantifying how similar its performance is to that of the benchmark.
After the above steps, we have 10,000 observations of fund
activity as estimated by Active Share versus the funds’ actual activity for the
subsequent 12 months.
The Predictive Power of Active Share for U.S. Equity Mutual Funds
The following results quantify the predictive power of Active Share to differentiate among more and less active U.S. equity mutual funds. For perspective, we also include results on the predictive power of robust equity risk models. These results illustrate the relative weakness of Active Share as a measure of fund activity. They also indicate that, far from mitigating legal risk by reliance upon a claimed “best practice,” the use of Active Share to detect closet indexing may instead create legal risk.
Although Active Share is a statistically significant metric of fund activity, it is a weak one. Active Share predicts only about 5% of the variation in tracking error across mutual funds:
U.S. Equity Mutual Fund Portfolios: The Predictive Power of Active Share to Forecast Future Tracking Error
Residual standard error: 1.702 on 9998 degrees of freedom Multiple R-squared: 0.05163, Adjusted R-squared: 0.05154 F-statistic: 544.3 on 1 and 9998 DF, p-value: < 2.2e-16
The distributions clearly suffer from heteroscedasticity, which can invalidate tests of statistical significance. To control for this, we also consider the relationship between the rankings of Active Share and future tracking errors. This alternative approach does not affect the results:
U.S. Equity Mutual Fund Portfolios: The Predictive Power of Active Share to Forecast Future Tracking Error Rank
Residual standard error: 2811 on 9998 degrees of freedom Multiple R-squared: 0.05226, Adjusted R-squared: 0.05217 F-statistic: 551.3 on 1 and 9998 DF, p-value: < 2.2e-16
Active Share also predicts approximately 5% of the variation in monthly absolute active returns across mutual funds:
U.S. Equity Mutual Fund Portfolios: The Predictive Power of Active Share to Forecast Future Active Return
Residual standard error: 0.3986 on 9998 degrees of freedom Multiple R-squared: 0.04999, Adjusted R-squared: 0.04989 F-statistic: 526.1 on 1 and 9998 DF, p-value: < 2.2e-16
The above results make a generous assumption that all
relative returns are due to active management. In fact, much relative
performance is attributable to passive differences between a portfolio and a
benchmark. We will illustrate this complexity in our follow-up research.
The Predictive Power of Robust Equity Risk Models
To put the predictive power of Active Share into perspective, we compare it to the predictive power of tracking error as estimated by robust and predictive equity risk models. Instead of Active Share, we use AlphaBetaWorks’ default Statistical U.S. Equity Risk Model to forecast tracking error of a fund F at date D.
The Predictive Power of Equity Risk Models to Forecast Future Tracking
Error
The equity risk model predicts approximately 38% of the
variation in tracking error across mutual funds:
U.S. Equity Mutual Fund Portfolios: The Predictive Power of Robust Equity Risk Models to Forecast Future Tracking Error
Residual standard error: 1.379 on 9998 degrees of freedom Multiple R-squared: 0.3776, Adjusted R-squared: 0.3776 F-statistic: 6067 on 1 and 9998 DF, p-value: < 2.2e-16
As with Active Share above, heteroscedasticity does not affect the results. We see a similar relationship when we consider ranks instead of values:
U.S. Equity Mutual Fund Portfolios: The Predictive Power of Robust Equity Risk Models to Forecast Future Tracking Error Rank
Residual standard error: 2278 on 9998 degrees of freedom Multiple R-squared: 0.3773, Adjusted R-squared: 0.3772 F-statistic: 6058 on 1 and 9998 DF, p-value: < 2.2e-16
The Predictive Power of Equity Risk Models to Forecast Future Active
Returns
The equity risk model predicts approximately 44% of the variation in monthly absolute active returns across mutual funds:
U.S. Equity Mutual Fund Portfolios: The Predictive Power of Robust Equity Risk Models to Forecast Future Active Return
Residual standard error: 0.3068 on 9998 degrees of freedom Multiple R-squared: 0.4375, Adjusted R-squared: 0.4374 F-statistic: 7776 on 1 and 9998 DF, p-value: < 2.2e-16
Conclusions
Active Share is a statistically significant metric of active management (there is a relationship between Active Share and how active a fund is relative to a given benchmark), but the predictive power of Active Share is very weak.
Active Share predicts approximately 5% of the variation in tracking error and active returns across U.S. equity mutual funds.
A robust and predictive equity risk model is roughly
7-9-times more effective than Active Share, predicting approximately 40% of the variation in tracking error and active
returns across U.S. equity mutual funds.
In the following articles, we will put the above
predictive statistics into context and quantify how likely Active Share is to
identify closet indexers.
Rapid asset flows into smart beta strategies have led to concerns about froth and a vigorous debate among systematic portfolio vendors. At the same time, few discussions of smart beta crowding are burdened by data on the aggregate risk of smart beta strategies. This article attempts to remedy this data vacuum. We survey the risk factors and the stocks responsible for U.S. smart beta crowding. In doing so, we identify the exposures that would benefit the most from further asset flows into smart beta portfolios and those that would suffer the most from any outflows:
The most crowded factor (systematic) exposures are short Size (overweight smaller companies) and short (underweight) Technology Factors.
The most crowded residual(idiosyncratic, or stock-specific) exposures are short (underweight) FAANG stocks.
Exposures to dumb factors account for over 80% of smart beta crowding.
Our findings refute many common beliefs about smart beta crowding.It follows that the vigorous performance of Technology shares and FAANG stocks specifically has been in spite of, rather than due to, the asset flows into smart beta strategies. Instead, the principal beneficiaries of such inflows and the most crowded smart beta bet have been smaller companies. Smart beta strategies tend to overweight smaller companies relative to the passive (capitalization-weighted) Market Portfolio. Consequently, smaller companies are most at risk should the flows into smart beta reverse. Given its importance, allocators and portfolio managers should pay particular attention to this Size Factor crowding.
Identifying Smart Beta Crowding
This article applied AlphaBetaWorks’ pioneering analysis of Hedge Fund Crowding to U.S. smart beta equity ETFs. We aggregated the Q2 2017 positions of over 300 U.S. smart beta equity ETFs with approximately $700 billion in total assets. We combined all portfolios into a single position-weighted portfolio – U.S. Smart Beta Aggregate (USSB Aggregate). We then used the AlphaBetaWorks (ABW) Statistical Equity Risk Model – an effective predictor of future risk – to analyze USSB Aggregate’s risk relative to the iShares Russell 3000 ETF (IWV) benchmark. The benchmark is a close proxy for the passive U.S. Equity Market portfolio.
We find that a small number of active bets are behind the aggregate risk and performance of U.S. smart beta ETFs. Our analysis assumes that the U.S. smart beta ETF universe is a good proxy for the total smart beta strategy universe. In this case, the analysis captures overall U.S. smart beta crowding.
Factor and Residual Components of U.S. Smart Beta Crowding
USSB Aggregate has approximately 1% estimated future volatility (tracking error) relative to the Market. Over 80% of this relative risk is due to factor exposures, or factor crowding. This high share of factor crowding is consistent with our earlier findings that the bulk of absolute and relative risk of most smart beta ETFs is due to traditional, or dumb, factors such as Market and Sectors:
Components of U.S. Smart Beta Crowding in Q2 2017
Source
Volatility (ann. %)
Share of Variance (%)
Factor
0.84
82.45
Residual
0.39
17.55
Total
0.92
100.00
Given how close the aggregate smart beta ETF portfolio is to the Market, closet indexing is a concern, especially for diversified smart beta portfolios. The little active risk that remains is primarily due to the two dumb factor exposures discussed below.
U.S. Smart Beta Factor (Systematic) Crowding
The following chart shows the main factor exposures of USSB Aggregate in red relative to U.S. Market’s exposures in gray:
Significant Absolute and Relative Factor Exposures of U.S. Smart Beta Aggregate in Q2 2017
The main active bet of the smart beta universe is short exposure to the Size Factor (overweighting of smaller companies). Thus, smart beta crowding is largely a bet against market-cap weighting and in favor of smaller companies. This crowded bet is the natural consequence of most modified-weighting schemes that de-emphasize larger companies.
Factors Contributing Most to Relative Factor Variance of U.S. Smart Beta Aggregate in Q2 2017
Factor
Relative Exposure
Factor Volatility
Share of Relative Factor Variance
Share of Relative Total Variance
Size
-5.58
9.62
42.83
35.31
Technology
-6.85
6.39
40.74
33.59
Utilities
1.88
12.72
7.44
6.14
Energy
0.84
13.06
4.73
3.90
Real Estate
0.99
12.40
3.79
3.13
Industrials
1.22
4.72
2.67
2.20
FX
2.49
6.77
2.46
2.03
Materials
0.80
7.88
1.39
1.15
Financials
-1.28
7.90
-1.70
-1.40
Value
-1.08
15.20
-4.04
-3.33
(Relative exposures and relative variance contribution. All values are in %. Volatility is annualized.)
The short Size Factor smart beta crowding accounts for approximately twice the risk of stock-specific crowding. Consequently, smaller companies stand to lose, and larger companies stand to benefit, on average, from smart beta strategy outflows. The short (underweight) Technology bet is nearly as important.
U.S. Smart Beta Residual (Idiosyncratic) Crowding
The remaining fifth of U.S. smart beta crowding as of 6/30/2017 was due to residual (idiosyncratic,stock-specific) risk:
Stocks Contributing Most to Relative Residual Variance of U.S. Smart Beta Aggregate in Q2 2017
Symbol
Name
Relative Exposure
Residual Volatility
Share of Relative Residual Variance
Share of Relative Total Variance
AAPL
Apple Inc.
-1.43
13.37
24.43
4.29
FB
Facebook, Inc. A
-0.67
24.17
17.39
3.05
AMZN
Amazon.com, Inc.
-0.74
18.23
12.17
2.13
GOOGL
Alphabet Inc. A
-0.52
12.83
3.04
0.53
MSFT
Microsoft Corporation
-0.56
11.78
2.96
0.52
GOOG
Alphabet Inc. C
-0.54
10.72
2.25
0.39
BRK.B
Berkshire Hathaway B
-0.69
7.55
1.82
0.32
BAC
Bank of America Corporation
-0.46
11.08
1.77
0.31
CASH
Meta Financial Group
0.22
22.74
1.68
0.29
NFLX
Netflix, Inc.
-0.11
40.32
1.23
0.21
(Relative exposures and relative variance contribution. All values are in %. Volatility is annualized.)
The main source of residual U.S. smart beta crowding is short (underweight) exposure to AAPL, FB, AMZN, and GOOGL – the principal members of the FAANG club. The Strong performance of these stocks has been despite, rather than due to, flows into smart beta strategies. On a relative basis, FAANGs have suffered from smart beta asset inflows and, all else equal should outperform in the case of outflows from smart beta strategies.
Summary
Factor (systematic) exposures that capture risks shared by many stocks, rather than individual stocks, are responsible for over 80% of U.S. smart beta crowding.
The most crowded smart beta bet is short Size Factor exposure (overweighting of smaller companies). Thus, smaller companies stand to lose from smart beta strategy outflows.
The most crowded residual smart beta bet is short exposure to (underweighting of) FAANG stocks. Therefore, FAANG stocks should be relative beneficiaries of any smart beta outflows.
Whereas hedge fund crowding primarily consists of systematic factor bets, most analysis of hedge fund crowding focuses solely on popular positions. Moreover, such analysis usually assumes that hedge fund crowding in individual stocks is a bullish indicator. This article illustrates the flaws of these common assumptions, identifies the principal sources of hedge fund crowding, and discusses the opportunities that this crowding presents:
Factor (systematic) exposures, rather than individual stocks, account for 70% of the crowding.
Residual (idiosyncratic, or stock-specific) bets account for just 30% of hedge fund crowding.
Simplistic analysis of crowding in individual stocks overlooks the majority of crowding risk.
Crowded hedge fund factor bets have been experiencing steep losses since 2015 and have been attractive shorts.
Crowded hedge fund stock-specific bets have been attractive longs following the 2014-2015 liquidations and the subsequent recovery, but the trend appears to have ended.
Identifying Hedge Fund Crowding
The analysis of hedge fund crowding in this article follows the approach of our earlier studies: We started with a decade of hedge fund Form 13F filings. Form 13F discloses positions of firms with long U.S. assets over $100 million. We only considered funds with a sufficiently low turnover to be analyzable from filings, and our database is free of survivorship bias. This sample included approximately 1,000 firms. We combined all portfolios into a single position-weighted portfolio – HF Aggregate. We then used the AlphaBetaWorks (ABW) Statistical Equity Risk Model – an effective predictor of future risk – to analyze HF Aggregate’s risk relative to the U.S. Market (represented by the iShares Russell 3000 ETF (IWV) benchmark), identify the crowded exposures, and analyze their performance trends.
Factor and Residual Components of Hedge Fund Crowding
Virtually all of HF Aggregate’s absolute risk is systematic. Thus, the aggregate long U.S. equity holdings of hedge funds will very nearly track a passive factor portfolio with similar risk:
Components of U.S. Hedge Fund Aggregate’s Absolute Risk in Q2 2017
Source
Volatility (ann. %)
Share of Variance (%)
Factor
11.80
97.78
Residual
1.78
2.22
Total
11.93
100.00
HF Aggregate has 2.8% estimated future volatility (tracking error) relative to the Market. Approximately 70% of this relative risk is due to factor crowding:
Components of U.S. Hedge Fund Aggregate’s Relative Risk in Q2 2017
Source
Volatility (ann. %)
Share of Variance (%)
Factor
2.37
69.90
Residual
1.55
30.10
Total
2.83
100.00
Consequently, simplistic analysis of hedge fund crowding that focuses on the popular holdings and position overlap is fatally flawed. It will capture less than a third of the crowding risk that is stock-specific and will overlook the bulk that is systematic.
Stock Picking and Market Timing Returns from Crowding
Crowded factor and residual bets go through cycles of outperformance and underperformance, depending on capital flows. These trends can provide attractive investment opportunities: short during liquidation, and long during expansion.
The following chart shows HF Aggregate’s cumulative βReturn (risk-adjusted returns from factor timing). Crowded hedge fund factor bets have experienced steep and accelerating losses since 2015. We identified these factors in earlier research as attractive short candidates, and the downtrend has persisted:
Historical Risk-Adjusted Return from Factor Timing of U.S. Hedge Fund Aggregate
The following chart shows HF Aggregate’s cumulative αReturn (risk-adjusted returns from security selection). Following the unprecedented losses on crowded residual bets during 2011-2015, we advised long exposures to these beaten-down stocks in late-2015. The subsequent recovery has been spectacular but now appears over. Thus, the crowded hedge fund residual bets no longer seem to offer clear long or short opportunities:
Historical Risk-Adjusted Return from Security Selection of U.S. Hedge Fund Aggregate
The rest of this article considers the crowded factor and residual bets responsible for the above trends.
Hedge Fund Factor (Systematic) Crowding
The following chart shows the main sources of hedge fund factor crowding as of 6/30/2017 in red relative to U.S. Market’s exposures in gray:
Significant Absolute and Relative Factor Exposures of U.S. Hedge Fund Aggregate in Q2 2017
The dominant hedge fund long equity bet is Market (high Beta). Thus, the most crowded bet is high overall market risk, rather than a specific stock. Like a leveraged ETF, HF Aggregate outperforms when the Market is up and underperforms when it is down.
Factors Contributing Most to Relative Factor Variance of U.S. Hedge Fund Aggregate in Q2 2017
Factor
Relative Exposure
Factor Volatility
Share of Relative Factor Variance
Share of Relative Total Variance
Market
14.05
9.80
47.63
33.29
Health Care
8.72
7.75
13.41
9.37
FX
-8.49
6.77
11.35
7.93
Real Estate
-2.54
12.40
6.11
4.27
Oil Price
1.11
29.50
5.30
3.71
Utilities
-3.17
12.72
4.89
3.42
Bond Index
-8.12
3.41
3.86
2.70
Financials
-5.29
7.90
2.23
1.56
Industrials
-4.15
4.72
2.17
1.51
Consumer Discretionary
8.11
4.31
1.51
1.06
(Relative exposures and relative variance contribution. All values are in %. Volatility is annualized.)
In fact, crowding in the simple Market Factor alone accounts for more risk than all the stock-specific crowding combined.
Despite recent losses, HF Aggregate’s Health Care Factor exposure remains near the recent record levels.
Hedge Fund Residual (Idiosyncratic) Crowding
The remaining 30% of hedge fund crowding as of 6/30/2017 was due to residual (idiosyncratic,stock-specific) risk:
Stocks Contributing Most to Relative Residual Variance of U.S. Hedge Fund Aggregate in Q2 2017
Symbol
Name
Relative Exposure
Residual Volatility
Share of Relative Residual Variance
Share of Relative Total Variance
BABA
Alibaba Group Holding ADR
2.23
23.93
11.82
3.56
LNG
Cheniere Energy, Inc.
1.44
27.51
6.54
1.97
HLF
Herbalife Ltd.
0.92
36.18
4.59
1.38
CHTR
Charter Communications, Inc.
1.66
19.10
4.15
1.25
AVGO
Broadcom Limited
1.32
21.20
3.24
0.98
AAPL
Apple Inc.
-1.96
13.37
2.84
0.86
ALXN
Alexion Pharmaceuticals, Inc.
0.85
29.14
2.52
0.76
FB
Facebook, Inc. Class A
1.01
24.17
2.47
0.74
EXPE
Expedia, Inc.
1.08
21.31
2.21
0.66
FWONK
Liberty Media Corporation Formula One
0.91
24.90
2.11
0.64
(Relative exposures and relative variance contribution. All values are in %. Volatility is annualized.)
Following the 2011-2015 losses and the subsequent gains, these crowded bets do not offer clear long or short opportunities. Moreover, residual crowding accounts for a small fraction of the industry’s risk. While systematic hedge fund crowding continues to dominate, investors and allocators should focus on managing the crowded factor exposures. Without a firm grasp of factor crowding, investors and fund followers may blindly follow losing bets.
Summary
Factor (systematic) exposures that capture risks shared by many stocks, rather than individual stocks, are responsible for the majority of hedge fund crowding.
The main sources of Q2 2017 hedge fund crowding were long U.S. Market (high Beta), long Health Care, and short USD (preference for exporters over importers).
The crowded factor bets have been in a multi-year bearish trend.
The crowded residual bets have recovered from steep losses and no longer offer clear opportunities.
Without a robust analysis of the factor and residual components of crowding, a hedge fund investor, follower, or allocator may be missing the bulk of crowding risk and investing in a generic passive factor portfolio.
The proliferation of smart beta strategies has raised questions about the relationship between the core risk factors that have formed the foundation of quantitative investment analysis for decades and the growing factor zoo of strategies. Whereas some state that “smart beta is the vehicle to deliver factor investing” others argue that “factor tilts are not smart ‘smart beta’”. A central question is how well dumb beta factors such as Market, Sectors/Industries, and Style (Value/Growth, Big/Small) can replicate the zoo’s residents. The answers drive risk modeling, performance evaluation, and portfolio construction. This article studies replicating fundamental indexing with factor tilts over the past ten years and illustrates how well it has worked. We will discuss the other popular smart beta strategies in subsequent articles.In this 10-year replication example, the reality falls between the extreme viewpoints above:
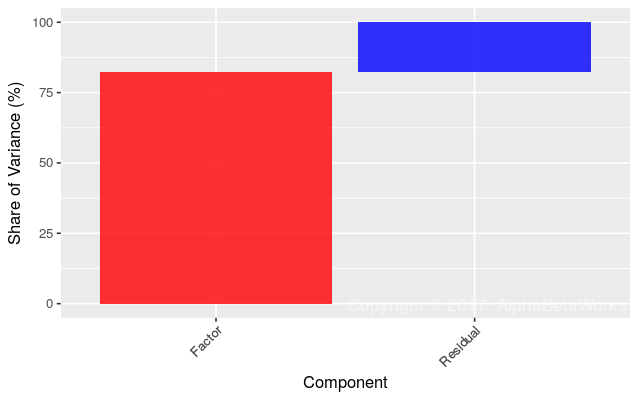
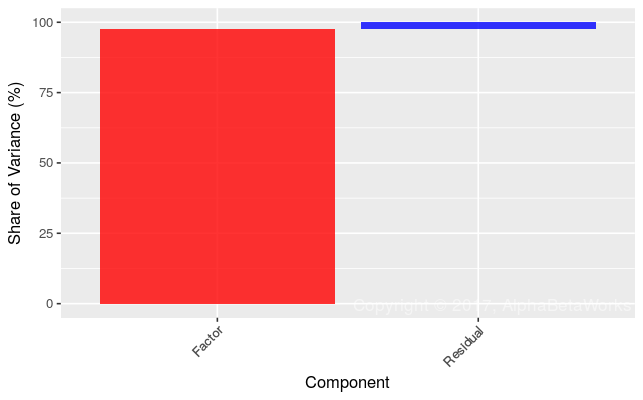
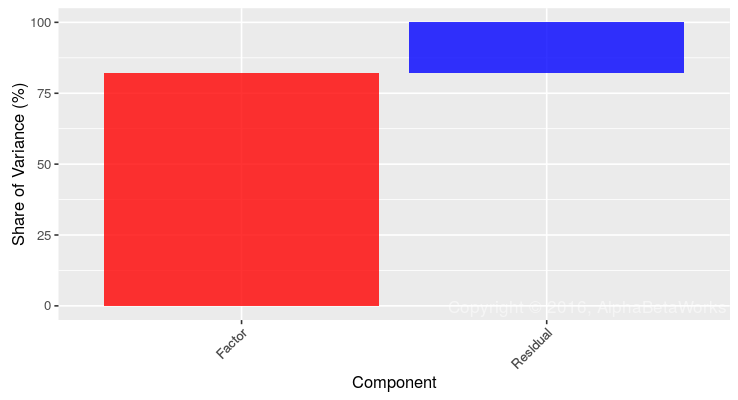
Factor tilts replicate virtually all (>96%) of the absolute variance.
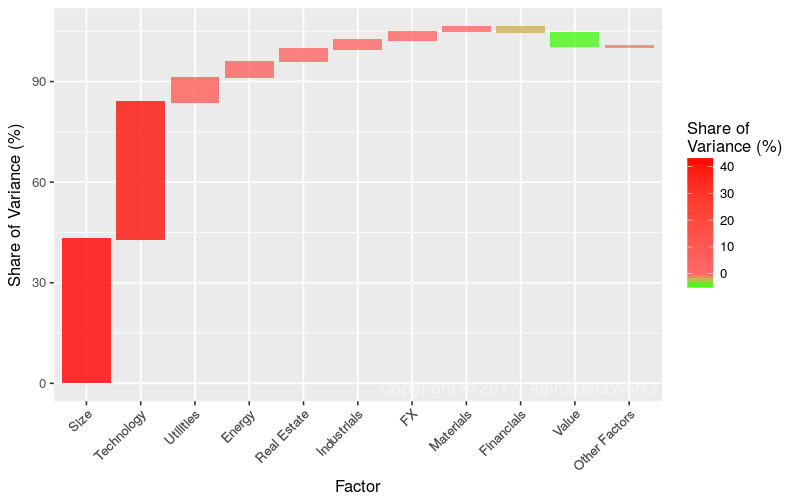
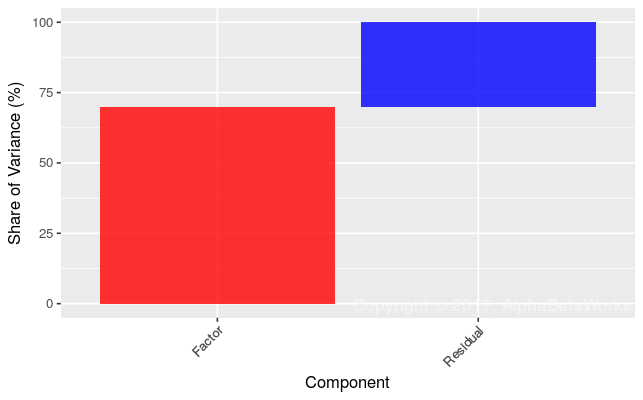
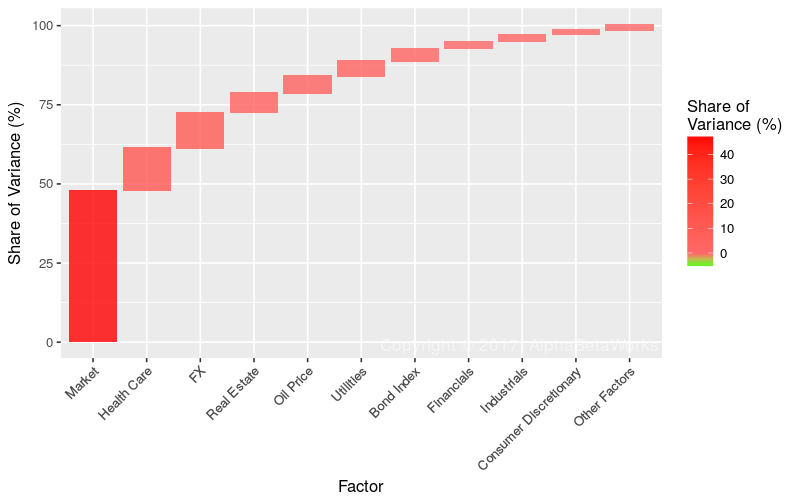
In a typical market environment, factor tilts replicate most (60-75%) of the relative variance. In fact, in this environment, fundamental indexing is substantially replicated with sector rotation. Indeed, most U.S. and international smart beta strategies are largely instances of sector rotation.
In periods of stress, factor tilts fail to replicate the relative variance.
The difference in returns between the target and replicating portfolios is statistically insignificant.
The relative return of the target and replicating portfolios does not follow a random walk – fundamental indexing goes through periods of outperformance and underperformance relative to the replicating portfolio.
We illustrate and quantify the systematic performance that is attainable, and the residual performance that is unattainable, when replicating fundamental indexing with a portfolio of atomic and liquid factor tilts. The replication uses only the rudimentary factors that most commercial equity risk models implement: Market, Sectors, and optionally Style. We also show the environments when replication is more or less successful. It is up to the user to determine whether a given tracking error is adequate for a given application.
Prior Research on Replication
When assumptions and idiosyncrasies of a factor replication exercise are not made explicit, confusion can arise. Any test replicating smart beta with dumb factor tilts is a joint test of the following components:
The equity risk model and the optimizer used to create replicating factor tilt portfolios,
The securities used to implement replicating portfolios,
The portfolio constraints.
Failure of replication based on a flawed model or flawed factors (such as the simple three Fama-French factors suffering from multicollinearity) merely shows the replication process to be flawed; it does not prove the replication impossible.
Replicating Smart Beta Strategies with Dumb Factor Tilts
This article considers fundamental indexing as implemented by the PowerShares FTSE RAFI US 1000 Portfolio (PRF).
We constructed quarterly replicating portfolios using PRF’s position filings. We lagged positions by two months and risk model data by one month to account for filing and processing delays. For example, pre-1/31/2017 PRF positions and 2/28/2017 AlphaBetaWorks U.S. Equity Risk Model were used to construct the 3/31/2017 portfolio, which was next rebalanced on 6/30/2017. The optimizer aimed to minimize estimated future tracking error of the replicating portfolio to PRF, subject to portfolio constraints. Results were unaffected by changes in rebalance delay of a few months.
We attempted to use the simplest replication methodology that is practical and sound. Results vary depending on the security universe, the equity risk model, the optimizer, and the portfolio parameters.
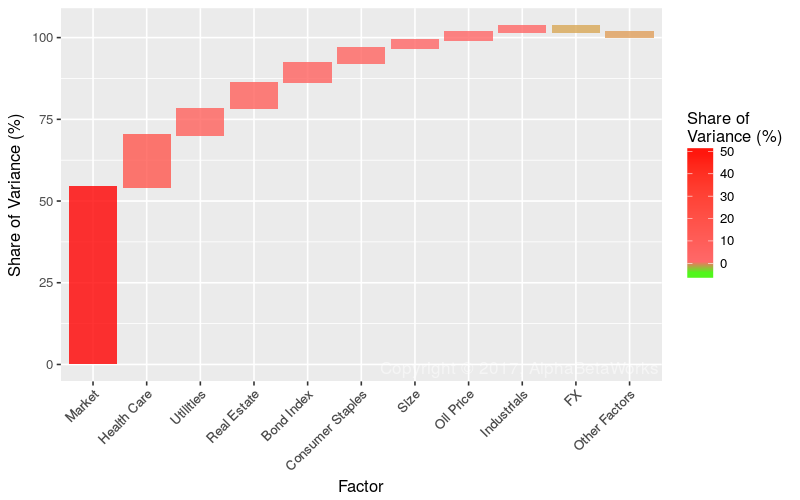
Replicating Fundamental Indexing with Market and Sector Factor Tilts
Market and Sector Factor portfolios were constructed using a Market ETF and nine top-level sector ETFS:
SPY
SPDR S&P 500 ETF Trust
XLY
Consumer Discretionary Select Sector SPDR Fund
XLP
Consumer Staples Select Sector SPDR Fund
XLE
Energy Select Sector SPDR Fund
XLF
Financial Select Sector SPDR Fund
XLV
Health Care Select Sector SPDR Fund
XLI
Industrial Select Sector SPDR Fund
XLB
Materials Select Sector SPDR Fund
XLK
Technology Select Sector SPDR Fund
XLU
Utilities Select Sector SPDR Fund
Position constraint for Sector ETFs was 0 to +100%, and for SPY -100% to +100%. Negative Market weight is necessary to target Market exposures that are not attainable by a long-only portfolio of Sector ETFs. Advanced sector indices, such as the NYSE Pure Exposure Indices, avoid this problem and enable long-only replicating portfolios targeting any combination of exposures.
Fundamental Indexing vs. Market and Sector Tilts: Absolute Performance
The following chart plots cumulative and relative returns for the fundamental indexing portfolio and the replicating Market and Sector Factor portfolio:
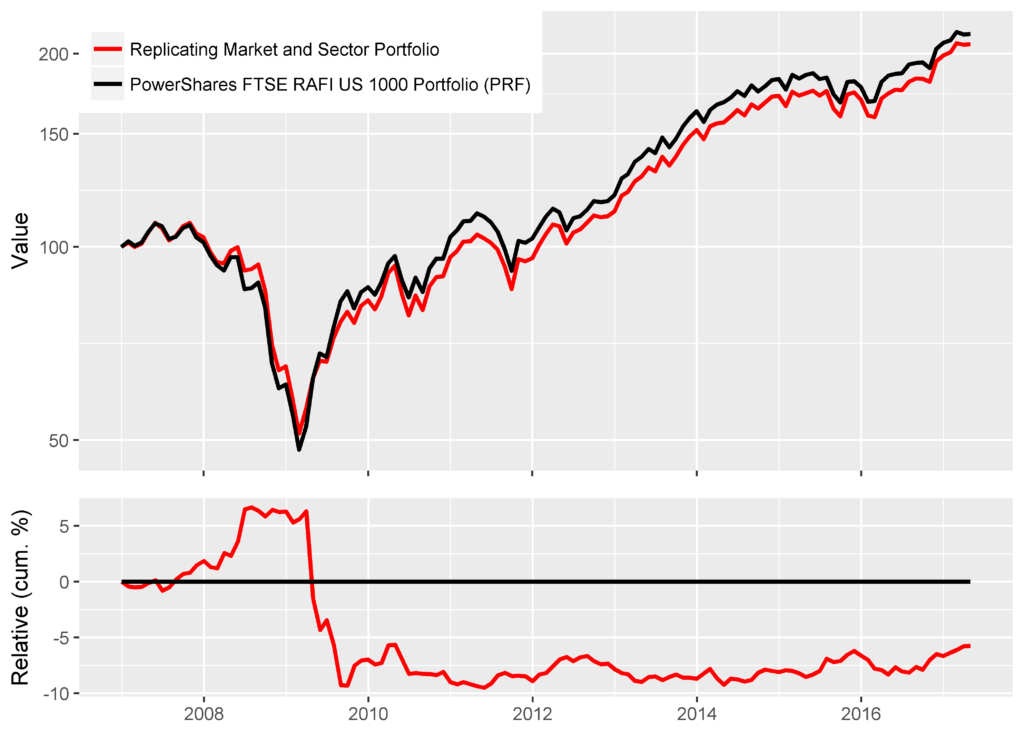
Replicating fundamental indexing with Market and Sector Factor tilts: absolute performance
We performed a t-test on the difference in monthly log returns to determine whether they are statistically different from zero:
t = -0.3439
p-value = 0.7315
95 percent confidence interval = (-0.1976, 0.1391)
sample estimate mean = -0.0293
We also performed a Ljung-Box Test on the difference in monthly log returns to determine whether it is a random walk (specifically, whether there are non-0 autocorrelations of the time series):
X-squared = 6.0837
p-value = 0.0136
Though the mean difference in log returns is not statistically different from 0, relative performance is not a random walk. The relative returns of PRF and the replicating portfolio are autocorrelated, as is evident in the chart above.
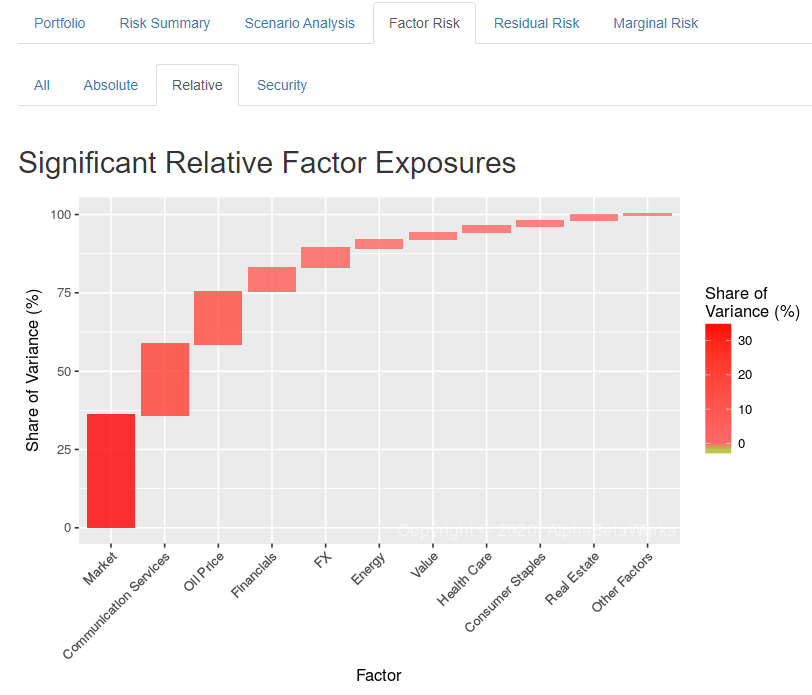
Fundamental Indexing vs. Market and Sector Tilts: Relative Performance
The following chart plots cumulative and relative returns for the fundamental indexing portfolio, the replicating Market and Sector Factor portfolio, and the SPDR S&P 500 ETF (SPY):
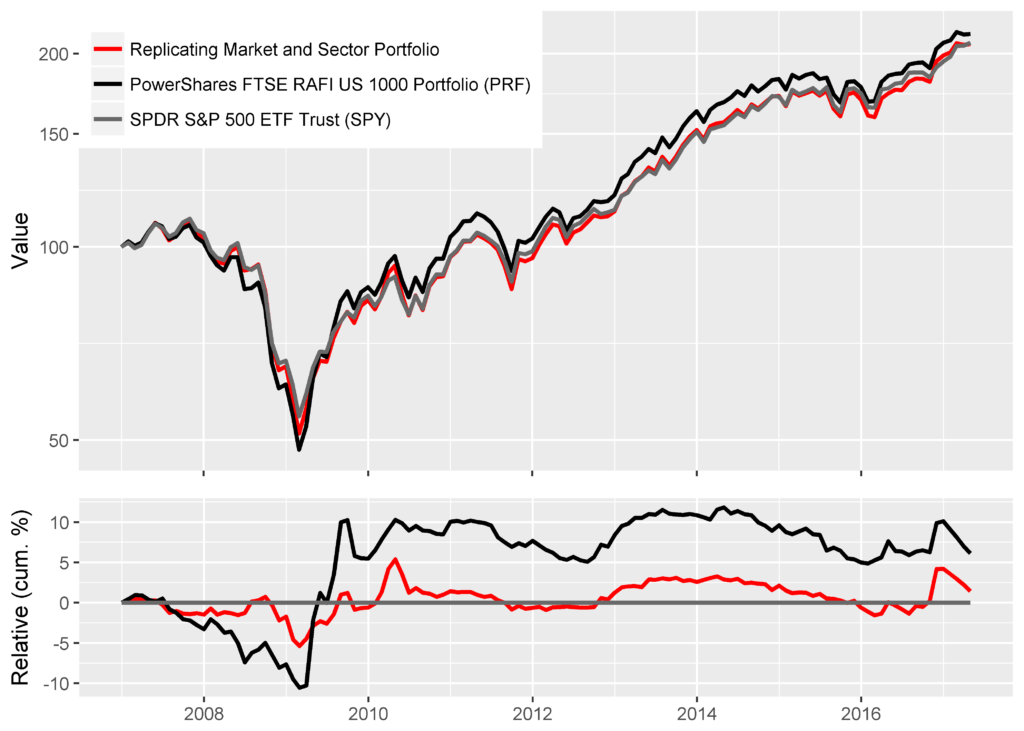
Replicating fundamental indexing with Market and Sector Factor tilts: relative performance
Performance difference mostly comes from a few months during the 2008-2009 crisis when residual variance spikes. The replicating portfolio first sharply outperforms and then sharply underperforms. In a calmer environment post-2009, the fit is much closer:
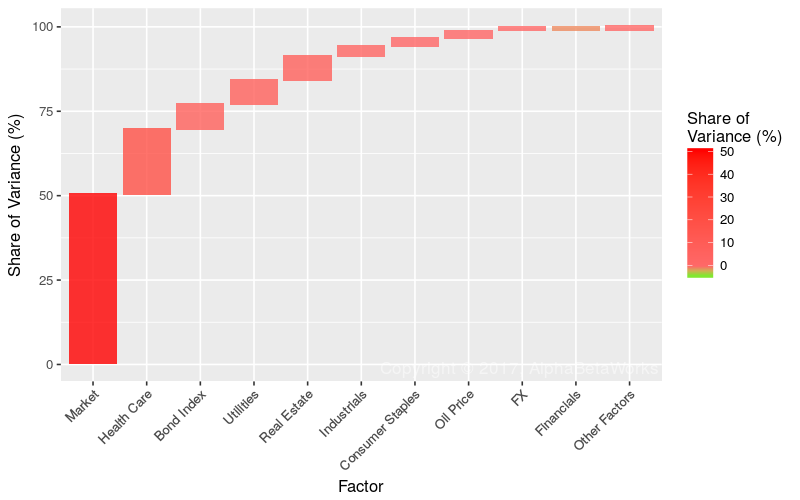
Replicating Fundamental Indexing with Market, Sector, and Style Factor Tilts
Market, Sector, and Style Factor tilt portfolios add a Growth/Value ETF pair and a Small-Cap ETF to capture the additional Style Factor exposures:
IWF
iShares Russell 1000 Growth ETF
IWD
iShares Russell 1000 Value ETF
IWM
iShares Russell 2000 ETF
Fundamental Indexing vs. Market, Sector, and Style Tilts: Absolute Performance
The following chart plots cumulative and relative returns for a fundamental indexing portfolio and the replicating Market, Sector, and Style Factor portfolio:
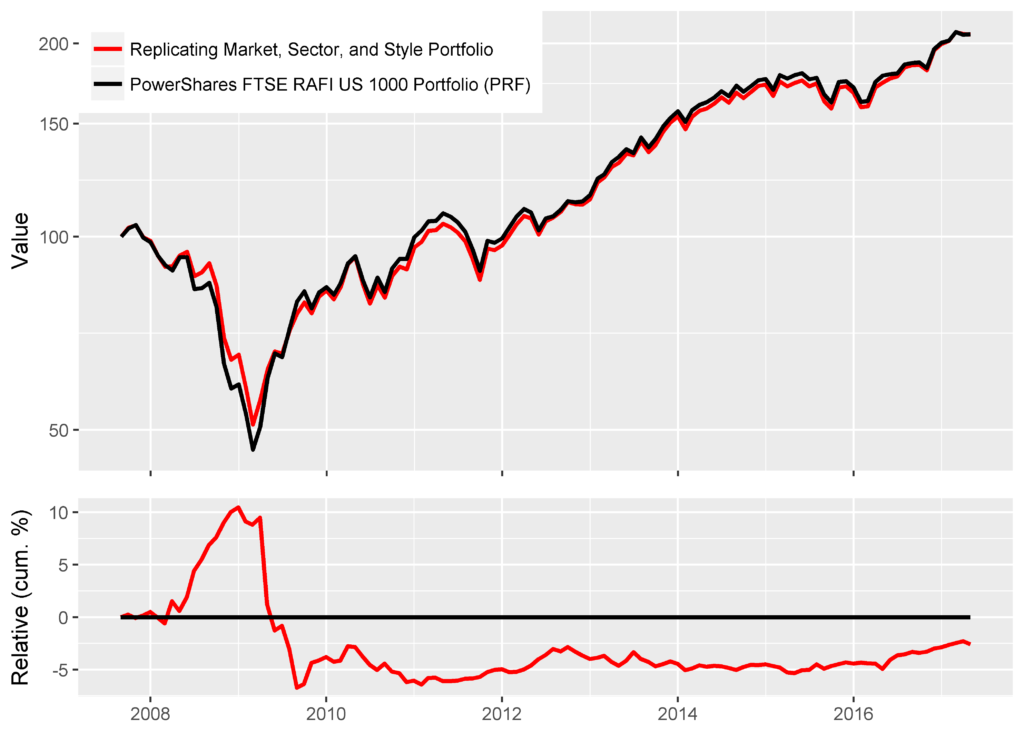
Replicating fundamental indexing with Market, Sector, and Style Factor tilts: absolute performance
The t-test results are similar to those of the Market and Sector replicating portfolio:
t = -0.0062504
p-value = 0.995
95 percent confidence interval = (-0.1802, 0.1791)
sample estimate mean = -0.0006
The Ljung-Box test results are also similar:
X-squared = 6.1228
p-value = 0.0134
Fundamental Indexing vs. Market, Sector, and Style Tilts: Relative Performance
The following chart plots cumulative and relative returns for the fundamental indexing portfolio, the replicating Market, Sector, and Style Factor portfolio, and SPY:
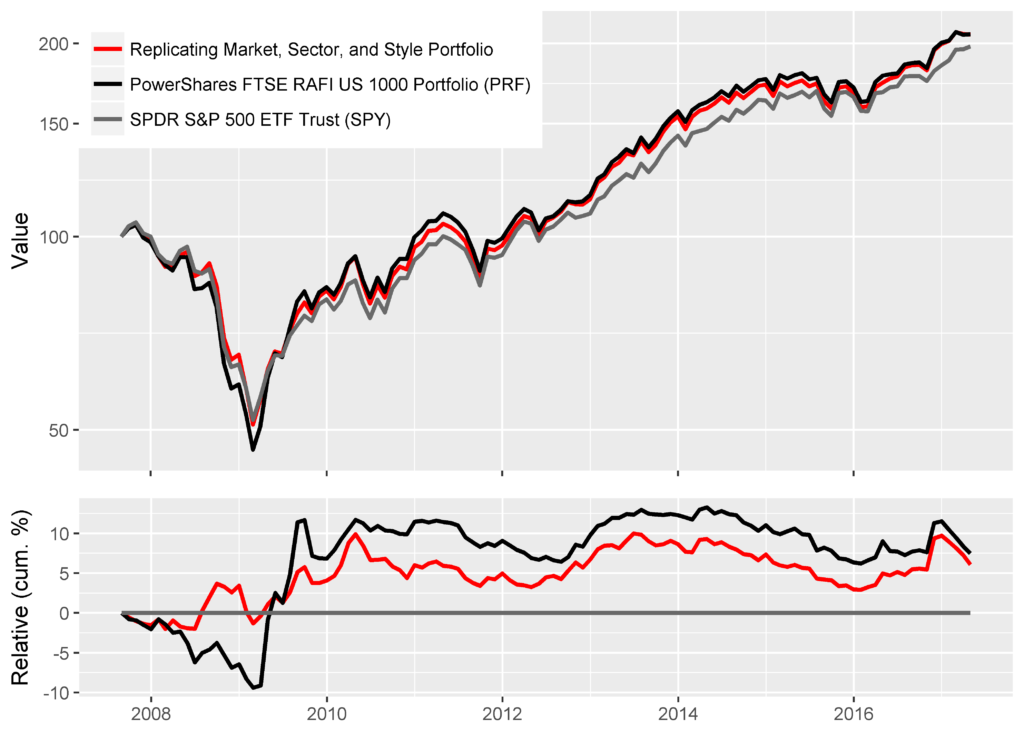
Replicating fundamental indexing with Market, Sector, and Style Factor tilts: relative performance
Over the entire 10-year history, the style factors do not materially change the quality of replication:
Whether the tracking error of replication is acceptable depends on the application.
Though fully replicating fundamental indexing without any residual tracking error is impossible, even simple Market and Sector factor tilts replicate over 96% of the absolute variance for the fundamental indexing portfolio over the past ten years.
In a normal market environment, factor tilts replicate most (60-75%) of the relative variance for the fundamental indexing portfolio.
In periods of market stress, the tracking error of the replicating portfolio relative to the target is substantial.
The difference in returns between the target and replicating portfolios is statistically insignificant, but it does not follow a random walk and exhibits cycles.
A typical analysis of hedge fund crowding considers large, popular, and concentrated hedge fund long equity holdings. Such analysis usually assumes that crowding comes from stock-specific bets and that it is a bullish indicator. These assumptions are incorrect and have cost investors dearly:
Residual, idiosyncratic, or stock-specific bets now account for less than a third of hedge fund crowding. Factor (systematic) risk, rather than the risk from individual stocks, is driving hedge funds’ active returns. Consequently, simplistic analysis of hedge fund crowding that focuses on specific stocks misses the bulk of funds’ active risk and return.
The returns of crowded hedge fund factor and residual bets vary over time as the funds go through cycles of capital inflows and outflows. Consequently, generic analysis of hedge fund crowding can herd investors into losing bets on the wrong side of a cycle. For instance, depending on the trend, investors may desire long exposure to the crowded factor exposures in one year and short exposure in another.
This article reviews hedge fund long equity crowding at the end of Q1 2017. We identify the dominant systematic exposures and the top residual bets that will have the largest impact on investor performance. We also explore the current trends in returns from crowding that indicate profitable positioning.
Identifying Hedge Fund Crowding
This article follows the approach of our earlier studies of hedge fund crowding: We start with a survivorship-free database of SEC filings by over 1,000 U.S. hedge funds spanning over a decade. This database contains all funds that had ever filed 13F Reports (which disclose long U.S. assets over $100 million). We only consider funds with a sufficiently low turnover to be analyzable from filings. We combine all fund portfolios into a single position-weighted portfolio (HF Aggregate). The analysis of HF Aggregate’s risk relative to the U.S. Market reveals its active bets and the industry’s crowding. The AlphaBetaWorks (ABW) Statistical Equity Risk Model – an effective predictor of future risk – identifies and quantifies the crowded exposures driving HF Aggregate’s performance.
Factor and Residual Components of Hedge Fund Crowding
The 3/31/2017 HF Aggregate had 2.6% estimated future volatility (tracking error) relative to the U.S. Market (represented by the iShares Russell 3000 ETF (IWV) benchmark). Approximately 30% of this was due to residual crowding, and approximately 70% was due to factor crowding:
Components of the Relative Risk for U.S. Hedge Fund Aggregate in Q1 2017
Source
Volatility (ann. %)
Share of Variance (%)
Factor
2.19
69.01
Residual
1.47
30.99
Total
2.64
100.00
Hedge fund crowding analysis that focuses on the popular holdings and position overlap thus captures less than a third of the total risk and overlooks over two-thirds of crowding that is due to factors – a fatal flaw. Since similar factor exposures can cause funds with no shared positions to correlate closely, a simplistic analysis of holdings and position overlap fosters dangerous complacency.
Stock Picking and Market Timing Returns from Crowding
A precise understanding of crowding is critical to investors and allocators since, depending on the capital flows, crowded bets can generate large and unexpected gains or losses.
The following chart shows cumulative βReturn (risk-adjusted returns from factor timing, or from the variation of factor exposures) of HF Aggregate. Crowded hedge fund factor bets have underperformed since 2011, and losses from hedge fund factor crowding have accelerated since 2015. The crowded factor bets below could have been attractive short candidates. In aggregate, hedge funds’ long equity portfolios would have made approximately 10% more since 2015 had they kept their factor exposures constant:
Historical Risk-Adjusted Return from Factor Timing of U.S. Hedge Fund Aggregate
Crowded hedge fund residual bets have also underperformed since 2011. The following chart shows cumulative αReturn (risk-adjusted returns from security selection) of HF Aggregate. HF Aggregate experienced massive losses from security selection during 2011-2015. Given the unprecedented losses, we advised long exposures to the crowded residual bets in late-2015, and these have indeed recovered:
Historical Risk-Adjusted Return from Security Selection of U.S. Hedge Fund Aggregate
We now turn to the specific crowded factor and residual bets behind the trends above.
Hedge Fund Factor (Systematic) Crowding
The following chart illustrates the main sources of factor crowding. HF Aggregate’s factor exposures are in red. The U.S. Market’s (defined as the iShares Russell 3000 ETF (IWV) benchmark) is in gray:
Significant Absolute and Residual Factor Exposures of U.S. Hedge Fund Aggregate in Q1 2017
The dominant bet of hedge funds’ long equity portfolios is Market (high Beta). The most crowded hedge fund bet is thus not a particular stock, but high overall market risk. HF Aggregate partially behaves like a leveraged market ETF, outperforming during bullish regimes and underperforming during bearish ones.
Factors Contributing Most to Relative Factor Variance of U.S. Hedge Fund Aggregate in Q1 2017
Factor
Relative Exposure
Factor Volatility
Share of Relative Factor Variance
Share of Relative Total Variance
Market
13.25
10.67
54.00
37.26
Health Care
8.55
7.62
15.93
10.99
Utilities
-3.05
12.86
8.16
5.63
Real Estate
-2.69
12.87
7.91
5.46
Bond Index
-7.33
3.59
6.02
4.15
Consumer Staples
-5.04
8.04
4.64
3.20
Size
-2.02
9.35
2.45
1.69
Oil Price
0.53
30.36
2.38
1.64
Industrials
-4.28
4.96
1.85
1.27
FX
2.59
6.77
-1.83
-1.26
(Relative exposures and relative variance contribution. All values are in %. Volatility is annualized.)
Crowding into a single factor (Market) accounts for more hedge fund risk than all their stock-specific and other factor bets combined. The three top sector bets are long Health Care, short Utilities, and short Real Estate.
HF Aggregate’s exposures to Market, Health Care, and Bond Factors remained near record levels reached recently.
Hedge Fund Residual (Idiosyncratic) Crowding
The remaining third of hedge fund crowding as of 3/31/2017 was due to residual (idiosyncratic,stock-specific) risk:
Stocks Contributing Most to Relative Residual Variance of U.S. Hedge Fund Aggregate in Q1 2017
Symbol
Name
Relative Exposure
Residual Volatility
Share of Relative Residual Variance
Share of Relative Total Variance
CHTR
Charter Communications, Inc. Class A
2.53
18.64
10.31
3.19
LNG
Cheniere Energy, Inc.
1.41
29.37
7.96
2.47
BABA
Alibaba Group Holding Ltd. Sponsored ADR
1.17
26.26
4.40
1.36
FB
Facebook, Inc. Class A
1.02
28.05
3.76
1.17
FLT
FleetCor Technologies, Inc.
1.19
22.02
3.19
0.99
HCA
HCA Holdings, Inc.
1.12
21.36
2.66
0.82
AAPL
Apple Inc.
-1.72
13.87
2.63
0.81
NXPI
NXP Semiconductors NV
0.78
28.62
2.31
0.71
PYPL
PayPal Holdings Inc
1.26
17.48
2.26
0.70
ATVI
Activision Blizzard, Inc.
0.98
21.53
2.05
0.64
(Relative exposures and relative variance contribution. All values are in %. Volatility is annualized.)
While systematic hedge fund crowding continues to dominate, investors and allocators should focus on the factor exposures. Without a firm grasp of factor crowding, allocators to a supposedly diversified hedge fund portfolio may be paying high active management fees for what is effectively a leveraged ETF book. Also, investors and fund followers may blindly follow losing factor bets.
Nevertheless, residual hedge fund crowding can be a profitable long and short indicator. The 25% decline in 2010-2015 was followed by a 15% gain.
Summary
Factor (systematic) exposures and risks shared across stocks, rather than individual positions, are the primary drivers of hedge fund industry’s long equity risk.
The main sources of Q1 2017 hedge fund crowding were long U.S. Market (high Beta), long Health Care, short Utilities, and short Real Estate Factor exposures.
Without a robust analysis of factor and residual crowding, a hedge fund investor, follower, or allocator may be investing in a generic passive factor portfolio, likely with leverage.
The crowded factor bets have been in a bearish trend and may represent attractive short candidates.
The crowded residual bets have been recovering from steep losses and may continue to represent attractive long candidates, though less so than in 2016.
Though 2016 was a poor year for most institutional portfolio managers, it was a satisfactory year for the most skilled ones. Security selection returns of the top U.S. stock pickers in 2016 were positive. When hedged to match market risk, a consensus portfolio of the top intuitional U.S. stock pickers outperformed the Market by approximately 2%.This article demonstrates how a robust equity risk model and predictive performance analytics identify the top stock pickers – the hard part of measuring investment skill. Since genuine investment skill persists, the top stock pickers of the past tend to generate positive stock picking returns in the future. We illustrate this performance and share the top consensus positions driving it. These consensus positions of the top U.S. stock pickers are a profitable resource for investors searching for ideas. The method for tracking the top active managers and this method’s performance are benchmarks against which capital allocators can evaluate qualitative and quantitative manager selection processes.
Identifying the Top U.S. Stock Pickers
This study updates our analysis for 2015 and follows a similar method: We analyzed long U.S. equity portfolios of all institutions that have filed Forms 13F. This survivorship-free portfolio database comprises thousands of firms. The database covers all institutions that have managed over $100 million in long U.S. assets. Some of these firms were not suitable for skill evaluation, for instance due to short filings histories or high turnover. Approximately 4,000 firms were evaluated.
During bullish market regimes, the top-performing portfolios are those that take the most factor (systematic) risk. During bearish market regimes, the top-performing portfolios are those that take the least risk. Hence, when the regimes change the leaders revert. This is the main reason nominal returns and related simplistic metrics of investment skill (Sharpe Ratio, Win/Loss Ratio, etc.) revert and fail. This is also the evidence behind most purported proofs of the futility of active manager selection. These arguments assume that, since the flawed performance metrics are non-predictive, all performance metrics are non-predictive, and it is impossible to identify future outperformers.
To eliminate the systematic noise that is the source of performance reversion, the AlphaBetaWorks Performance Analytics Platform calculates portfolio return from security selection – αReturn. αReturn is the performance a portfolio would have generated if all factor returns had been flat. This is the estimated residual performance due to stock picking skill, net of all factor effects. Each month we identify the top five percent among 13F-filers with the most consistently positive αReturns over the prior 36 months. This expert panel of the top stock pickers typically includes 100-150 firms. Data is lagged 2 months to account for the filing delay. We construct the aggregate expert portfolio (the ABW Expert Aggregate) by equal-weighting the expert portfolios and position-weighting stocks within the expert portfolios.
Manager fame and firm size are poor proxies for skill. Consequently, the ABW Expert Aggregate is an eclectic collection that includes hedge funds and asset management firms, banks, endowments, trust companies, and other institutions.
Market-Neutral Performance of the Top U.S. Stock Pickers
Since security selection skill persists, portfolios that have generated positive αReturns in the past are likely to generate them in the future. Consequently, a hedged aggregate of such portfolios (the Market-Neutral ABW Expert Aggregate) delivers consistent positive returns:
Cumulative Market-Neutral Portfolio Return: Top U.S. Stock Pickers’ Net Consensus Longs
2005
2006
2007
2008
2009
2010
2011
2012
2013
2014
2015
2016
Market-NeutralABW Expert Aggregate
4.15
14.43
12.74
5.95
-1.25
15.35
2.20
2.24
15.47
8.81
13.16
1.72
iShares Russell
3000 ETF
6.08
15.65
4.57
-37.16
28.21
16.81
0.78
16.43
32.97
12.41
0.34
12.61
ABW Expert Aggregate outperformed the broad market with less than half the volatility:
Market-Neutral
ABW Expert Aggregate
iShares Russell 3000 ETF
Annualized Return
7.69
7.49
Annualized Standard Deviation
5.29
14.71
Annualized Sharpe Ratio (Rf=0%)
1.45
0.51
There are several ways to reconcile the positive stock picking performance above with the apparently challenging environment for fundamental stock picking in 2016:
Performance of an average manager is a poor proxy for the performance of a top manager.
Some skilled managers may suffer from underdeveloped risk systems, and losses from hidden systematic risks conceal their stock-picking results.
Many skilled stock pickers are poor market timers, or they may have experienced a challenging market-timing environment.
ABW Expert Aggregate is different than the crowded portfolios, which we have written about at length. Whereas crowded bets are shared by the entire universe of investors, ABW Expert Aggregate is a small subset covering the consistently best stock pickers. It is common for crowded hedge fund longs (overweights) to be shorts (underweights) of ABW Expert Aggregate, and vice versa.
Market Performance of the Top U.S. Stock Pickers
The Market-Neutral ABW Expert Aggregate is fully hedged. Accordingly, it has insignificant market exposure and will, by definition, underperform the Market during the bullish regimes. Therefore, the Market-Neutral ABW Expert Aggregate is not suitable as a core holding and is not directly comparable to long portfolios.
The aggregate portfolio of the top stock pickers can be hedged to match the market risk. This portfolio (the Market-Risk ABW Expert Aggregate) delivers consistent outperformance, instead of the consistent absolute returns of the Market-Neutral ABW Expert Aggregate:
Cumulative Market-Risk Portfolio Return: Top U.S. Stock Pickers’ Net Consensus Longs
2005
2006
2007
2008
2009
2010
2011
2012
2013
2014
2015
2016
Market-RiskABW Expert Aggregate
10.43
32.20
17.32
-33.79
26.43
34.52
2.78
19.15
52.93
22.07
13.10
14.77
iShares Russell
3000 ETF
6.08
15.65
4.57
-37.16
28.21
16.81
0.78
16.43
32.97
12.41
0.34
12.61
Market-Risk
ABW Expert Aggregate
iShares Russell 3000 ETF
Annualized Return
15.53
7.49
Annualized Standard Deviation
16.57
14.71
Annualized Sharpe Ratio (Rf=0%)
0.94
0.51
Top U.S. Stock Pickers’ Consensus Positions
Just as few celebrated firms were the top U.S. stock pickers in 2016, few celebrated stocks were their top ideas. Below are the top 10 consensus overweights of the ABW Expert Aggregate at year-end 2016:
Symbol
Name
Exposure (%)
EA
Electronic Arts Inc.
1.41
NTES
NetEase, Inc.
1.00
OXY
Occidental Petroleum Corporation
0.69
PXD
Pioneer Natural Resources
0.68
PEP
PepsiCo, Inc.
0.63
SCHW
Charles Schwab Corporation
0.55
ACN
Accenture Plc
0.52
JNJ
Johnson & Johnson
0.48
NKE
NIKE, Inc.
0.46
V
Visa Inc.
0.44
Many of these positions remained since year-end 2015, illustrating the stability of the ABW Expert Aggregate.
Top Stock Pickers’ Exposure to Electronic Arts (EA)
The top panel on the following chart shows EA’s cumulative nominal return in black and cumulative residual return (αReturn) in blue. Recall that residual return or αReturn is the performance EA would have generated if all factor returns had been zero. The bottom panel shows exposure to EA within the ABW Expert Aggregate. Top stock pickers had negligible exposure to EA until 2015. In early-2015 EA became one of the largest exposures within the Expert Aggregate, and it remained a top position through 2016:
Cumulative αReturns of EA and Exposure to EA within the Hedged Portfolio of the Top U.S. Stock Pickers’ Net Consensus Longs
Top Stock Pickers’ Exposure to NetEase (NTES)
ABW Expert Aggregate had negligible exposure to NTES until early 2016. NTES became a consensus long by early-2016. The strong positive αReturn of NTES continued through 2016:
Cumulative αReturns of NTES and Exposure to NTES within the Hedged Portfolio of the Top U.S. Stock Pickers’ Net Consensus Longs
Top Stock Pickers’ Exposure to Occidental Petroleum (OXY)
The Aggregate was mostly underweight (short) OXY between 2010 and 2016. This means that the top U.S. stock pickers were underweight the stock. Their exposure to OXY grew through 2016 and by year-end it was a top bet. The smart money has added to OXY in 2016 even as it underperformed:
Cumulative αReturns of OXY and Exposure to OXY within the Hedged Portfolio of the Top U.S. Stock Pickers’ Net Consensus Longs
Conclusions
Robust equity risk models and predictive performance analytics can identify the top stock pickers in the sea of mediocrity.
The market-neutral aggregate of the top stock pickers’ portfolios delivers consistent absolute performance.
The aggregate of the top stock pickers’ portfolios matching market risk delivers consistent outperformance relative to the Market.
Consensus portfolio of the top stock pickers is a profitable source of investment ideas.
Provided they control properly for systematic (factor) effects, simple rules for manager selection tend to select future outperformers.
A typical analysis of hedge fund crowding surveys popular equity holdings. Yet, such residual, idiosyncratic, or stock-specific bets account for only 31% of current hedge fund crowding. Factor (systematic) risk, rather than a few specific stocks, is driving absolute and relative returns. Consequently, most analysis of hedge fund crowding focuses on a small fraction of crowding, missing its bulk.Nearly 70% of the hedge fund industry’s long equity risk comes from factor crowding. Market exposure (high Beta) constitutes half of that – more than all the remaining factor bets and more than all the stock-specific bets combined. Since the consensus factor exposures can be obtained cheaply via ETFs and do not warrant the same compensation as idiosyncratic insights, it is vital for investors and allocators to understand and manage these crowded exposures. In addition, crowded factor bets are vulnerable to damaging liquidations. This article reviews hedge fund long equity bets at the end of 2016 and focuses on the dominant systematic exposures that will have the largest impact on investor performance.
Identifying Hedge Fund Crowding
This article follows the approach of our earlier studies of hedge fund crowding: We started with a 10-year survivorship-free database of SEC filings by over 1,000 U.S. hedge funds. This database contains all funds that had long U.S. assets in excess of $100 million and sufficiently low turnover to be analyzable from their filings. We then combined all fund portfolios into a single position-weighted portfolio (HF Aggregate). The analysis of HF Aggregate’s risk relative to the U.S. Market revealed its main active bets. The AlphaBetaWorks (ABW) Statistical Equity Risk Model – an effective predictor of future risk – identified and quantified these crowded exposures driving HF Aggregate’s performance.
Hedge Fund Industry’s Risk
The 12/31/2016 HF Aggregate had 2.7% estimated future volatility (tracking error) relative to the U.S. Market. Approximately a third of this tracking error was due to residual crowding, and the remaining two thirds was due to factor crowding:
Components of the Relative Risk for U.S. Hedge Fund Aggregate in Q4 2016
Source
Volatility (ann. %)
Share of Variance (%)
Factor
2.25
68.89
Residual
1.51
31.11
Total
2.71
100.00
The low 1.5% residual volatility, less than a third of the total, illustrates the challenges of hedge fund crowding analysis that focuses on the popular holdings and position overlap. Such stock-specific view overlooks the two thirds of crowding that is due to factors – a fatal flaw. As a result, simplistic analysis of popular holdings and of position overlap fosters dangerous complacency when funds with no shared positions correlate highly due to similar factor exposures.
Hedge Fund Factor (Systematic) Crowding
The following chart illustrates the main sources of factor risk. HF Aggregate’s factor exposures are in red. The U.S. Market’s (defined as the iShares Russell 3000 ETF (IWV) Benchmark) is in gray:
Significant Absolute and Residual Factor Exposures of U.S. Hedge Fund Aggregate in Q4 2016
The dominant bet of hedge funds’ long equity portfolios is Market (high Beta). The most crowded hedge fund bet is thus not a particular stock, but high overall market risk. HF Aggregate thus partially behaves like a leveraged market ETF, outperforming during bullish regimes and underperforming during bearish ones.
Factors Contributing Most to Relative Factor Variance of U.S. Hedge Fund Aggregate in Q4 2016
Factor
Relative Exposure
Factor Volatility
Share of Relative Factor Variance
Share of Relative Total Variance
Market
12.92
10.52
50.26
34.62
Health Care
10.14
7.61
19.26
13.26
Bond Index
-9.71
3.59
7.32
5.04
Utilities
-3.19
12.53
7.14
4.92
Real Estate
-2.51
12.88
7.07
4.87
Industrials
-5.00
4.96
3.09
2.13
Consumer Staples
-4.97
7.75
2.27
1.56
Oil Price
0.56
30.34
2.27
1.56
FX
-1.12
6.87
1.02
0.70
Financials
-2.38
7.71
-0.83
-0.57
(Relative exposures and relative variance contribution. All values are in %. Volatility is annualized.)
Hedge funds’ Market Factor crowding accounts for more risk than all their stock-specific bets combined. This dominance of a single systematic risk illustrates how asset managers’ and allocators’ endurance increasingly depends on their grasp of systematic crowding. It also illustrates the dangers of fixation on individual holdings.
HF Aggregate’s exposures to Market, Health Care, and Bond Factors remained near record levels reached recently. We analyze these in their order of importance below.
Hedge Fund U.S. Market Factor (Beta) Crowding
Hedge Fund Aggregates’ U.S. Market exposure decreased slightly from the mid-2016 record level:
U.S. Hedge Fund Aggregate’s U.S. Market Factor Exposure History
Even following this decrease in risk, the average dollar of hedge fund long U.S. equity capital carries approximately 20% more market risk than S&P 500. Thus, hedge fund portfolios move in concert with the market, but with heightened sensitivity to it. Consequently, simple comparison of hedge fund returns to broad equity benchmarks and identification of nominal outperformance with alpha remain dangerous. Further, simple equation of capital invested in (dollar exposures to) a market or sector with actual portfolio risk remains flawed.
Hedge Fund Health Care Crowding
Hedge Fund Aggregates’ Health Care exposure also decreased sharply from its 2016 record:
U.S. Hedge Fund Aggregate’s U.S. Health Care Factor Exposure History
Even after this decrease, HF Aggregate continues to carry almost twice the Health Care exposure of the Market. The Health Care Factor remains the second most significant hedge fund long equity bet.
Hedge Fund Short Bonds/Long Interest Rates Factor Crowding
HF Aggregate’s Short Bonds/Long Interest Rates Factor exposure was profitable in late-2016. This exposure decreased by half in the second half of the year, following the election catalyst:
U.S. Hedge Fund Aggregate’s U.S. Long Bonds/Short Interest Rates Factor Exposure History
Short bond exposure is a natural consequence of hedge funds’ interest in “cheap call options”, often highly financially leveraged companies with asymmetric profit and loss potential. We discussed the fundamental sources of this Bonds/Interest Rates Factor exposure in more detail in a prior article.
Hedge Fund Residual (Idiosyncratic) Crowding
The remaining third of hedge fund crowding on 12/31/2016 was due to residual (idiosyncratic,stock-specific) risk. Though this is a minor component of the total crowding, we survey it for completeness and to facilitate comparisons with the basic surveys of crowding found elsewhere:
Stocks Contributing Most to Relative Residual Variance of U.S. Hedge Fund Aggregate in Q4 2016
Symbol
Name
Relative Exposure
Residual Volatility
Share of Relative Residual Variance
Share of Relative Total Variance
CHTR
Charter Communications, Inc.
2.62
19.03
10.87
3.38
LNG
Cheniere Energy, Inc.
1.40
29.27
7.29
2.27
FLT
FleetCor Technologies, Inc.
1.27
23.17
3.80
1.18
AGN
Allergan plc
1.44
18.31
3.05
0.95
AAPL
Apple Inc.
-1.85
13.81
2.86
0.89
FB
Facebook, Inc. Class A
0.91
27.00
2.63
0.82
BABA
Alibaba Group Holding Ltd. ADR
1.02
23.23
2.47
0.77
HCA
HCA Holdings, Inc.
1.09
21.27
2.34
0.73
HUM
Humana Inc.
1.05
21.88
2.29
0.71
WMB
Williams Companies, Inc.
0.83
25.52
1.94
0.60
(Relative exposures and relative variance contribution. All values are in %. Volatility is annualized.)
Though these exposures are sensitive to asset flows, they generally constitute minor risks within the crowded portfolios. While systematic hedge fund crowding continues to dominate, investors and allocators should focus on the factor exposures. Without a firm grasp of factor crowding, a supposedly diversified hedge fund portfolio may be charging high active management fees for what is effectively a leveraged ETF book.
Summary
Factor (systematic) exposures and risks shared across stocks, rather than individual positions, are driving hedge fund industry’s long equity risk. Exposure to these crowded bets can be obtained much more cheaply via ETFs and other passive products.
The main sources of Q4 2016 hedge fund crowding were long U.S. Market (high Beta), long Health Care, and short Bonds/long Interest Rates Factor exposures.
Without a robust analysis of factor and residual crowding, a hedge fund investor, follower, or allocator may be investing in a generic passive factor portfolio, likely with leverage.
Whereas most analysis of hedge fund crowding focuses on individual stocks, over 85% of hedge funds’ recent long equity variance has been due to their factor (systematic) risk. Residual, idiosyncratic, or stock-specific bets accounted for less than 15%. Thus, factor crowding has dominated hedge fund industry’s absolute and relative returns. This article reviews the most crowded hedge fund long equity bets at 9/30/2016.Understanding and quantifying this factor crowding is vital for hedge fund investors and allocators: Factor exposures that are shared by the entire hedge fund industry and that can be obtained cheaply with passive funds do not warrant the same compensation as the distinctive insights of gifted managers. Even worse, crowded bets expose investors to damaging stampedes during liquidations.
Identifying Hedge Fund Crowding
This article’s approach follows our earlier studies of hedge fund crowding: We started with a 10-year survivorship-free dataset of SEC filings by over 1,000 hedge funds. We then created a position-weighted portfolio (HF Aggregate) comprising all hedge fund long U.S. equity portfolios that can examined using the filings. We analyzed HF Aggregate’s risk and its historical exposures relative to the U.S. Market. The top contributors to hedge fund industry’s relative risk are the industry’s most crowded bets. Factor exposures were analyzed using the AlphaBetaWorks (ABW) Statistical Equity Risk Model – an effective predictor of future risk.
Hedge Fund Industry’s Risk
The 9/30/2016 HF Aggregate had 3.9% estimated future volatility (tracking error) relative to the U.S. Market. Less than 20% of this risk came from individual stocks, or from stock-specific crowding; the remainder – more than 80% – came from factor (systematic) crowding:
Components of the Relative Risk for U.S. Hedge Fund Aggregate in Q3 2016
Source
Volatility (ann. %)
Share of Variance (%)
Factor
3.50
82.19
Residual
1.63
17.81
Total
3.86
100.00
Since residual risk accounts for just 18% of the total, basic analysis of hedge fund crowding that examines popular holdings and position overlap is misguided. Such stock-specific analysis of crowding covers less than 20% of the industry’s risk, overlooking the dominant 80% of hedge fund crowding that is due to factors – a fatal flaw. Even funds with no shared positions correlate highly when they have similar factor exposures, so simplistic analysis of popular holdings and of position overlap understates portfolio risk and fosters complacency.
Hedge Fund Factor (Systematic) Crowding
Below are HF Aggregate’s principal factor exposures (in red). The U.S. Market, defined as the iShares Russell 3000 ETF (IWV) is the Benchmark (in gray). These factors are the primary sources of risk in the table above:
Significant Absolute and Residual Factor Exposures of U.S. Hedge Fund Aggregate in Q3 2016
The dominant bet of hedge funds’ long equity portfolios is Market (high Beta):
Factors Contributing Most to Relative Factor Variance of U.S. Hedge Fund Aggregate in Q3 2016
Factor
Relative Exposure
Factor Volatility
Share of Relative Factor Variance
Share of Relative Total Variance
Market
20.65
10.59
46.19
37.97
Size
-14.67
8.62
19.06
15.66
Health Care
12.68
7.54
16.22
13.33
Bond Index
-19.34
3.37
8.94
7.35
Consumer Staples
-7.87
7.24
5.28
4.34
Utilities
-3.40
12.46
5.00
4.11
FX
10.70
6.80
-4.22
-3.47
Real Estate
-1.86
12.80
2.97
2.44
Oil Price
1.03
30.15
2.75
2.26
Financials
-4.84
7.05
-2.09
-1.72
(Relative exposures and relative variance contribution. All values are in %. Volatility is annualized.)
This high U.S. Market exposure alone is twice as influential as all the stock-specific bets combined. Given this importance of factor crowding compared to residual crowding, popular fascination with fund holdings and position overlap is especially dangerous. Asset managers’ and allocators’ endurance thus depends increasingly on their edge in assessing systematic crowding.
Hedge Fund Short Bonds/Long Interest Rates Factor Crowding
HF Aggregate’s exposures to Market, Size, and Health Factors were near their peak levels seen in recent quarters. In addition to these, their Short Bonds/Long Interest Rates Factor exposure has also recently reached historic extremes:
U.S. Hedge Fund Aggregate’s U.S. Long Bonds/Short Interest Rates Factor Exposure History
We discussed the fundamental sources of this Bonds/Interest Rates Factor exposure in a prior article. Short bond risk is a natural consequence of hedge funds’ fondness for financially leveraged companies, often viewed as “cheap call options.” A company’s indebtedness creates economic and statistically observable short bond exposure. Given the Q4 2016 moves in yields, this bet should prove profitable for the hedge fund industry.
Hedge Fund Residual (Idiosyncratic) Crowding
A fifth of hedge fund crowding on 9/30/2016 was due to residual (idiosyncratic,stock-specific) risk. The following stocks were the main contributors to residual hedge fund crowding:
Stocks Contributing Most to Relative Residual Variance of U.S. Hedge Fund Aggregate in Q3 2016
Symbol
Name
Relative Exposure
Residual Volatility
Share of Relative Residual Variance
Share of Relative Total Variance
LNG
Cheniere Energy, Inc.
1.63
28.94
8.43
1.50
VRX
Valeant Pharmaceuticals International Inc
0.89
43.63
5.76
1.02
AGN
Allergan plc
1.86
18.17
4.32
0.77
WMB
Williams Companies, Inc.
1.28
25.87
4.12
0.73
CHTR
Charter Communications, Inc. Class A
1.69
19.27
4.01
0.71
FLT
FleetCor Technologies, Inc.
1.62
17.40
3.02
0.54
AAPL
Apple Inc.
-1.90
14.29
2.78
0.50
EXPE
Expedia, Inc.
1.04
24.57
2.47
0.44
BABA
Alibaba Group Holding Ltd. Sponsored ADR
1.07
23.61
2.43
0.43
HCA
HCA Holdings, Inc.
1.10
21.96
2.22
0.40
(Relative exposures and relative variance contribution. All values are in %. Volatility is annualized.)
The importance of residual crowding diminished in recent quarters as factor crowding increased. Consequently, hedge fund stock-picking has faded in importance relative to market timing. The most crowded stocks are sensitive to asset flows in and out of the industry, but they are not the main threat to crowded portfolios. In the current environment of extreme systematic hedge fund crowding, investors and allocators should focus on the factor exposures. Without an accurate view of factor crowding, investors in a supposedly diversified hedge fund portfolio often end up paying high active fees for a passive factor portfolio.
Summary
At Q3 2016, over 80% of hedge fund industry’s relative long equity risk was due to factor, or systematic, crowding.
The main sources of Q3 2016 hedge fund crowding were high U.S. Market, short Size, long Health, and short Bonds/long Interest Rates Factor exposures.
Short Bonds/Long Interest Rates Factor exposure reached historic extremes.
Systematic exposures and risks shared across stocks, rather than individual positions, are driving 80% of the hedge fund industry’s long equity risk.
Only robust analysis of factor and residual crowding can determine whether a hedge fund investor, follower, or allocator is investing in exceptional insights or in a generic passive factor portfolio.