
A typical analysis of hedge fund crowding considers large, popular, and concentrated hedge fund long equity holdings. Such analysis usually assumes that crowding comes from stock-specific bets and that it is a bullish indicator. These assumptions are incorrect and have cost investors dearly:
- Residual, idiosyncratic, or stock-specific bets now account for less than a third of hedge fund crowding. Factor (systematic) risk, rather than the risk from individual stocks, is driving hedge funds’ active returns. Consequently, simplistic analysis of hedge fund crowding that focuses on specific stocks misses the bulk of funds’ active risk and return.
- The returns of crowded hedge fund factor and residual bets vary over time as the funds go through cycles of capital inflows and outflows. Consequently, generic analysis of hedge fund crowding can herd investors into losing bets on the wrong side of a cycle. For instance, depending on the trend, investors may desire long exposure to the crowded factor exposures in one year and short exposure in another.
This article reviews hedge fund long equity crowding at the end of Q1 2017. We identify the dominant systematic exposures and the top residual bets that will have the largest impact on investor performance. We also explore the current trends in returns from crowding that indicate profitable positioning.
Identifying Hedge Fund Crowding
This article follows the approach of our earlier studies of hedge fund crowding: We start with a survivorship-free database of SEC filings by over 1,000 U.S. hedge funds spanning over a decade. This database contains all funds that had ever filed 13F Reports (which disclose long U.S. assets over $100 million). We only consider funds with a sufficiently low turnover to be analyzable from filings. We combine all fund portfolios into a single position-weighted portfolio (HF Aggregate). The analysis of HF Aggregate’s risk relative to the U.S. Market reveals its active bets and the industry’s crowding. The AlphaBetaWorks (ABW) Statistical Equity Risk Model – an effective predictor of future risk – identifies and quantifies the crowded exposures driving HF Aggregate’s performance.
Factor and Residual Components of Hedge Fund Crowding
The 3/31/2017 HF Aggregate had 2.6% estimated future volatility (tracking error) relative to the U.S. Market (represented by the iShares Russell 3000 ETF (IWV) benchmark). Approximately 30% of this was due to residual crowding, and approximately 70% was due to factor crowding:

Components of the Relative Risk for U.S. Hedge Fund Aggregate in Q1 2017
| Source | Volatility (ann. %) | Share of Variance (%) |
| Factor | 2.19 | 69.01 |
| Residual | 1.47 | 30.99 |
| Total | 2.64 | 100.00 |
Hedge fund crowding analysis that focuses on the popular holdings and position overlap thus captures less than a third of the total risk and overlooks over two-thirds of crowding that is due to factors – a fatal flaw. Since similar factor exposures can cause funds with no shared positions to correlate closely, a simplistic analysis of holdings and position overlap fosters dangerous complacency.
Stock Picking and Market Timing Returns from Crowding
A precise understanding of crowding is critical to investors and allocators since, depending on the capital flows, crowded bets can generate large and unexpected gains or losses.
The following chart shows cumulative βReturn (risk-adjusted returns from factor timing, or from the variation of factor exposures) of HF Aggregate. Crowded hedge fund factor bets have underperformed since 2011, and losses from hedge fund factor crowding have accelerated since 2015. The crowded factor bets below could have been attractive short candidates. In aggregate, hedge funds’ long equity portfolios would have made approximately 10% more since 2015 had they kept their factor exposures constant:

Historical Risk-Adjusted Return from Factor Timing of U.S. Hedge Fund Aggregate
Crowded hedge fund residual bets have also underperformed since 2011. The following chart shows cumulative αReturn (risk-adjusted returns from security selection) of HF Aggregate. HF Aggregate experienced massive losses from security selection during 2011-2015. Given the unprecedented losses, we advised long exposures to the crowded residual bets in late-2015, and these have indeed recovered:

Historical Risk-Adjusted Return from Security Selection of U.S. Hedge Fund Aggregate
We now turn to the specific crowded factor and residual bets behind the trends above.
Hedge Fund Factor (Systematic) Crowding
The following chart illustrates the main sources of factor crowding. HF Aggregate’s factor exposures are in red. The U.S. Market’s (defined as the iShares Russell 3000 ETF (IWV) benchmark) is in gray:

Significant Absolute and Residual Factor Exposures of U.S. Hedge Fund Aggregate in Q1 2017
The dominant bet of hedge funds’ long equity portfolios is Market (high Beta). The most crowded hedge fund bet is thus not a particular stock, but high overall market risk. HF Aggregate partially behaves like a leveraged market ETF, outperforming during bullish regimes and underperforming during bearish ones.
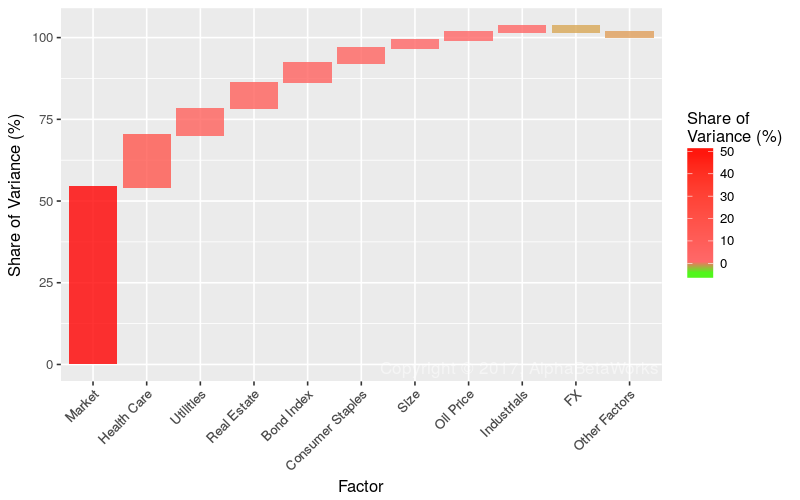
Factors Contributing Most to Relative Factor Variance of U.S. Hedge Fund Aggregate in Q1 2017
| Factor | Relative Exposure | Factor Volatility | Share of Relative Factor Variance | Share of Relative Total Variance |
| Market | 13.25 | 10.67 | 54.00 | 37.26 |
| Health Care | 8.55 | 7.62 | 15.93 | 10.99 |
| Utilities | -3.05 | 12.86 | 8.16 | 5.63 |
| Real Estate | -2.69 | 12.87 | 7.91 | 5.46 |
| Bond Index | -7.33 | 3.59 | 6.02 | 4.15 |
| Consumer Staples | -5.04 | 8.04 | 4.64 | 3.20 |
| Size | -2.02 | 9.35 | 2.45 | 1.69 |
| Oil Price | 0.53 | 30.36 | 2.38 | 1.64 |
| Industrials | -4.28 | 4.96 | 1.85 | 1.27 |
| FX | 2.59 | 6.77 | -1.83 | -1.26 |
(Relative exposures and relative variance contribution. All values are in %. Volatility is annualized.)
Crowding into a single factor (Market) accounts for more hedge fund risk than all their stock-specific and other factor bets combined. The three top sector bets are long Health Care, short Utilities, and short Real Estate.
HF Aggregate’s exposures to Market, Health Care, and Bond Factors remained near record levels reached recently.
Hedge Fund Residual (Idiosyncratic) Crowding
The remaining third of hedge fund crowding as of 3/31/2017 was due to residual (idiosyncratic, stock-specific) risk:
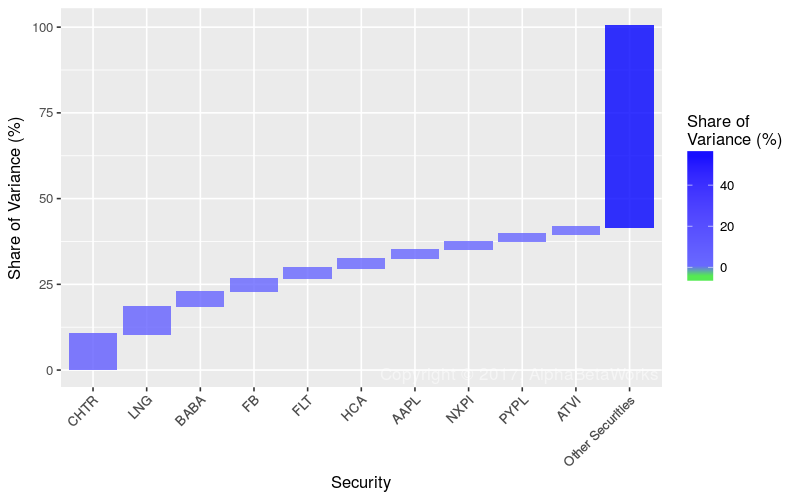
Stocks Contributing Most to Relative Residual Variance of U.S. Hedge Fund Aggregate in Q1 2017
| Symbol | Name | Relative Exposure | Residual Volatility | Share of Relative Residual Variance | Share of Relative Total Variance |
| CHTR | Charter Communications, Inc. Class A | 2.53 | 18.64 | 10.31 | 3.19 |
| LNG | Cheniere Energy, Inc. | 1.41 | 29.37 | 7.96 | 2.47 |
| BABA | Alibaba Group Holding Ltd. Sponsored ADR | 1.17 | 26.26 | 4.40 | 1.36 |
| FB | Facebook, Inc. Class A | 1.02 | 28.05 | 3.76 | 1.17 |
| FLT | FleetCor Technologies, Inc. | 1.19 | 22.02 | 3.19 | 0.99 |
| HCA | HCA Holdings, Inc. | 1.12 | 21.36 | 2.66 | 0.82 |
| AAPL | Apple Inc. | -1.72 | 13.87 | 2.63 | 0.81 |
| NXPI | NXP Semiconductors NV | 0.78 | 28.62 | 2.31 | 0.71 |
| PYPL | PayPal Holdings Inc | 1.26 | 17.48 | 2.26 | 0.70 |
| ATVI | Activision Blizzard, Inc. | 0.98 | 21.53 | 2.05 | 0.64 |
(Relative exposures and relative variance contribution. All values are in %. Volatility is annualized.)
While systematic hedge fund crowding continues to dominate, investors and allocators should focus on the factor exposures. Without a firm grasp of factor crowding, allocators to a supposedly diversified hedge fund portfolio may be paying high active management fees for what is effectively a leveraged ETF book. Also, investors and fund followers may blindly follow losing factor bets.
Nevertheless, residual hedge fund crowding can be a profitable long and short indicator. The 25% decline in 2010-2015 was followed by a 15% gain.
Summary
- Factor (systematic) exposures and risks shared across stocks, rather than individual positions, are the primary drivers of hedge fund industry’s long equity risk.
- The main sources of Q1 2017 hedge fund crowding were long U.S. Market (high Beta), long Health Care, short Utilities, and short Real Estate Factor exposures.
- Without a robust analysis of factor and residual crowding, a hedge fund investor, follower, or allocator may be investing in a generic passive factor portfolio, likely with leverage.
- The crowded factor bets have been in a bearish trend and may represent attractive short candidates.
- The crowded residual bets have been recovering from steep losses and may continue to represent attractive long candidates, though less so than in 2016.


