Tag Archives: crowding

U.S. Smart Beta Crowding

Rapid asset flows into smart beta strategies have led to concerns about froth and a vigorous debate among systematic portfolio vendors. At the same time, few discussions of smart beta crowding are burdened by data on the aggregate risk of smart beta strategies. This article attempts to remedy this data vacuum. We survey the risk factors and the stocks responsible for U.S. smart beta crowding. In doing so, we identify the exposures that would benefit the most from further asset flows into smart beta portfolios and those that would suffer the most from any outflows:

  • The most crowded factor (systematic) exposures are short Size (overweight smaller companies) and short (underweight) Technology Factors.
  • The most crowded residual (idiosyncratic, or stock-specific) exposures are short (underweight) FAANG stocks.
  • Exposures to dumb factors account for over 80% of smart beta crowding.

Our findings refute many common beliefs about smart beta crowding.

It follows that the vigorous performance of Technology shares and FAANG stocks specifically has been in spite of, rather than due to, the asset flows into smart beta strategies. Instead, the principal beneficiaries of such inflows and the most crowded smart beta bet have been smaller companies. Smart beta strategies tend to overweight smaller companies relative to the passive (capitalization-weighted) Market Portfolio. Consequently, smaller companies are most at risk should the flows into smart beta reverse. Given its importance, allocators and portfolio managers should pay particular attention to this Size Factor crowding.

Identifying Smart Beta Crowding

This article applied AlphaBetaWorks pioneering analysis of Hedge Fund Crowding to U.S. smart beta equity ETFs. We aggregated the Q2 2017 positions of over 300 U.S. smart beta equity ETFs with approximately $700 billion in total assets. We combined all portfolios into a single position-weighted portfolio – U.S. Smart Beta Aggregate (USSB Aggregate). We then used the AlphaBetaWorks (ABW) Statistical Equity Risk Model an effective predictor of future risk – to analyze USSB Aggregate’s risk relative to the iShares Russell 3000 ETF (IWV) benchmark. The benchmark is a close proxy for the passive U.S. Equity Market portfolio.

We find that a small number of active bets are behind the aggregate risk and performance of U.S. smart beta ETFs. Our analysis assumes that the U.S. smart beta ETF universe is a good proxy for the total smart beta strategy universe. In this case, the analysis captures overall U.S. smart beta crowding.

Factor and Residual Components of U.S. Smart Beta Crowding

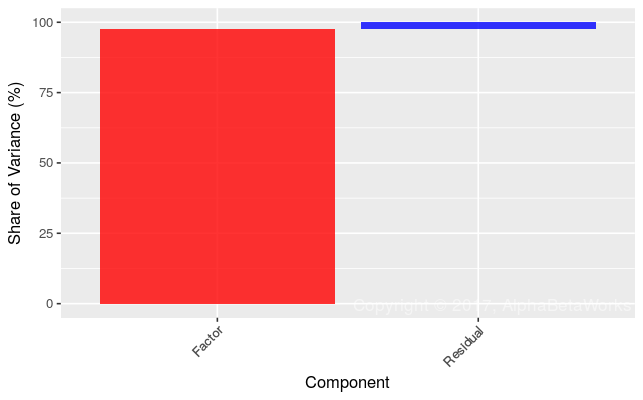
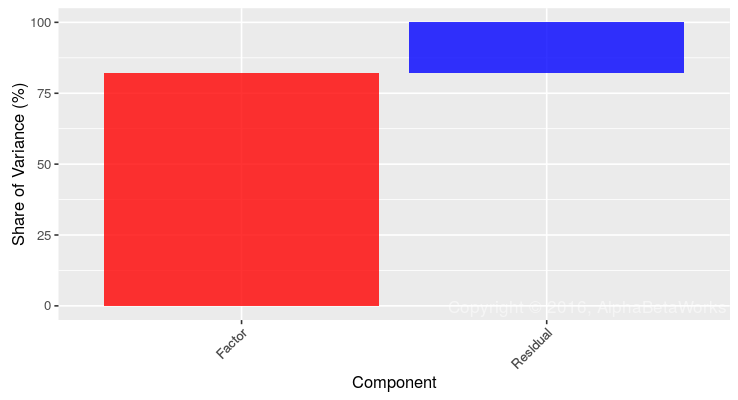
USSB Aggregate has approximately 1% estimated future volatility (tracking error) relative to the Market. Over 80% of this relative risk is due to factor exposures, or factor crowding. This high share of factor crowding is consistent with our earlier findings that the bulk of absolute and relative risk of most smart beta ETFs is due to traditional, or dumb, factors such as Market and Sectors:

Chart of the factor (systematic) and residual (idiosyncratic) components of U.S. smart beta crowding on 6/30/2017

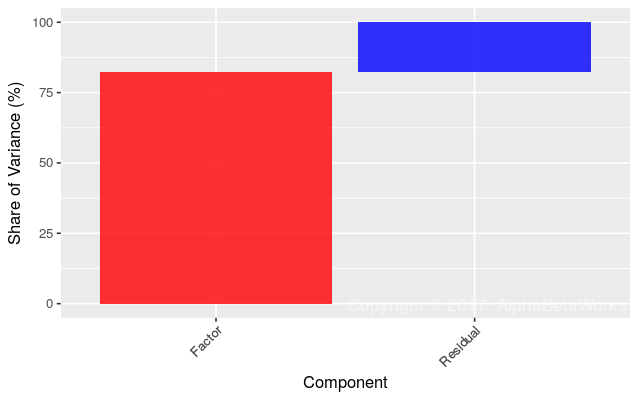
Components of U.S. Smart Beta Crowding in Q2 2017

Source Volatility (ann. %) Share of Variance (%)
Factor 0.84 82.45
Residual 0.39 17.55
Total 0.92 100.00

Given how close the aggregate smart beta ETF portfolio is to the Market, closet indexing is a concern, especially for diversified smart beta portfolios. The little active risk that remains is primarily due to the two dumb factor exposures discussed below.

U.S. Smart Beta Factor (Systematic) Crowding

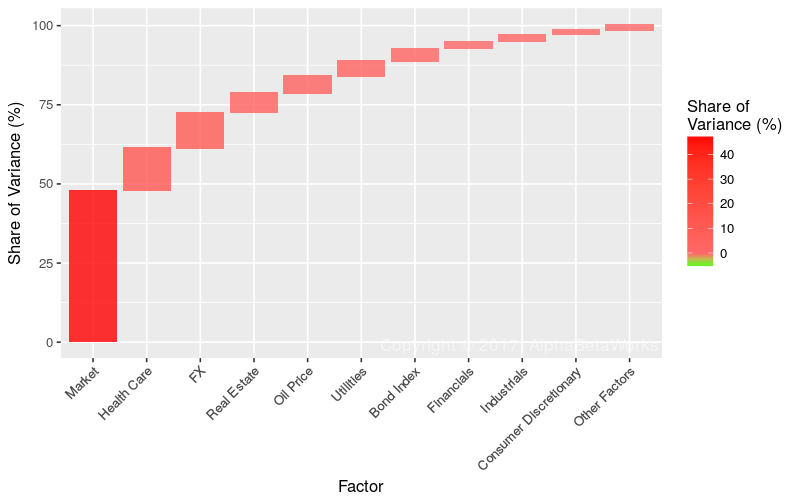
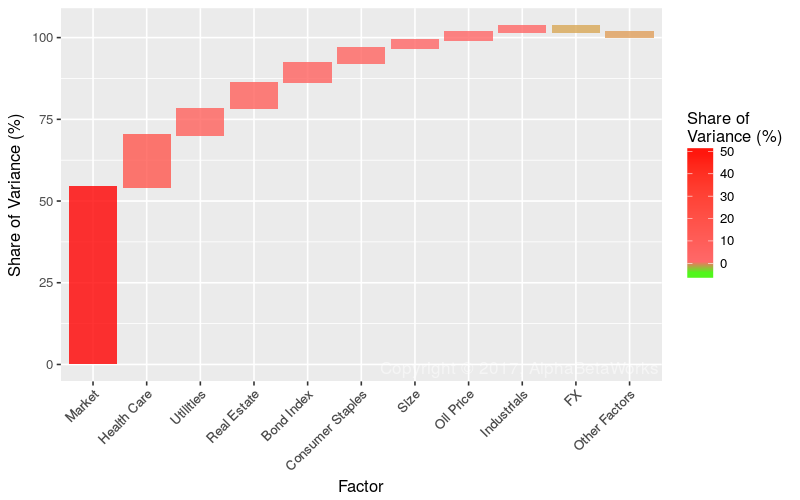
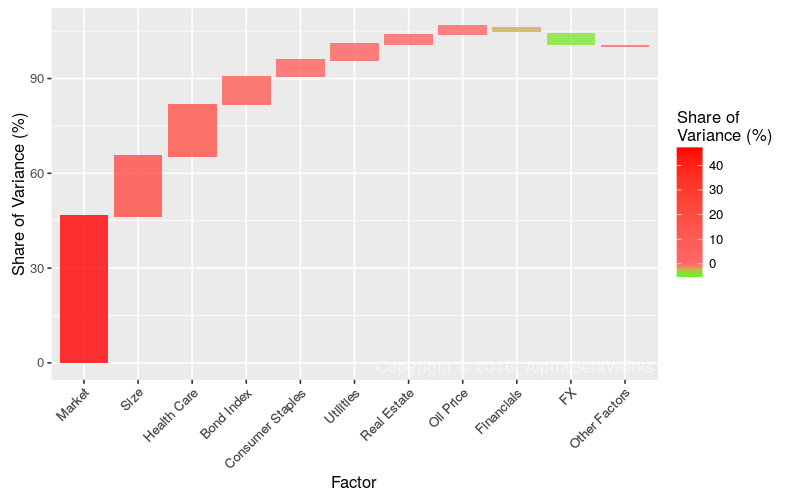
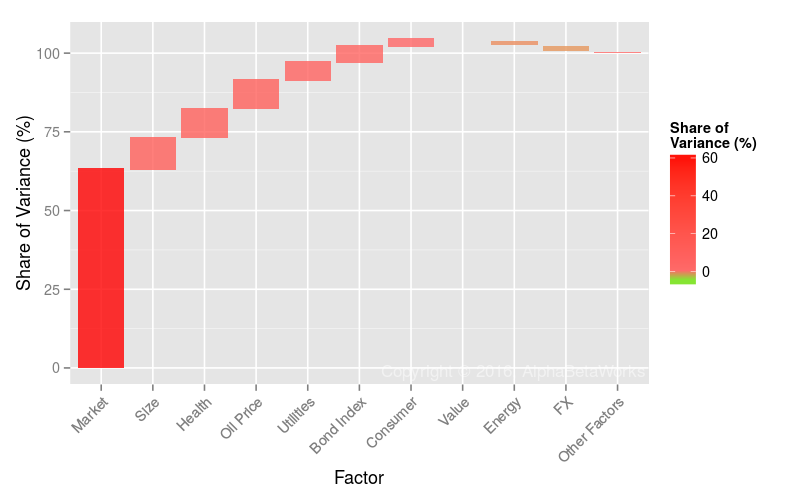
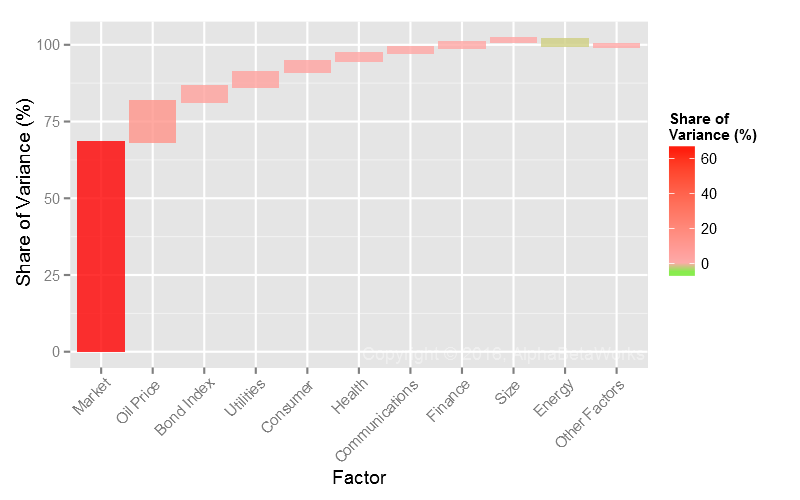
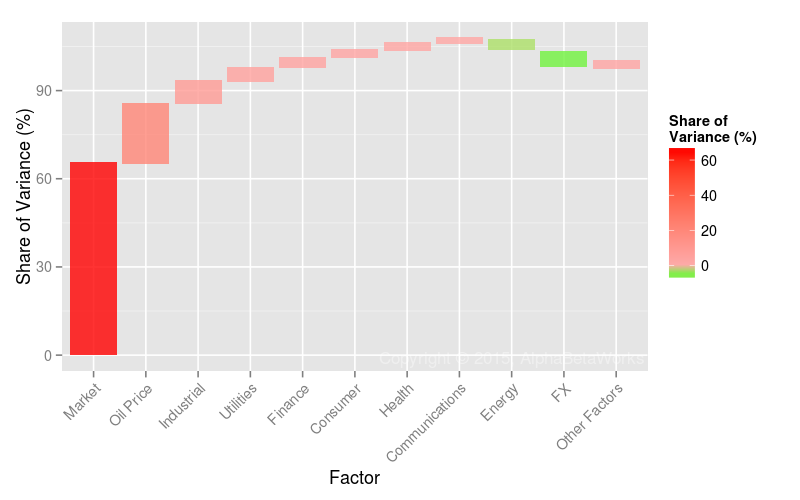
The following chart shows the main factor exposures of USSB Aggregate in red relative to U.S. Market’s exposures in gray:

Chart of the factor exposures contributing most to the factor variance of U.S. Smart Beta Aggregate relative to U.S. Market on 6/30/2017

Significant Absolute and Relative Factor Exposures of U.S. Smart Beta Aggregate in Q2 2017

The main active bet of the smart beta universe is short exposure to the Size Factor (overweighting of smaller companies). Thus, smart beta crowding is largely a bet against market-cap weighting and in favor of smaller companies. This crowded bet is the natural consequence of most modified-weighting schemes that de-emphasize larger companies.

Chart of the main contributions to the factor variance of U.S. Smart Beta Aggregate relative to U.S. Market on 6/30/2017

Factors Contributing Most to Relative Factor Variance of U.S. Smart Beta Aggregate in Q2 2017

Factor Relative Exposure Factor Volatility Share of Relative Factor Variance Share of Relative Total Variance
Size -5.58 9.62 42.83 35.31
Technology -6.85 6.39 40.74 33.59
Utilities 1.88 12.72 7.44 6.14
Energy 0.84 13.06 4.73 3.90
Real Estate 0.99 12.40 3.79 3.13
Industrials 1.22 4.72 2.67 2.20
FX 2.49 6.77 2.46 2.03
Materials 0.80 7.88 1.39 1.15
Financials -1.28 7.90 -1.70 -1.40
Value -1.08 15.20 -4.04 -3.33

(Relative exposures and relative variance contribution. All values are in %. Volatility is annualized.)

The short Size Factor smart beta crowding accounts for approximately twice the risk of stock-specific crowding. Consequently, smaller companies stand to lose, and larger companies stand to benefit, on average, from smart beta strategy outflows. The short (underweight) Technology bet is nearly as important.

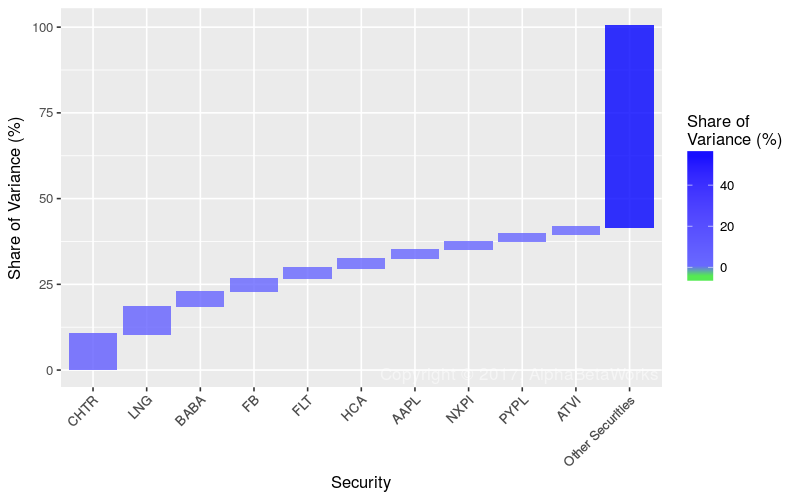
U.S. Smart Beta Residual (Idiosyncratic) Crowding

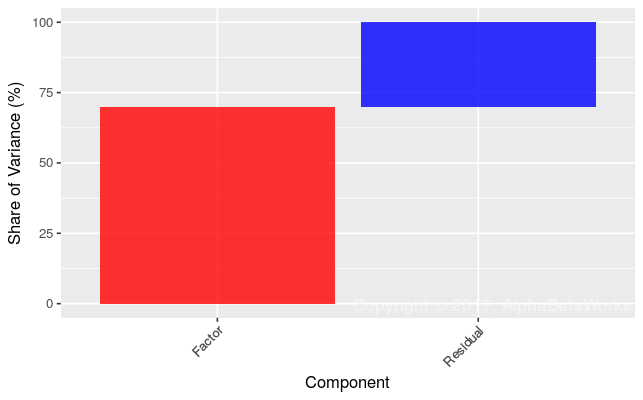
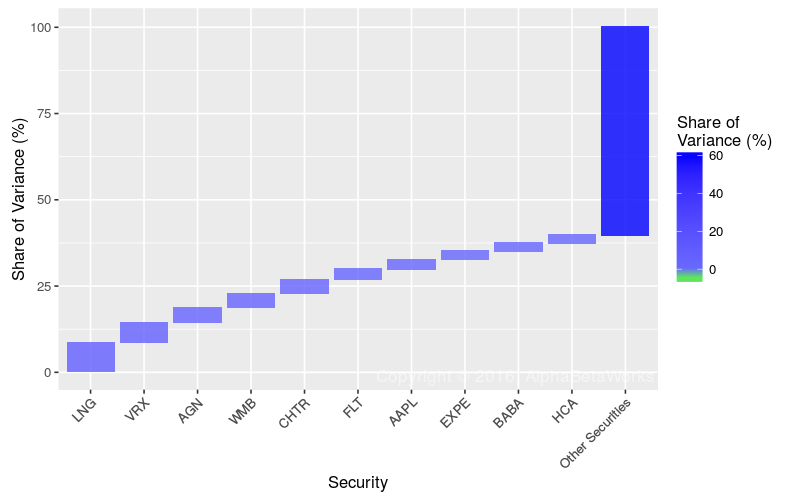
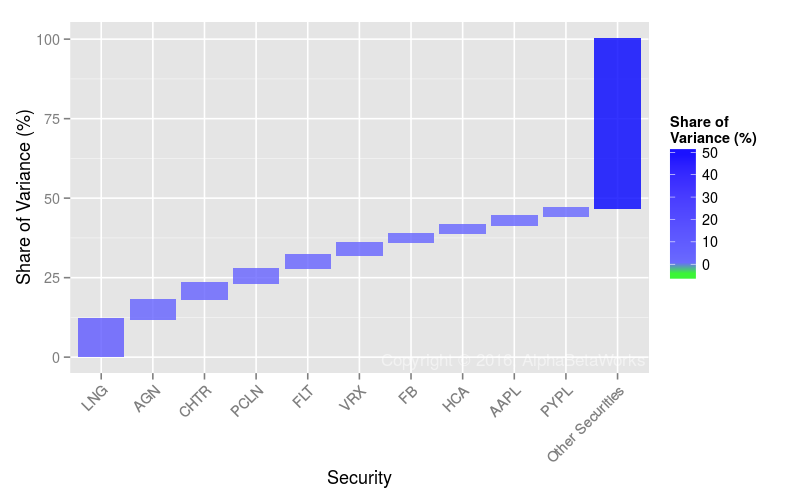
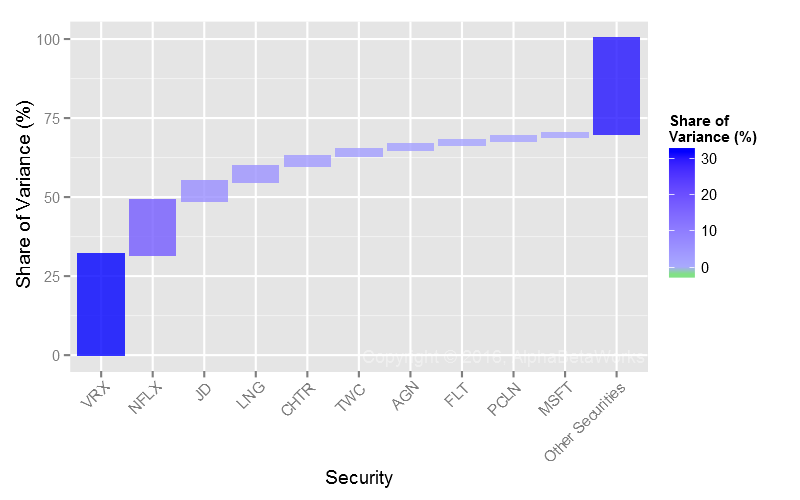
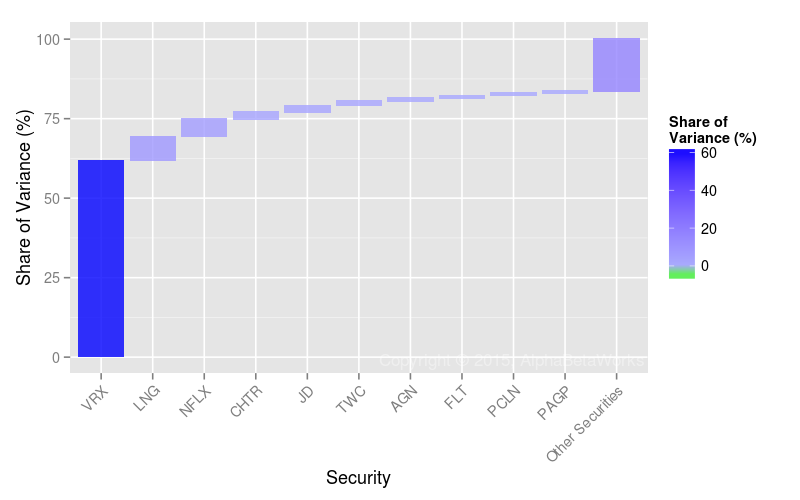
The remaining fifth of U.S. smart beta crowding as of 6/30/2017 was due to residual (idiosyncratic, stock-specific) risk:

Chart of the main contributors to the residual variance of U.S. Smart Beta Aggregate relative to U.S. Market on 6/30/2017

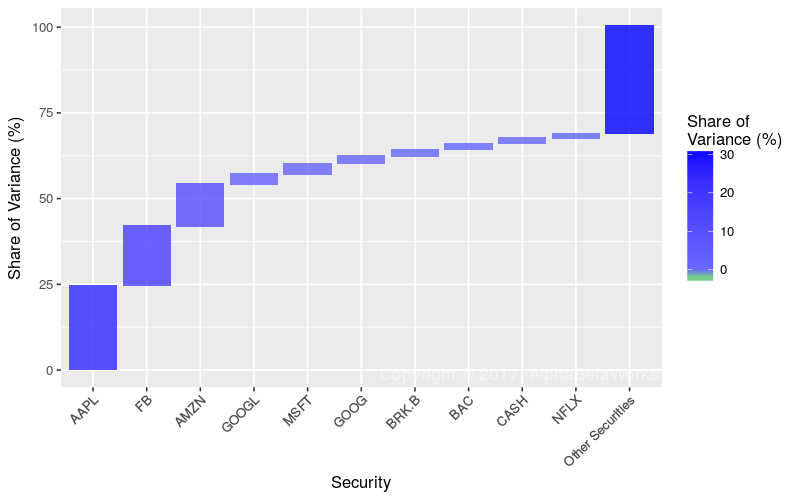
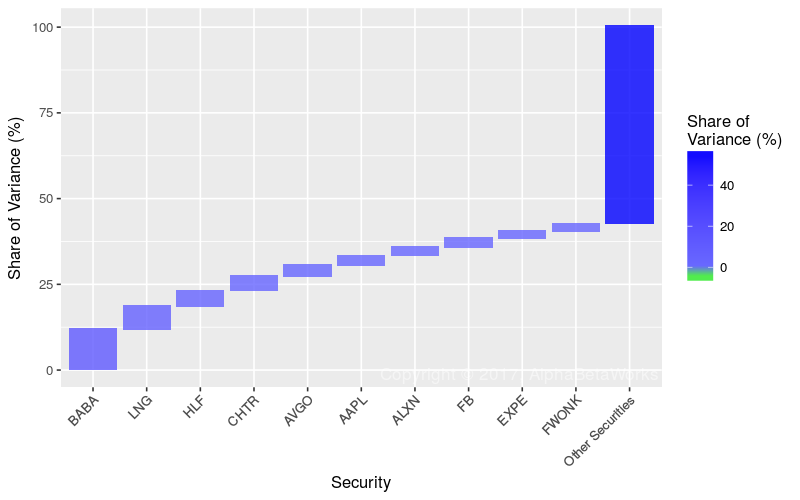
Stocks Contributing Most to Relative Residual Variance of U.S. Smart Beta Aggregate in Q2 2017

Symbol Name Relative Exposure Residual Volatility Share of Relative Residual Variance Share of Relative Total Variance
AAPL Apple Inc. -1.43 13.37 24.43 4.29
FB Facebook, Inc. A -0.67 24.17 17.39 3.05
AMZN Amazon.com, Inc. -0.74 18.23 12.17 2.13
GOOGL Alphabet Inc. A -0.52 12.83 3.04 0.53
MSFT Microsoft Corporation -0.56 11.78 2.96 0.52
GOOG Alphabet Inc. C -0.54 10.72 2.25 0.39
BRK.B Berkshire Hathaway B -0.69 7.55 1.82 0.32
BAC Bank of America Corporation -0.46 11.08 1.77 0.31
CASH Meta Financial Group 0.22 22.74 1.68 0.29
NFLX Netflix, Inc. -0.11 40.32 1.23 0.21

(Relative exposures and relative variance contribution. All values are in %. Volatility is annualized.)

The main source of residual U.S. smart beta crowding is short (underweight) exposure to AAPL, FB, AMZN, and GOOGL – the principal members of the FAANG club. The Strong performance of these stocks has been despite, rather than due to, flows into smart beta strategies. On a relative basis, FAANGs have suffered from smart beta asset inflows and, all else equal should outperform in the case of outflows from smart beta strategies.

Summary

  • Factor (systematic) exposures that capture risks shared by many stocks, rather than individual stocks, are responsible for over 80% of U.S. smart beta crowding.
  • The most crowded smart beta bet is short Size Factor exposure (overweighting of smaller companies). Thus, smaller companies stand to lose from smart beta strategy outflows.
  • The most crowded residual smart beta bet is short exposure to (underweighting of) FAANG stocks. Therefore, FAANG stocks should be relative beneficiaries of any smart beta outflows.
The information herein is not represented or warranted to be accurate, correct, complete or timely.
Past performance is no guarantee of future results.
Copyright © 2012-2017, AlphaBetaWorks, a division of Alpha Beta Analytics, LLC. All rights reserved.
Content may not be republished without express written consent.

Hedge Fund Crowding Update – Q2 2017

Whereas hedge fund crowding primarily consists of systematic factor bets, most analysis of hedge fund crowding focuses solely on popular positions. Moreover, such analysis usually assumes that hedge fund crowding in individual stocks is a bullish indicator. This article illustrates the flaws of these common assumptions, identifies the principal sources of hedge fund crowding, and discusses the opportunities that this crowding presents:

  • Factor (systematic) exposures, rather than individual stocks, account for 70% of the crowding.
  • Residual (idiosyncratic, or stock-specific) bets account for just 30% of hedge fund crowding.
  • Simplistic analysis of crowding in individual stocks overlooks the majority of crowding risk.
  • Crowded hedge fund factor bets have been experiencing steep losses since 2015 and have been attractive shorts.
  • Crowded hedge fund stock-specific bets have been attractive longs following the 2014-2015 liquidations and the subsequent recovery, but the trend appears to have ended.

Identifying Hedge Fund Crowding

The analysis of hedge fund crowding in this article follows the approach of our earlier studies: We started with a decade of hedge fund Form 13F filings. Form 13F discloses positions of firms with long U.S. assets over $100 million. We only considered funds with a sufficiently low turnover to be analyzable from filings, and our database is free of survivorship bias. This sample included approximately 1,000 firms. We combined all portfolios into a single position-weighted portfolio – HF Aggregate. We then used the AlphaBetaWorks (ABW) Statistical Equity Risk Model an effective predictor of future risk – to analyze HF Aggregate’s risk relative to the U.S. Market (represented by the iShares Russell 3000 ETF (IWV) benchmark), identify the crowded exposures, and analyze their performance trends.

Factor and Residual Components of Hedge Fund Crowding

Virtually all of HF Aggregate’s absolute risk is systematic. Thus, the aggregate long U.S. equity holdings of hedge funds will very nearly track a passive factor portfolio with similar risk:

Chart of the factor (systematic) and residual (idiosyncratic) components of absolute U.S. long equity hedge fund crowding on 6/30/2017

Components of U.S. Hedge Fund Aggregate’s Absolute Risk in Q2 2017

Source Volatility (ann. %) Share of Variance (%)
Factor 11.80 97.78
Residual 1.78 2.22
Total 11.93 100.00

HF Aggregate has 2.8% estimated future volatility (tracking error) relative to the Market. Approximately 70% of this relative risk is due to factor crowding:

Chart of the factor (systematic) and residual (idiosyncratic) components of U.S. long equity hedge fund crowding relative to the Market on 6/30/2017

Components of U.S. Hedge Fund Aggregate’s Relative Risk in Q2 2017

Source Volatility (ann. %) Share of Variance (%)
Factor 2.37 69.90
Residual 1.55 30.10
Total 2.83 100.00

Consequently, simplistic analysis of hedge fund crowding that focuses on the popular holdings and position overlap is fatally flawed. It will capture less than a third of the crowding risk that is stock-specific and will overlook the bulk that is systematic.

Stock Picking and Market Timing Returns from Crowding

Crowded factor and residual bets go through cycles of outperformance and underperformance, depending on capital flows. These trends can provide attractive investment opportunities: short during liquidation, and long during expansion.

The following chart shows HF Aggregate’s cumulative βReturn (risk-adjusted returns from factor timing). Crowded hedge fund factor bets have experienced steep and accelerating losses since 2015. We identified these factors in earlier research as attractive short candidates, and the downtrend has persisted:

Chart of the cumulative risk-adjusted return from factor timing (variation in factor exposures) of the U.S. Hedge Fund Aggregate portfolio

Historical Risk-Adjusted Return from Factor Timing of U.S. Hedge Fund Aggregate

The following chart shows HF Aggregate’s cumulative αReturn (risk-adjusted returns from security selection). Following the unprecedented losses on crowded residual bets during 2011-2015, we advised long exposures to these beaten-down stocks in late-2015. The subsequent recovery has been spectacular but now appears over. Thus, the crowded hedge fund residual bets no longer seem to offer clear long or short opportunities:

Chart of the cumulative risk-adjusted return from security selection (stock picking) of the U.S. Hedge Fund Aggregate portfolio

Historical Risk-Adjusted Return from Security Selection of U.S. Hedge Fund Aggregate

The rest of this article considers the crowded factor and residual bets responsible for the above trends.

Hedge Fund Factor (Systematic) Crowding

The following chart shows the main sources of hedge fund factor crowding as of 6/30/2017 in red relative to U.S. Market’s exposures in gray:

Chart of the factor exposures contributing most to the factor variance of U.S. Hedge Fund Aggregate Portfolio relative to U.S. Market on 6/30/2017

Significant Absolute and Relative Factor Exposures of U.S. Hedge Fund Aggregate in Q2 2017

The dominant hedge fund long equity bet is Market (high Beta). Thus, the most crowded bet is high overall market risk, rather than a specific stock. Like a leveraged ETF, HF Aggregate outperforms when the Market is up and underperforms when it is down.

Chart of the main contributions to the factor variance of U.S. Hedge Fund Aggregate Portfolio relative to U.S. Market on 6/30/2017

Factors Contributing Most to Relative Factor Variance of U.S. Hedge Fund Aggregate in Q2 2017

Factor Relative Exposure Factor Volatility Share of Relative Factor Variance Share of Relative Total Variance
Market 14.05 9.80 47.63 33.29
Health Care 8.72 7.75 13.41 9.37
FX -8.49 6.77 11.35 7.93
Real Estate -2.54 12.40 6.11 4.27
Oil Price 1.11 29.50 5.30 3.71
Utilities -3.17 12.72 4.89 3.42
Bond Index -8.12 3.41 3.86 2.70
Financials -5.29 7.90 2.23 1.56
Industrials -4.15 4.72 2.17 1.51
Consumer Discretionary 8.11 4.31 1.51 1.06

(Relative exposures and relative variance contribution. All values are in %. Volatility is annualized.)

In fact, crowding in the simple Market Factor alone accounts for more risk than all the stock-specific crowding combined.

Despite recent losses, HF Aggregate’s Health Care Factor exposure remains near the recent record levels.

Hedge Fund Residual (Idiosyncratic) Crowding

The remaining 30% of hedge fund crowding as of 6/30/2017 was due to residual (idiosyncratic, stock-specific) risk:

Chart of the main contributors to the residual variance of U.S. Hedge Fund Aggregate Portfolio relative to U.S. Market on 6/30/2017

Stocks Contributing Most to Relative Residual Variance of U.S. Hedge Fund Aggregate in Q2 2017

Symbol Name Relative Exposure Residual Volatility Share of Relative Residual Variance Share of Relative Total Variance
BABA Alibaba Group Holding ADR 2.23 23.93 11.82 3.56
LNG Cheniere Energy, Inc. 1.44 27.51 6.54 1.97
HLF Herbalife Ltd. 0.92 36.18 4.59 1.38
CHTR Charter Communications, Inc. 1.66 19.10 4.15 1.25
AVGO Broadcom Limited 1.32 21.20 3.24 0.98
AAPL Apple Inc. -1.96 13.37 2.84 0.86
ALXN Alexion Pharmaceuticals, Inc. 0.85 29.14 2.52 0.76
FB Facebook, Inc. Class A 1.01 24.17 2.47 0.74
EXPE Expedia, Inc. 1.08 21.31 2.21 0.66
FWONK Liberty Media Corporation Formula One 0.91 24.90 2.11 0.64

(Relative exposures and relative variance contribution. All values are in %. Volatility is annualized.)

Following the 2011-2015 losses and the subsequent gains, these crowded bets do not offer clear long or short opportunities. Moreover, residual crowding accounts for a small fraction of the industry’s risk. While systematic hedge fund crowding continues to dominate, investors and allocators should focus on managing the crowded factor exposures. Without a firm grasp of factor crowding, investors and fund followers may blindly follow losing bets.

Summary

  • Factor (systematic) exposures that capture risks shared by many stocks, rather than individual stocks, are responsible for the majority of hedge fund crowding.
  • The main sources of Q2 2017 hedge fund crowding were long U.S. Market (high Beta), long Health Care, and short USD (preference for exporters over importers).
  • The crowded factor bets have been in a multi-year bearish trend.
  • The crowded residual bets have recovered from steep losses and no longer offer clear opportunities.
  • Without a robust analysis of the factor and residual components of crowding, a hedge fund investor, follower, or allocator may be missing the bulk of crowding risk and investing in a generic passive factor portfolio.
The information herein is not represented or warranted to be accurate, correct, complete or timely.
Past performance is no guarantee of future results.
Copyright © 2012-2017, AlphaBetaWorks, a division of Alpha Beta Analytics, LLC. All rights reserved.
Content may not be republished without express written consent.


Hedge Fund Crowding Update – Q1 2017

A typical analysis of hedge fund crowding considers large, popular, and concentrated hedge fund long equity holdings. Such analysis usually assumes that crowding comes from stock-specific bets and that it is a bullish indicator. These assumptions are incorrect and have cost investors dearly:

  • Residual, idiosyncratic, or stock-specific bets now account for less than a third of hedge fund crowding. Factor (systematic) risk, rather than the risk from individual stocks, is driving hedge funds’ active returns. Consequently, simplistic analysis of hedge fund crowding that focuses on specific stocks misses the bulk of funds’ active risk and return.
  • The returns of crowded hedge fund factor and residual bets vary over time as the funds go through cycles of capital inflows and outflows. Consequently, generic analysis of hedge fund crowding can herd investors into losing bets on the wrong side of a cycle. For instance, depending on the trend, investors may desire long exposure to the crowded factor exposures in one year and short exposure in another.

This article reviews hedge fund long equity crowding at the end of Q1 2017. We identify the dominant systematic exposures and the top residual bets that will have the largest impact on investor performance. We also explore the current trends in returns from crowding that indicate profitable positioning.

Identifying Hedge Fund Crowding

This article follows the approach of our earlier studies of hedge fund crowding: We start with a survivorship-free database of SEC filings by over 1,000 U.S. hedge funds spanning over a decade. This database contains all funds that had ever filed 13F Reports (which disclose long U.S. assets over $100 million). We only consider funds with a sufficiently low turnover to be analyzable from filings. We combine all fund portfolios into a single position-weighted portfolio (HF Aggregate). The analysis of HF Aggregate’s risk relative to the U.S. Market reveals its active bets and the industry’s crowding. The AlphaBetaWorks (ABW) Statistical Equity Risk Model an effective predictor of future risk – identifies and quantifies the crowded exposures driving HF Aggregate’s performance.

Factor and Residual Components of Hedge Fund Crowding

The 3/31/2017 HF Aggregate had 2.6% estimated future volatility (tracking error) relative to the U.S. Market (represented by the iShares Russell 3000 ETF (IWV) benchmark). Approximately 30% of this was due to residual crowding, and approximately 70% was due to factor crowding:

Chart of the factor (systematic) and residual (idiosyncratic) components of US hedge fund crowding on 03/31/2017

Components of the Relative Risk for U.S. Hedge Fund Aggregate in Q1 2017

Source Volatility (ann. %) Share of Variance (%)
Factor 2.19 69.01
Residual 1.47 30.99
Total 2.64 100.00

Hedge fund crowding analysis that focuses on the popular holdings and position overlap thus captures less than a third of the total risk and overlooks over two-thirds of crowding that is due to factors – a fatal flaw. Since similar factor exposures can cause funds with no shared positions to correlate closely, a simplistic analysis of holdings and position overlap fosters dangerous complacency.

Stock Picking and Market Timing Returns from Crowding

A precise understanding of crowding is critical to investors and allocators since, depending on the capital flows, crowded bets can generate large and unexpected gains or losses.

The following chart shows cumulative βReturn (risk-adjusted returns from factor timing, or from the variation of factor exposures) of HF Aggregate. Crowded hedge fund factor bets have underperformed since 2011, and losses from hedge fund factor crowding have accelerated since 2015. The crowded factor bets below could have been attractive short candidates. In aggregate, hedge funds’ long equity portfolios would have made approximately 10% more since 2015 had they kept their factor exposures constant:

Chart of the cumulative risk-adjusted return from factor timing (variation in systematic exposures) due to U.S. long equity hedge fund crowding

Historical Risk-Adjusted Return from Factor Timing of U.S. Hedge Fund Aggregate

Crowded hedge fund residual bets have also underperformed since 2011. The following chart shows cumulative αReturn (risk-adjusted returns from security selection) of HF Aggregate. HF Aggregate experienced massive losses from security selection during 2011-2015. Given the unprecedented losses, we advised long exposures to the crowded residual bets in late-2015, and these have indeed recovered:

Chart of the cumulative risk-adjusted return from security selection (stock picking) due to U.S. long equity hedge fund crowding

Historical Risk-Adjusted Return from Security Selection of U.S. Hedge Fund Aggregate

We now turn to the specific crowded factor and residual bets behind the trends above.

Hedge Fund Factor (Systematic) Crowding

The following chart illustrates the main sources of factor crowding. HF Aggregate’s factor exposures are in red. The U.S. Market’s (defined as the iShares Russell 3000 ETF (IWV) benchmark) is in gray:

Chart of the factor exposures contributing most to the factor variance of U.S. Hedge Fund Aggregate Portfolio relative to U.S. Market on 03/31/2017

Significant Absolute and Residual Factor Exposures of U.S. Hedge Fund Aggregate in Q1 2017

The dominant bet of hedge funds’ long equity portfolios is Market (high Beta). The most crowded hedge fund bet is thus not a particular stock, but high overall market risk. HF Aggregate partially behaves like a leveraged market ETF, outperforming during bullish regimes and underperforming during bearish ones.

Chart of the main factors and their cumulative contribution to the factor variance of U.S. Hedge Fund Aggregate Portfolio relative to U.S. Market on 03/31/2017

Factors Contributing Most to Relative Factor Variance of U.S. Hedge Fund Aggregate in Q1 2017

Factor Relative Exposure Factor Volatility Share of Relative Factor Variance Share of Relative Total Variance
Market 13.25 10.67 54.00 37.26
Health Care 8.55 7.62 15.93 10.99
Utilities -3.05 12.86 8.16 5.63
Real Estate -2.69 12.87 7.91 5.46
Bond Index -7.33 3.59 6.02 4.15
Consumer Staples -5.04 8.04 4.64 3.20
Size -2.02 9.35 2.45 1.69
Oil Price 0.53 30.36 2.38 1.64
Industrials -4.28 4.96 1.85 1.27
FX 2.59 6.77 -1.83 -1.26

(Relative exposures and relative variance contribution. All values are in %. Volatility is annualized.)

Crowding into a single factor (Market) accounts for more hedge fund risk than all their stock-specific and other factor bets combined. The three top sector bets are long Health Care, short Utilities, and short Real Estate.

HF Aggregate’s exposures to Market, Health Care, and Bond Factors remained near record levels reached recently.

Hedge Fund Residual (Idiosyncratic) Crowding

The remaining third of hedge fund crowding as of 3/31/2017 was due to residual (idiosyncratic, stock-specific) risk:

Chart of the main stock-specific bets and their cumulative contribution to the residual variance of U.S. Hedge Fund Aggregate Portfolio relative to U.S. Market on 03/31/2017

Stocks Contributing Most to Relative Residual Variance of U.S. Hedge Fund Aggregate in Q1 2017

Symbol Name Relative Exposure Residual Volatility Share of Relative Residual Variance Share of Relative Total Variance
CHTR Charter Communications, Inc. Class A 2.53 18.64 10.31 3.19
LNG Cheniere Energy, Inc. 1.41 29.37 7.96 2.47
BABA Alibaba Group Holding Ltd. Sponsored ADR 1.17 26.26 4.40 1.36
FB Facebook, Inc. Class A 1.02 28.05 3.76 1.17
FLT FleetCor Technologies, Inc. 1.19 22.02 3.19 0.99
HCA HCA Holdings, Inc. 1.12 21.36 2.66 0.82
AAPL Apple Inc. -1.72 13.87 2.63 0.81
NXPI NXP Semiconductors NV 0.78 28.62 2.31 0.71
PYPL PayPal Holdings Inc 1.26 17.48 2.26 0.70
ATVI Activision Blizzard, Inc. 0.98 21.53 2.05 0.64

(Relative exposures and relative variance contribution. All values are in %. Volatility is annualized.)

While systematic hedge fund crowding continues to dominate, investors and allocators should focus on the factor exposures. Without a firm grasp of factor crowding, allocators to a supposedly diversified hedge fund portfolio may be paying high active management fees for what is effectively a leveraged ETF book. Also, investors and fund followers may blindly follow losing factor bets.

Nevertheless, residual hedge fund crowding can be a profitable long and short indicator. The 25% decline in 2010-2015 was followed by a 15% gain.

Summary

  • Factor (systematic) exposures and risks shared across stocks, rather than individual positions, are the primary drivers of hedge fund industry’s long equity risk.
  • The main sources of Q1 2017 hedge fund crowding were long U.S. Market (high Beta), long Health Care, short Utilities, and short Real Estate Factor exposures.
  • Without a robust analysis of factor and residual crowding, a hedge fund investor, follower, or allocator may be investing in a generic passive factor portfolio, likely with leverage.
  • The crowded factor bets have been in a bearish trend and may represent attractive short candidates.
  • The crowded residual bets have been recovering from steep losses and may continue to represent attractive long candidates, though less so than in 2016.
The information herein is not represented or warranted to be accurate, correct, complete or timely.
Past performance is no guarantee of future results.
Copyright © 2012-2017, AlphaBetaWorks, a division of Alpha Beta Analytics, LLC. All rights reserved.
Content may not be republished without express written consent.

Hedge Fund Crowding Update – Q4 2016

A typical analysis of hedge fund crowding surveys popular equity holdings. Yet, such residual, idiosyncratic, or stock-specific bets account for only 31% of current hedge fund crowding. Factor (systematic) risk, rather than a few specific stocks, is driving absolute and relative returns. Consequently, most analysis of hedge fund crowding focuses on a small fraction of crowding, missing its bulk.

Nearly 70% of the hedge fund industry’s long equity risk comes from factor crowding. Market exposure (high Beta) constitutes half of that – more than all the remaining factor bets and more than all the stock-specific bets combined. Since the consensus factor exposures can be obtained cheaply via ETFs and do not warrant the same compensation as idiosyncratic insights, it is vital for investors and allocators to understand and manage these crowded exposures. In addition, crowded factor bets are vulnerable to damaging liquidations.  This article reviews hedge fund long equity bets at the end of 2016 and focuses on the dominant systematic exposures that will have the largest impact on investor performance.

Identifying Hedge Fund Crowding

This article follows the approach of our earlier studies of hedge fund crowding: We started with a 10-year survivorship-free database of SEC filings by over 1,000 U.S. hedge funds. This database contains all funds that had long U.S. assets in excess of $100 million and sufficiently low turnover to be analyzable from their filings. We then combined all fund portfolios into a single position-weighted portfolio (HF Aggregate). The analysis of HF Aggregate’s risk relative to the U.S. Market revealed its main active bets. The AlphaBetaWorks (ABW) Statistical Equity Risk Model an effective predictor of future risk – identified and quantified these crowded exposures driving HF Aggregate’s performance.

Hedge Fund Industry’s Risk

The 12/31/2016 HF Aggregate had 2.7% estimated future volatility (tracking error) relative to the U.S. Market. Approximately a third of this tracking error was due to residual crowding, and the remaining two thirds  was due to factor crowding:

Chart of the factor (systematic) and residual (idiosyncratic) components of the U.S. Hedge Fund Aggregate’s variance relative to U.S. Market on 12/31/2016

Components of the Relative Risk for U.S. Hedge Fund Aggregate in Q4 2016

Source

Volatility (ann. %)

Share of Variance (%)

Factor

2.25

68.89

Residual

1.51

31.11

Total

2.71

100.00

The low 1.5% residual volatility, less than a third of the total, illustrates the challenges of hedge fund crowding analysis that focuses on the popular holdings and position overlap. Such stock-specific view overlooks the two thirds of crowding that is due to factors – a fatal flaw. As a result, simplistic analysis of popular holdings and of position overlap fosters dangerous complacency when funds with no shared positions correlate highly due to similar factor exposures.

Hedge Fund Factor (Systematic) Crowding

The following chart illustrates the main sources of factor risk. HF Aggregate’s factor exposures are in red. The U.S. Market’s (defined as the iShares Russell 3000 ETF (IWV) Benchmark) is in gray:

Chart of the factor exposures contributing most to the factor variance of U.S. Hedge Fund Aggregate Portfolio relative to U.S. Market on 12/31/2016

Significant Absolute and Residual Factor Exposures of U.S. Hedge Fund Aggregate in Q4 2016

The dominant bet of hedge funds’ long equity portfolios is Market (high Beta). The most crowded hedge fund bet is thus not a particular stock, but high overall market risk. HF Aggregate thus partially behaves like a leveraged market ETF, outperforming during bullish regimes and underperforming during bearish ones.

Chart of the main factors and their cumulative contribution to the factor variance of U.S. Hedge Fund Aggregate Portfolio relative to U.S. Market on 12/31/2016

Factors Contributing Most to Relative Factor Variance of U.S. Hedge Fund Aggregate in Q4 2016

Factor Relative Exposure Factor Volatility Share of Relative Factor Variance Share of Relative Total Variance
Market 12.92 10.52 50.26 34.62
Health Care 10.14 7.61 19.26 13.26
Bond Index -9.71 3.59 7.32 5.04
Utilities -3.19 12.53 7.14 4.92
Real Estate -2.51 12.88 7.07 4.87
Industrials -5.00 4.96 3.09 2.13
Consumer Staples -4.97 7.75 2.27 1.56
Oil Price 0.56 30.34 2.27 1.56
FX -1.12 6.87 1.02 0.70
Financials -2.38 7.71 -0.83 -0.57

(Relative exposures and relative variance contribution. All values are in %. Volatility is annualized.)

Hedge funds’ Market Factor crowding accounts for more risk than all their stock-specific bets combined. This dominance of a single systematic risk illustrates how asset managers’ and allocators’ endurance increasingly depends on their grasp of systematic crowding. It also illustrates the dangers of fixation on individual holdings.

HF Aggregate’s exposures to Market, Health Care, and Bond Factors remained near record levels reached recently. We analyze these in their order of importance below.

Hedge Fund U.S. Market Factor (Beta) Crowding

Hedge Fund Aggregates’ U.S. Market exposure decreased slightly from the mid-2016 record level:

Chart of the historical exposure of U.S. Hedge Fund Aggregate’s to the U.S. Equity Market Factor through 12/31/2016

U.S. Hedge Fund Aggregate’s U.S. Market Factor Exposure History

Even following this decrease in risk, the average dollar of hedge fund long U.S. equity capital carries approximately 20% more market risk than S&P 500. Thus, hedge fund portfolios move in concert with the market, but with heightened sensitivity to it. Consequently, simple comparison of hedge fund returns to broad equity benchmarks and identification of nominal outperformance with alpha remain dangerous. Further, simple equation of capital invested in (dollar exposures to) a market or sector with actual portfolio risk remains flawed.

Hedge Fund Health Care Crowding

Hedge Fund Aggregates’ Health Care exposure also decreased sharply from its 2016 record:

Chart of the historical exposure of U.S. Hedge Fund Aggregate’s to the U.S. Health Care Sector Factor through 12/31/2016

U.S. Hedge Fund Aggregate’s U.S. Health Care Factor Exposure History

Even after this decrease, HF Aggregate continues to carry almost twice the Health Care exposure of the Market. The Health Care Factor remains the second most significant hedge fund long equity bet.

Hedge Fund Short Bonds/Long Interest Rates Factor Crowding
HF Aggregate’s Short Bonds/Long Interest Rates Factor exposure was profitable in late-2016. This exposure decreased by half in the second half of the year, following the election catalyst:

Chart of the historical exposure of U.S. Hedge Fund Aggregate’s to the U.S. Long Bonds/Short Interest Rates Factor through 12/31/2016

U.S. Hedge Fund Aggregate’s U.S. Long Bonds/Short Interest Rates Factor Exposure History

Short bond exposure is a natural consequence of hedge funds’ interest in “cheap call options”, often highly financially leveraged companies with asymmetric profit and loss potential. We discussed the fundamental sources of this Bonds/Interest Rates Factor exposure in more detail in a prior article.

Hedge Fund Residual (Idiosyncratic) Crowding

The remaining third of hedge fund crowding on 12/31/2016 was due to residual (idiosyncratic, stock-specific) risk. Though this is a minor component of the total crowding, we survey it for completeness and to facilitate comparisons with the basic surveys of crowding found elsewhere:

Chart of the main stock-specific bets and their cumulative contribution to the residual variance of U.S. Hedge Fund Aggregate Portfolio relative to U.S. Market on 12/31/2016

Stocks Contributing Most to Relative Residual Variance of U.S. Hedge Fund Aggregate in Q4 2016

Symbol Name Relative Exposure Residual Volatility Share of Relative Residual Variance Share of Relative Total Variance
CHTR Charter Communications, Inc. 2.62 19.03 10.87 3.38
LNG Cheniere Energy, Inc. 1.40 29.27 7.29 2.27
FLT FleetCor Technologies, Inc. 1.27 23.17 3.80 1.18
AGN Allergan plc 1.44 18.31 3.05 0.95
AAPL Apple Inc. -1.85 13.81 2.86 0.89
FB Facebook, Inc. Class A 0.91 27.00 2.63 0.82
BABA Alibaba Group Holding Ltd. ADR 1.02 23.23 2.47 0.77
HCA HCA Holdings, Inc. 1.09 21.27 2.34 0.73
HUM Humana Inc. 1.05 21.88 2.29 0.71
WMB Williams Companies, Inc. 0.83 25.52 1.94 0.60

(Relative exposures and relative variance contribution. All values are in %. Volatility is annualized.)

Though these exposures are sensitive to asset flows, they generally constitute minor risks within the crowded portfolios. While systematic hedge fund crowding continues to dominate, investors and allocators should focus on the factor exposures. Without a firm grasp of factor crowding, a supposedly diversified hedge fund portfolio may be charging high active management fees for what is effectively a leveraged ETF book.

Summary

  • Factor (systematic) exposures and risks shared across stocks, rather than individual positions, are driving hedge fund industry’s long equity risk. Exposure to these crowded bets can be obtained much more cheaply via ETFs and other passive products.
  • The main sources of Q4 2016 hedge fund crowding were long U.S. Market (high Beta), long Health Care, and short Bonds/long Interest Rates Factor exposures.
  • Without a robust analysis of factor and residual crowding, a hedge fund investor, follower, or allocator may be investing in a generic passive factor portfolio, likely with leverage.
The information herein is not represented or warranted to be accurate, correct, complete or timely.
Past performance is no guarantee of future results.
Copyright © 2012-2017, AlphaBetaWorks, a division of Alpha Beta Analytics, LLC. All rights reserved.
Content may not be republished without express written consent.

Hedge Fund Crowding Update – Q3 2016

Whereas most analysis of hedge fund crowding focuses on individual stocks, over 85% of hedge funds’ recent long equity variance has been due to their factor (systematic) risk. Residual, idiosyncratic, or stock-specific bets accounted for less than 15%. Thus, factor crowding has dominated hedge fund industry’s absolute and relative returns. This article reviews the most crowded hedge fund long equity bets at 9/30/2016.

Understanding and quantifying this factor crowding is vital for hedge fund investors and allocators: Factor exposures that are shared by the entire hedge fund industry and that can be obtained cheaply with passive funds do not warrant the same compensation as the distinctive insights of gifted managers. Even worse, crowded bets expose investors to damaging stampedes during liquidations.

Identifying Hedge Fund Crowding

This article’s approach follows our earlier studies of hedge fund crowding: We started with a 10-year survivorship-free dataset of SEC filings by over 1,000 hedge funds. We then created a position-weighted portfolio (HF Aggregate) comprising all hedge fund long U.S. equity portfolios that can examined using the filings. We analyzed HF Aggregate’s risk and its historical exposures relative to the U.S. Market. The top contributors to hedge fund industry’s relative risk are the industry’s most crowded bets. Factor exposures were analyzed using the AlphaBetaWorks (ABW) Statistical Equity Risk Model an effective predictor of future risk.

Hedge Fund Industry’s Risk

The 9/30/2016 HF Aggregate had 3.9% estimated future volatility (tracking error) relative to the U.S. Market. Less than 20% of this risk came from individual stocks, or from stock-specific crowding; the remainder – more than 80% – came from factor (systematic) crowding:

Factor (systematic) and residual (idiosyncratic) components of the U.S. Hedge Fund Aggregate’s variance relative to U.S. Market on 9/30/2016

Components of the Relative Risk for U.S. Hedge Fund Aggregate in Q3 2016

Source Volatility (ann. %) Share of Variance (%)
Factor 3.50 82.19
Residual 1.63 17.81
Total 3.86 100.00

Since residual risk accounts for just 18% of the total, basic analysis of hedge fund crowding that examines popular holdings and position overlap is misguided. Such stock-specific analysis of crowding covers less than 20% of the industry’s risk, overlooking the dominant 80% of hedge fund crowding that is due to factors – a fatal flaw. Even funds with no shared positions correlate highly when they have similar factor exposures, so simplistic analysis of popular holdings and of position overlap understates portfolio risk and fosters complacency.

Hedge Fund Factor (Systematic) Crowding

Below are HF Aggregate’s principal factor exposures (in red). The U.S. Market, defined as the iShares Russell 3000 ETF (IWV) is the Benchmark (in gray). These factors are the primary sources of risk in the table above:

Chart of the factor exposures contributing most to the factor variance of U.S. Hedge Fund Aggregate Portfolio relative to U.S. Market on 9/30/2016

Significant Absolute and Residual Factor Exposures of U.S. Hedge Fund Aggregate in Q3 2016

The dominant bet of hedge funds’ long equity portfolios is Market (high Beta):

Chart of the main factors and their cumulative contribution to the factor variance of U.S. Hedge Fund Aggregate Portfolio relative to U.S. Market on 9/30/2016

Factors Contributing Most to Relative Factor Variance of U.S. Hedge Fund Aggregate in Q3 2016

Factor Relative Exposure Factor Volatility Share of Relative Factor Variance Share of Relative Total Variance
Market 20.65 10.59 46.19 37.97
Size -14.67 8.62 19.06 15.66
Health Care 12.68 7.54 16.22 13.33
Bond Index -19.34 3.37 8.94 7.35
Consumer Staples -7.87 7.24 5.28 4.34
Utilities -3.40 12.46 5.00 4.11
FX 10.70 6.80 -4.22 -3.47
Real Estate -1.86 12.80 2.97 2.44
Oil Price 1.03 30.15 2.75 2.26
Financials -4.84 7.05 -2.09 -1.72

(Relative exposures and relative variance contribution. All values are in %. Volatility is annualized.)

This high U.S. Market exposure alone is twice as influential as all the stock-specific bets combined. Given this importance of factor crowding compared to residual crowding, popular fascination with fund holdings and position overlap is especially dangerous. Asset managers’ and allocators’ endurance thus depends increasingly on their edge in assessing systematic crowding.

Hedge Fund Short Bonds/Long Interest Rates Factor Crowding

HF Aggregate’s exposures to Market, Size, and Health Factors were near their peak levels seen in recent quarters. In addition to these, their Short Bonds/Long Interest Rates Factor exposure has also recently reached historic extremes:

Chart of the historical exposure of U.S. Hedge Fund Aggregate’s to the U.S. Long Bonds/Short Interest Rates Factor

U.S. Hedge Fund Aggregate’s U.S. Long Bonds/Short Interest Rates Factor Exposure History

We discussed the fundamental sources of this Bonds/Interest Rates Factor exposure in a prior article. Short bond risk is a natural consequence of hedge funds’ fondness for financially leveraged companies, often viewed as “cheap call options.” A company’s indebtedness creates economic and statistically observable short bond exposure. Given the Q4 2016 moves in yields, this bet should prove profitable for the hedge fund industry.

Hedge Fund Residual (Idiosyncratic) Crowding

A fifth of hedge fund crowding on 9/30/2016 was due to residual (idiosyncratic, stock-specific) risk. The following stocks were the main contributors to residual hedge fund crowding:

Chart of the main stock-specific bets and their cumulative contribution to the residual variance of U.S. Hedge Fund Aggregate Portfolio relative to U.S. Market on 9/30/2016

Stocks Contributing Most to Relative Residual Variance of U.S. Hedge Fund Aggregate in Q3 2016

Symbol Name Relative Exposure Residual Volatility Share of Relative Residual Variance Share of Relative Total Variance
LNG Cheniere Energy, Inc. 1.63 28.94 8.43 1.50
VRX Valeant Pharmaceuticals International Inc 0.89 43.63 5.76 1.02
AGN Allergan plc 1.86 18.17 4.32 0.77
WMB Williams Companies, Inc. 1.28 25.87 4.12 0.73
CHTR Charter Communications, Inc. Class A 1.69 19.27 4.01 0.71
FLT FleetCor Technologies, Inc. 1.62 17.40 3.02 0.54
AAPL Apple Inc. -1.90 14.29 2.78 0.50
EXPE Expedia, Inc. 1.04 24.57 2.47 0.44
BABA Alibaba Group Holding Ltd. Sponsored ADR 1.07 23.61 2.43 0.43
HCA HCA Holdings, Inc. 1.10 21.96 2.22 0.40

(Relative exposures and relative variance contribution. All values are in %. Volatility is annualized.)

The importance of residual crowding diminished in recent quarters as factor crowding increased. Consequently, hedge fund stock-picking has faded in importance relative to market timing. The most crowded stocks are sensitive to asset flows in and out of the industry, but they are not the main threat to crowded portfolios. In the current environment of extreme systematic hedge fund crowding, investors and allocators should focus on the factor exposures. Without an accurate view of factor crowding, investors in a supposedly diversified hedge fund portfolio often end up paying high active fees for a passive factor portfolio.

Summary

  • At Q3 2016, over 80% of hedge fund industry’s relative long equity risk was due to factor, or systematic, crowding.
  • The main sources of Q3 2016 hedge fund crowding were high U.S. Market, short Size, long Health, and short Bonds/long Interest Rates Factor exposures.
  • Short Bonds/Long Interest Rates Factor exposure reached historic extremes.
  • Systematic exposures and risks shared across stocks, rather than individual positions, are driving 80% of the hedge fund industry’s long equity risk.
  • Only robust analysis of factor and residual crowding can determine whether a hedge fund investor, follower, or allocator is investing in exceptional insights or in a generic passive factor portfolio.
The information herein is not represented or warranted to be accurate, correct, complete or timely.
Past performance is no guarantee of future results.
Copyright © 2012-2016, AlphaBetaWorks, a division of Alpha Beta Analytics, LLC. All rights reserved.
Content may not be republished without express written consent.

Hedge Fund Crowding Update – Q2 2016

Typical analysis of hedge fund crowding focuses on individual stocks. This is misguided since over 85% of hedge funds’ monthly return variance is due to factor (systematic) exposures. Their residual, (idiosyncratic, or stock-specific) bets account for less than 15% of it. Likewise, factor crowding has driven much of the hedge fund industry’s performance and volatility. In Q2 2016, half of U.S. hedge funds’ long equity risk (tracking error) relative to the U.S. Market was due to a single crowded factor and two thirds was due to three crowded factors. This article reviews the most crowded bets at 6/30/2016 that have been driving hedge funds’ long equity performance.

Note that active risk is required to generate active returns and warrant management fees. Yet, not all exposures are created equal. Systematic exposures that are shared by the entire hedge fund industry and that can be obtained cheaply via index funds and ETFs do not warrant the same compensation as the distinctive insights of gifted managers. Even worse, these crowded bets expose investors to the damaging stampede of impatient capital.

Identifying Hedge Fund Crowding

We followed the approach of our earlier studies of hedge fund crowding: We processed regulatory filings of over 1,000 hedge funds and created a position-weighted portfolio (HF Aggregate) comprising all tractable hedge fund long U.S. equity portfolios. We then analyzed HF Aggregate’s risk relative to the U.S. Market. The most crowded bets are driving the hedge fund industry’s risk and performance. We identified these bets using the AlphaBetaWorks (ABW) Statistical Equity Risk Model – an effective system of forecasting future risk and performance.

Hedge Fund Industry’s Risk

HF Aggregate had 3.5% estimated future volatility (tracking error) relative to the U.S. Market in Q2 2016. Nearly 80% of this was due to its factor (systematic) exposures, rather than individual stocks:

Factor (systematic) and residual (idiosyncratic) components of the U.S. Hedge Fund Aggregate’s variance relative to U.S. Market on 6/30/2016

Components of the Relative Risk for U.S. Hedge Fund Aggregate in Q2 2016

Source Volatility (ann. %) Share of Variance (%)
Factor 3.12 77.84
Residual 1.67 22.16
Total 3.54 100.00

A typical analysis of hedge fund crowding that focuses on individual stocks and popular holdings is thus misguided. It dwells on only 20% of the industry’s risk, overlooking the other 80%. Funds with no shared positions can still correlate highly when they have similar factor exposures. Consequently, such a simplistic analysis of position overlap and holdings misrepresents fund risk risk and fosters dangerous complacency.

Hedge Fund Factor (Systematic) Crowding

Below are HF Aggregate’s principal factor exposures (in red) relative to the U.S. Market’s (in gray). These are the primary bets behind factor risk and crowding in the table above:

Chart of the factor exposures contributing most to the factor variance of U.S. Hedge Fund Aggregate Portfolio relative to U.S. Market on 6/30/2016

Significant Absolute and Residual Factor Exposures of U.S. Hedge Fund Aggregate in Q2 2016

Market (Beta) is the dominant long equity bet within the hedge fund industry. It accounts for approximately two thirds of relative factor risk and half of relative total risk:

Chart of the main factors and their cumulative contribution to the factor variance of U.S. Hedge Fund Aggregate Portfolio relative to U.S. Market on 6/30/2016

Factors Contributing Most to Relative Factor Variance of U.S. Hedge Fund Aggregate in Q2 2016

Factor Relative Exposure Factor Volatility Share of Relative Factor Variance Share of Relative Total Variance
Market 17.62 12.58 62.96 49.01
Size -9.39 8.46 10.00 7.78
Health 9.45 6.95 9.19 7.15
Oil Price 1.89 31.29 9.12 7.10
Utilities -3.74 12.42 5.71 4.44
Bond Index -7.90 3.55 5.01 3.90
Consumer -5.40 3.96 2.30 1.79
FX 2.18 7.30 -1.99 -1.55
Energy -2.30 13.44 -1.62 -1.26
Value -1.81 13.33 -0.53 -0.41

(Relative exposures and relative variance contribution. All values are in %. Volatility is annualized.)

The most crowded long equity bet is high systematic exposure to the U.S. Market – not any particular stock. In fact, high systematic market risk is more important to U.S. hedge fund long portfolios than all of their stock-specific bets combined. This makes the popular fascination with fund holdings and position overlap particularly dangerous. As factor crowding continues to dominate stock-specific risk and stock picking skill, the survival of asset managers and allocators increasingly relies on their grasp of systematic crowding and the predictive power of their risk management systems.

Hedge Fund U.S. Market Factor Crowding

The current Market Factor Exposure of HF Aggregate is approximately 115% (its Market Beta is approximately 1.15). This exposure has remained above 100% since 2012:

Chart of the historical exposure of U.S. Hedge Fund Aggregate’s to the U.S. Market Factor

U.S. Hedge Fund Aggregate’s U.S. Market Factor Exposure History

The average hedge fund long equity portfolio now carries approximately 15% more market risk than the Russell 3000 Index and approximately 20% more than the slightly less risky S&P 500 Index. This higher exposure illustrates the danger of evaluating them relative to broad benchmarks. In a year when S&P 500 returns 10%, the average hedge fund would need to return approximately 12% to match what investors would have earned by taking the same risk passively.

Hedge Fund U.S. Size Factor Crowding

The ABW Size Factor is the difference in returns, net of market and sector effects, between the largest and the smallest stocks. It is closely related to the Fama–French SMB Factor, but includes critical fixes: The ABW Size Factor strips out market and sector effects from security returns, revealing pure size risk. By contrast, SMB Factor captures size risk together with market beta and sector effects, since market exposure and sector composition differ between small- and large-cap stocks. This market and sector noise in the SMB Factor makes accurate risk estimation challenging and accurate performance attribution impossible.

Negative Size exposure corresponds to small-cap risk.  Hedge fund long equity portfolios currently have near-record small-cap exposure, equivalent to an approximately 10% bet on small company outperformance:

Chart of the historical exposure of U.S. Hedge Fund Aggregate’s to the U.S. Size Factor

U.S. Hedge Fund Aggregate’s U.S. Size Factor Exposure History

Hedge Fund U.S. Health Factor Crowding

Current hedge fund Heath Factor exposure remains near an all-time high:

Chart of the historical exposure of U.S. Hedge Fund Aggregate’s to the U.S. Health Factor

U.S. Hedge Fund Aggregate’s U.S. Size Health Factor Exposure History

Hedge Fund Residual (Idiosyncratic) Crowding

As of 6/30/2016, a quarter of hedge fund crowding was due to residual (idiosyncratic, stock-specific) risk. As factor crowding increased, residual crowding has diminished. Thus, stock-specific risk and stock-picking still have faded in importance:

Chart of the main stock-specific bets and their cumulative contribution to the residual variance of U.S. Hedge Fund Aggregate Portfolio relative to U.S. Market on 6/30/2016

Stocks Contributing Most to Relative Residual Variance of U.S. Hedge Fund Aggregate in Q2 2016

Symbol Name Relative Exposure Residual Volatility Share of Relative Residual Variance Share of Relative Total Variance
LNG Cheniere Energy 1.65 34.66 11.77 2.61
AGN Allergan plc 2.79 14.71 6.06 1.34
CHTR Charter Communications 1.84 20.58 5.16 1.14
PCLN Priceline Group 1.61 22.25 4.64 1.03
FLT FleetCor Technologies 1.74 19.87 4.29 0.95
VRX Valeant Pharmaceuticals 0.82 39.76 3.85 0.85
FB Facebook, Inc. Class A 0.89 31.39 2.84 0.63
HCA HCA Holdings 1.21 22.78 2.76 0.61
AAPL Apple Inc. -1.68 16.41 2.74 0.61
PYPL PayPal Holdings Inc 1.66 15.88 2.49 0.55

(Relative exposures and relative variance contribution. All values are in %. Volatility is annualized.)

The most crowded stocks continue to be sensitive to asset flows in and out of the industry. Yet, in the current environment of extreme systematic hedge fund crowding, allocators and fund followers should continue to pay more attention to factor risk. Indeed, allocators invested in a seemingly diversified portfolio of hedge funds may, in fact, be paying high active fees for a passive factor portfolio.

Summary

  • At Q2 2016, nearly 80% of hedge funds’ relative long equity risk was due to factor, or systematic, exposures.
  • The main source of Q2 2016 hedge fund crowding, responsible for half of long equity tracking error, was record U.S. Market exposure.
  • Short Size Factor (small-cap bias) and long Health Factor exposures were the next most crowded bets, both near their historic extremes.
  • Given high current hedge fund factor crowding, an analysis of aggregate and individual hedge funds must focus on systematic exposures and risk shared across positions, and not solely on individual positions.
  • Fund investors, followers, and allocators must monitor whether they are investing in exceptional insights or generic factor exposures otherwise available via cheap passive instruments.
The information herein is not represented or warranted to be accurate, correct, complete or timely.
Past performance is no guarantee of future results.
Copyright © 2012-2016, AlphaBetaWorks, a division of Alpha Beta Analytics, LLC. All rights reserved.
Content may not be republished without express written consent.

Hedge Fund Finance Sector Crowding

Asset outflows and portfolio liquidations have devastated crowded hedge fund bets since 2015. Losses have been especially severe in the Finance Sector. We survey hedge fund finance sector crowding and identify the stocks driving it. Investors and allocators must be vigilant: when capital flows out, these bets tend to suffer sharp losses. When capital flows in, they tend to benefit. We also provide an early indicator of this underperformance and outperformance.

Identifying Hedge Fund Finance Crowding

We created an aggregate position-weighted portfolio (Hedge Fund Finance Aggregate, or HF Finance Aggregate) consisting of finance sector equities held by all hedge fund long equity portfolios that are tractable from regulatory filings. The size of each position is the dollar value of its ownership by hedge funds. This process is similar to our earlier analyses of hedge fund crowding. We then evaluated HF Finance Aggregate’s risk relative to the capitalization-weighted portfolio of U.S. finance equities (Market Finance Aggregate) using an AlphaBetaWorks’ Statistical Equity Risk Model. Finally, we analyzed HF Finance Aggregate’s idiosyncratic bets and identified the most crowded ones.

Hedge Fund Finance Sector Performance

Over the past 10 years HF Finance Aggregate generated approximately the same return as a portfolio of index funds and ETFs with the same systematic (market) risk (Factor Portfolio):

Historical cumulative factor, security selection, and total returns of the Hedge Fund Finance Sector Aggregate through Q2 2016

Historical Factor and Total Return of the Hedge Fund Finance Sector Aggregate

Blue area represents positive and gray area represents negative risk-adjusted returns from security selection, net of factor effects. HF Finance Aggregate outperformed the Factor Portfolio between 2006 and 2013 and has underperformed since. A look at the security selection performance below illustrates the underlying cycles of performance.

Hedge Fund Finance Sector Security Selection

AlphaBetaWorks’ metric of security selection is αReturn – the performance a portfolio would have generated if markets had been flat. It is also the performance of a portfolio with its factor exposures hedged:

Historical cumulative security selection return of the Hedge Fund Finance Sector Aggregate through Q2 2016

Historical Return from Security Selection of Hedge Fund Finance Sector Aggregate

Hedge funds have enjoyed positive αReturn in the finance sector during calm market regimes. Throughout our test period, the only episode of security selection losses prior to 2014 was Q3 2008. It was followed by a sharp reversal starting in late-2008. The 2008-2010 security selection gains of HF Finance Aggregate illustrate how forced liquidation of 2008 ended with a mean-reversion: the biggest losers became attractive opportunities.

The cycles of asset inflows and liquidations are common to HF Sector Aggregates. Illustrations can be found in our previous pieces on hedge fund semiconductor crowding and hedge fund exploration and production crowding.

HF Finance Aggregate has been showing signs of liquidation since mid-2014. This was also the time when the overall HF Aggregate began to generate negative αReturns that eventually turned into a rout. Since 2014, hedge funds’ long finance picks underperformed by 15% on a risk-adjusted basis. Had the industry taken the same risks passively with ETFs, its long financials portfolio would have generated approximately 15% higher return.

Hedge Fund Residual (Idiosyncratic) Finance Sector Crowding

Hedge fund sector portfolios have a history of booms and busts. Their sharply negative αReturns usually signal liquidations. Consequently, identifying and avoiding crowded bets is vital during these periods. When a cycle eventually turns, the biggest losers can present attractive opportunities. The following stocks were recent top contributors to idiosyncratic (stock-specific) risk of HF Finance Aggregate – its most crowded stocks. Blue bars represent long (overweight) exposures relative to Market Finance Aggregate. White bars represent short (underweight) exposures. Bar height represents contribution to relative stock-specific risk:

Chart of the residual Hedge Fund Finance Sector Crowding: the main stock-specific bets and their cumulative contribution to the residual variance of Hedge Fund Finance Sector Aggregate Portfolio relative to Market on 6/30/2016

Stocks Contributing Most to U.S. Hedge Fund Finance Aggregate Relative Residual Risk in Q2 2014

The following table contains detailed data on the residual hedge fund finance sector crowding:

Exposure (%) Net Exposure Share of Risk (%)
HF Sector Aggr. Sector Aggr. % $mil Days of Trading
AIG American International Group, Inc. 7.98 1.49 6.49 3,651.8 6.6 13.33
HTZ Hertz Global Holdings, Inc. 2.51 0.11 2.40 1,350.1 10.3 13.32
EQIX Equinix, Inc. 4.20 0.56 3.64 2,048.5 10.0 10.95
JPM JPMorgan Chase \& Co. 0.80 5.31 -4.51 -2,536.9 -1.9 5.85
AER AerCap Holdings NV 2.24 0.19 2.05 1,154.8 8.4 5.71
CAR Avis Budget Group, Inc. 1.39 0.06 1.33 746.5 8.2 5.34
BAC Bank of America Corporation 0.66 3.40 -2.74 -1,543.8 -0.9 5.11
LPLA LPL Financial Holdings Inc. 1.62 0.05 1.56 879.1 38.4 3.60
CACC Credit Acceptance Corporation 1.32 0.09 1.23 693.5 22.3 2.84
CBG CBRE Group, Inc. Class A 1.76 0.24 1.52 856.0 8.9 2.00
WLTW Willis Towers Watson Public Limited Comp 2.46 0.40 2.06 1,161.3 8.0 1.73
IBKR Interactive Brokers Group, Inc. Class A 1.27 0.06 1.21 680.8 20.9 1.65
BK Bank of New York Mellon Corporation 3.60 0.97 2.63 1,481.9 5.1 1.58
MA MasterCard Incorporated Class A 4.29 2.51 1.78 1,002.7 0.9 1.56
ALLY Ally Financial Inc 1.84 0.22 1.62 911.9 4.1 1.41
WFC Wells Fargo & Company 2.43 5.97 -3.54 -1,994.8 -1.9 1.33
GLPI Gaming and Leisure Properties, Inc. 1.28 0.09 1.19 672.0 9.1 1.33
NSAM NorthStar Asset Management Corp 0.95 0.05 0.90 506.3 19.3 1.29
FNMA Federal National Mortgage Association 0.29 0.04 0.25 139.5 42.7 1.10
SPG Simon Property Group, Inc. 0.01 1.60 -1.59 -894.9 -2.0 0.89
Other Positions 0.64 18.06
Total 100.00

Long (overweight) exposures to AIG, HTZ, EQIX, and AER as well as short (underweight) exposure to JPM account for half of the stock-specific risk and volatility of hedge funds’ long financials books. The stock-specific losses of the crowded financials bets in 2015-2016 have been more severe than those in the 2008 crisis. Given this severity, when the cycle turns positive the crowded books are likely to outperform.

Analytics built on a robust risk model, such as the AlphaBetaWorks Statistical Equity Risk Model used here, offer leading indicators of portfolio liquidations and losses to crowding. These analytics provided portfolio managers and investors with warning signs as early as 2014, helping avoid losses, or even profit from herding. Since liquidations and crowding losses are routine, it is also vital that allocators identify undifferentiated managers.

Conclusions

  • Analysis of hedge fund crowding using robust risk models provides early signs of portfolio liquidations and opportunities.
  • Half of hedge fund residual (idiosyncratic, stock-specific) finance sector crowding comes from only five stocks.
  • Investors with robust data on hedge fund crowding and cycles of capital flow can reduce losses and profit from opportunities.
  • Allocators with robust data on hedge fund crowding can monitor manager differentiation and reduce losses.
The information herein is not represented or warranted to be accurate, correct, complete or timely.
Past performance is no guarantee of future results.
Copyright © 2012-2016, AlphaBetaWorks, a division of Alpha Beta Analytics, LLC. All rights reserved.
Content may not be republished without express written consent.

Hedge Fund Crowding Update – Q1 2016

Analyses of hedge fund crowding typically focus on hedge funds’ individual positions (their residual, idiosyncratic, or stock-specific exposures). Yet, over 85% of the monthly return variance for the majority of hedge fund long equity portfolios is due to their factor (systematic) exposures. Stock-specific bets account for less than 15%. Factor – rather than residual – crowding has driven much of the industry’s past exuberance and its recent grief. In Q1 2016, nearly half of U.S. hedge funds’ relative long equity risk (tracking error) was due to a single factor, U.S. Market Exposure. This piece surveys the crowded factor and residual exposures at 3/31/2016 that are likely to drive long equity performance for hedge funds in coming quarters.

Identifying Hedge Fund Crowding

This piece follows the approach of our earlier articles on crowding: We processed regulatory filings of over 1,000 hedge funds and created a position-weighted portfolio (HF Aggregate) consisting of all tractable hedge fund long U.S. equity portfolios. We then analyzed HF Aggregate’s risk relative to the U.S. Market using the AlphaBetaWorks Statistical Equity Risk Model – a proven system for performance forecasting. The most crowded hedge fund bets are factors and, to a lesser extent, stocks that drive HF Aggregate’s relative risk and performance. Ironically, these are rarely the largest or the most common hedge fund positions.

Hedge Fund Aggregate’s Risk

The Q1 2016 HF Aggregate had 3.4% estimated future tracking error relative to the U.S. Market. Factor (systematic) exposures accounted for over two thirds of it:

Factor (systematic) and residual (idiosyncratic) components of U.S. hedge fund crowding and U.S. Hedge Fund Aggregate’s variance relative to U.S. Market on 3/31/2016

Components of the Relative Risk for U.S. Hedge Fund Aggregate in Q1 2016

Source Volatility (ann. %) Share of Variance (%)
Factor 2.78 68.23
Residual 1.89 31.77
Total 3.36 100.00

A simplistic analysis of hedge fund crowding that focuses on individual positions will overlook systematic exposures. Yet, they are responsible for over two thirds of the hedge fund industry’s risk. Since funds with no shared positions but similar factor exposures will correlate highly, a simplistic crowding analysis that lacks a predictive risk model will misidentify such similar funds as differentiated. This will misrepresent their risk and can foster dangerous complacency.

Hedge Fund Factor (Systematic) Crowding

Below are the principal factor exposures (in red) relative to U.S. Market’s exposures (in gray) that are responsible for the factor crowding in the above table:

Chart of the factor exposures contributing most to the U.S. hedge fund crowding and factor variance of U.S. Hedge Fund Aggregate Portfolio relative to U.S. Market on 3/31/2016

Significant Absolute and Relative Factor Exposures of U.S. Hedge Fund Aggregate in Q1 2016

Of these exposures, Market (Beta) alone accounts for approximately two thirds of the relative and half of the total factor risk:

Chart of the main factors and their cumulative contribution to the factor variance of U.S. Hedge Fund Aggregate Portfolio relative to U.S. Market on 3/31/2016

Factors Contributing Most to Relative Factor Variance of U.S. Hedge Fund Aggregate in Q1 2016

Factor Relative Exposure Factor Volatility Share of Relative Factor Variance Share of Relative Total Variance
Market 15.46 12.67 64.54 44.04
Bond Index -21.46 3.32 18.23 12.44
Utilities -3.56 11.75 6.76 4.61
Consumer -9.07 3.97 4.74 3.23
Size -3.59 8.39 3.30 2.25
Health 3.44 7.29 2.48 1.69
Energy -2.50 13.17 -2.42 -1.65
Communications -1.17 12.02 1.82 1.24
Oil Price 0.18 30.91 0.99 0.68
Value -1.00 13.21 -0.74 -0.51

(Relative exposures and relative variance contribution. All values are in %. Volatility is annualized.)

The U.S. hedge fund industry’s most crowded bet is not a stock, or stocks, it is high systematic exposure to the U.S. Market. This makes the popular fascination with fund holdings and position overlap particularly dangerous. This factor crowding explains much of recent hedge fund misery. As large asset bases continue to diminish the importance of stock-specific risk, the survival of asset managers and allocators will increasingly rely on their analysis of systematic crowding with robust and predictive factor models.

Hedge Fund U.S. Market Factor Crowding

After working to refine our historical hedge fund portfolio database with particular attention to defunct firms and survivorship bias, we have an increasingly accurate picture of HF Aggregate’s historical factor exposures. Its current Market Factor Exposure is approximately 115% (i.e. the HF Aggregate’s Market Beta is approximately 1.15). The average hedge fund long equity portfolio now carries approximately 15% more Market Exposure than the Russell 3000 ETF and approximately 20% more Market Exposure than the S&P 500 ETF:

Chart of the historical exposure of U.S. Hedge Fund Aggregate’s to the U.S. Market Factor

U.S. Hedge Fund Aggregate’s U.S. Market Factor Exposure History

This Market crowding has been costly and disruptive during the recent volatility. It also partially explains the failures of simple performance and skill metrics: When portfolios carry different Market Exposure than S&P500, calculating security selection return as performance relative to S&P500 is perilous. High Market Exposure is a general risk to the industry and a source of turmoil. Since there is no relationship between Market Exposure of HF Aggregate and subsequent Market Factor return, Market Factor crowding is not a predictive indicator of future performance:

Chart of the correlation between the exposure of U.S. Hedge Fund Aggregate’s to the U.S. Market Factor and U.S. Market Factor’s return

U.S. Hedge Fund Aggregate’s U.S. Market Factor Exposure History and Factor Return

Hedge Fund Bond Factor (Interest Rate) Crowding

We showed in an earlier piece that Bond (Interest Rate) Factor exposure is one of the top drivers of hedge fund long equity risk and performance. This bond risk is a natural consequence of hedge funds’ fondness for “cheap call options.” These are often levered companies with significant bond exposure: the companies’ creditors are long bonds; the companies (and their equity owners) are economically short them.

This short Bond Factor (long Interest Rate) exposure is now near record levels and is the second most important source of HF Aggregate’s Factor Crowding:

Chart of the historical exposure of U.S. Hedge Fund Aggregate’s to the U.S. Bond Factor

U.S. Hedge Fund Aggregate’s U.S. Bond Factor Exposure History

As with Market Factor, Bond Factor Exposure is a general risk to the industry. There is no relationship between Bond Exposure of HF Aggregate and subsequent Bond Factor return:

Chart of the correlation between the exposure of U.S. Hedge Fund Aggregate’s to the U.S. Bond Factor and U.S. Bond Factor’s return

U.S. Hedge Fund Aggregate’s U.S. Bond Factor Exposure History and Factor Return

Hedge Fund Residual (Idiosyncratic) Crowding

As of 3/31/2016, a  third of hedge fund crowding was due to residual (idiosyncratic, stock-specific) risk. Netflix (NFLX) is responsible for a quarter of it. The five most crowded stocks collectively account for half:

Chart of the main stock-specific bets and their cumulative contribution to the residual variance of U.S. Hedge Fund Aggregate Portfolio relative to U.S. Market on 3/31/2016

Stocks Contributing Most to Relative Residual Variance of U.S. Hedge Fund Aggregate in Q1 2016

These may be perfectly sound fundamental investments. However, they are sensitive to asset flows in and out of the industry. Given the sharp losses to residual hedge fund crowding in 2015-2016 and the tendency of liquidations to revert, crowding risk in these has diminished and the liquidation may even present long investment opportunities:

Symbol Name Relative Exposure Residual Volatility Share of Relative Residual Variance Share of Relative Total Variance
NFLX Netflix, Inc. 1.77 54.97 26.47 8.41
LNG Cheniere Energy, Inc. 1.60 32.94 7.73 2.46
CHTR Charter Communications 2.38 19.79 6.17 1.96
TWC Time Warner Cable Inc. 2.74 15.80 5.22 1.66
JD JD.com, Inc. Sponsored ADR 1.34 29.35 4.31 1.37
AGN Allergan plc 2.06 17.07 3.43 1.09
VRX Valeant Pharmaceuticals International 0.67 43.49 2.37 0.75
PCLN Priceline Group Inc 1.28 22.17 2.24 0.71
FLT FleetCor Technologies, Inc. 1.41 19.72 2.16 0.69
UAL United Continental Holdings, Inc. 0.92 28.15 1.86 0.59

(Relative exposures and relative variance contribution. All values are in %. Volatility is annualized.)

Though these stock-specific bets are important, they account for less than a third of the entire hedge fund crowding picture. Consequently, in the current environment of extreme systematic hedge fund crowding, allocators and fund followers should continue to pay more attention to factor risk. As hedge funds’ residual volatility continues to wane, allocators owning a broadly diversified portfolio of hedge funds are increasingly at risk of paying high active fees for a passive factor portfolio.

Summary

  • The main source of Q1 2016 hedge fund crowding, responsible for nearly half of relative long equity risk, was record U.S. Market exposure.
  • The second most important source of Q1 2016 hedge fund crowding was near-record short Bond (long interest rate) exposure.
  • Given high factor (systematic) hedge fund long equity crowding, analysis of crowding risks must focus on factor exposures, rather than individual positions.
The information herein is not represented or warranted to be accurate, correct, complete or timely. Past performance is no guarantee of future results. Copyright © 2012-2016, AlphaBetaWorks, a division of Alpha Beta Analytics, LLC. All rights reserved. Content may not be republished without express written consent.

Hedge Fund Crowding Update – Q4 2015

Most analyses of hedge fund crowding focus on their residual (idiosyncratic, stock-specific) bets. This is misguided, since over 85% of the monthly return variance for the majority of hedge fund long equity portfolios is due to factor (systematic) exposures, rather than individual stocks. Indeed, it is the exceptional factor crowding and the record market risk that have driven much of the industry’s recent misery (just as they have driven much of the earlier upswings). In Q4 2015, a single factor accounted for half of U.S. hedge funds’ relative long equity risk (tracking error). We survey all sources of hedge fund crowding at year-end 2015 and identify the market regimes that would generate the highest relative outperformance and underperformance for the crowded factor portfolio. These are the regimes that would most benefit or hurt hedge fund investors and followers.

Identifying Hedge Fund Crowding

This piece follows the approach of our earlier articles on crowding: We processed regulatory filings of over 1,000 hedge funds and created a position-weighted portfolio (HF Aggregate) consisting of all the tractable hedge fund long U.S. equity portfolios. We then analyzed HF Aggregate’s risk relative to U.S. Market using the AlphaBetaWorks Statistical Equity Risk Model – a proven system for performance forecasting. The top contributors to HF Aggregate’s relative risk are the most crowded hedge fund bets.

Hedge Fund Aggregate’s Risk

The Q4 2015 HF Aggregate had 3.7% estimated future tracking error relative to U.S. Market; over two thirds of this was due to factor (systematic) exposures:

Factor (systematic) and residual (idiosyncratic) components of hedge fund crowding, or U.S. Hedge Fund Aggregate’s variance relative to U.S. Market on 12/31/2015

Components of the Relative Risk for U.S. Hedge Fund Aggregate in Q4 2015

Source Volatility (ann. %) Share of Variance (%)
Factor 3.10 69.07
Residual 2.08 30.93
Total 3.73 100.00

Simplistic analysis of hedge fund crowding that lacks a capable risk model will miss these systematic exposures. Among its flows, this comparison of holdings will overlook funds with no position overlap but high future correlation due to similar factor exposures. Hence, this simplistic analysis of hedge fund crowding fosters dangerous complacency.

Hedge Fund Factor (Systematic) Crowding

Factor exposures drove nearly 70% of the relative risk of HF Aggregate at year-end 2015. Below are the principal factor exposures (in red) relative to U.S. Market’s exposures (in gray):

Chart of the factor exposures contributing most to hedge fund crowding, or the factor variance of U.S. Hedge Fund Aggregate Portfolio relative to U.S. Market on 12/31/2015

Significant Absolute and Relative Factor Exposures of U.S. Hedge Fund Aggregate in Q4 2015

Of these bets, Market (Beta) alone accounts for two thirds of the relative and half of the total factor risk, as illustrated below:

Chart of the main factors behind systematic hedge fund crowding and their cumulative contribution to the factor variance of U.S. Hedge Fund Aggregate Portfolio relative to U.S. Market on 12/31/2015

Factors Contributing Most to Relative Factor Variance of U.S. Hedge Fund Aggregate in Q4 2015

Factor Relative Exposure Factor Volatility Share of Relative Factor Variance Share of Relative Total Variance
Market 18.27 12.46 68.12 47.05
Oil Price 2.28 29.43 13.08 9.04
Bond Index -7.53 3.33 4.97 3.43
Utilities -3.10 11.28 4.77 3.30
Consumer -8.30 3.75 3.54 2.44
Energy -3.21 11.77 -2.96 -2.04
Health 4.79 7.22 2.54 1.75
Communications -1.67 11.98 1.91 1.32
Finance -6.89 5.08 1.68 1.16
Size -1.96 8.09 1.34 0.92

(Relative exposures and relative variance contribution. All values are in %. Volatility is annualized.)

Thus, the most important source of hedge fund crowding is not a stock or a group of stocks, but systematic exposure to the U.S. Market Factor. When nearly half of the industry’s risk comes from a single Factor, fixation on the individual crowded stocks is particularly dangerous.

The U.S. Market crowding alone explains much of the recent industry misery. In this era of systematic crowding, risk management with a robust and predictive factor model is particularly vital for managers’ and allocators’ survival.

Hedge Fund Factor Crowding Stress Tests

Hedge Fund Crowding Maximum Outperformance

Given Hedge Fund Aggregate’s bullish macroeconomic positioning (Long Market, Short Bonds/Long Interest Rates), it would experience its highest outperformance in an environment similar to the March-2009 rally. In this scenario, HF Aggregate’s factor portfolio would outperform by 20%:

Chart of the cumulative factor returns for the historical scenario that would generate the highest relative return for the 12/31/2015 U.S. Hedge Fund Aggregate Portfolio relative to U.S. Market

Historical Scenario that Would Generate the Highest Relative Performance for the Q4 2015 U.S. Hedge Fund Aggregate

The top contributors to this outperformance would be the following exposures:

Factor Return Portfolio Exposure Benchmark Exposure Relative Exposure Portfolio Return Benchmark Return Relative Return
Market 66.04 120.07 101.80 18.27 83.00 67.50 15.50
Oil Price 87.13 1.53 -0.75 2.28 1.05 -0.51 1.56
Bond Index -6.29 -4.92 2.61 -7.53 0.31 -0.17 0.48
Energy -12.54 1.61 4.82 -3.21 -0.20 -0.61 0.41
Communications -17.62 0.52 2.19 -1.67 -0.10 -0.41 0.31

Hedge Fund Crowding Maximum Underperformance

Given Hedge Fund Aggregate’s bullish macroeconomic positioning, combined with a long Technology and short Finance exposures, it would experience its highest underperformance in an environment similar to the 2000-2001 .com Crash. In this scenario, HF Aggregate’s factor portfolio would underperform by 8%:

Chart of the cumulative factor returns for the historical scenario that would generate the lowest relative return for the 12/31/2015 U.S. Hedge Fund Aggregate Portfolio relative to U.S. Market

Historical Scenario that Would Generate the Lowest Relative Performance for the Q4 2015 U.S. Hedge Fund Aggregate

The top contributors to this underperformance would be the following exposures:

Factor Return Portfolio Exposure Benchmark Exposure Relative Exposure Portfolio Return Benchmark Return Relative Return
Finance 47.97 12.48 19.36 -6.89 5.27 8.26 -2.99
Market -14.21 120.07 101.80 18.27 -17.22 -14.48 -2.74
Technology -36.73 23.75 20.14 3.62 -9.83 -8.38 -1.45
Utilities 52.32 0.22 3.31 -3.10 0.10 1.51 -1.42
Consumer 12.36 14.87 23.17 -8.30 1.82 2.85 -1.02

Hedge Fund Residual (Idiosyncratic) Crowding

A third of the year-end 2015 hedge fund crowding is due to residual (idiosyncratic, stock-specific) risk. Valeant Pharmaceuticals International (VRX) and Netflix (NFLX) are responsible for nearly half of it:

Chart of the main stock-specific sources of hedge fund crowding and their cumulative contribution to the residual variance of U.S. Hedge Fund Aggregate Portfolio relative to U.S. Market on 12/31/2015

Stocks Contributing Most to Relative Residual Variance of U.S. Hedge Fund Aggregate in Q4 2015

Though there may be sound individual reasons for these investments, they are vulnerable to brutal liquidation. Given the recent damage to hedge funds from herding, these crowded residual bets remain vulnerable:

Symbol Name Relative Exposure Residual Volatility Share of Relative Residual Variance Share of Relative Total Variance
VRX Valeant Pharmaceuticals International, Inc. 2.67 43.72 31.56 9.76
NFLX Netflix, Inc. 1.57 54.62 17.15 5.30
JD JD.com, Inc. Sponsored ADR Class A 1.60 31.91 6.05 1.87
LNG Cheniere Energy, Inc. 1.38 33.35 4.88 1.51
CHTR Charter Communications, Inc. Class A 1.79 20.31 3.08 0.95
TWC Time Warner Cable Inc. 1.85 16.14 2.06 0.64
AGN Allergan plc 1.83 14.62 1.66 0.51
FLT FleetCor Technologies, Inc. 1.18 19.61 1.23 0.38
PCLN Priceline Group Inc 1.12 20.10 1.18 0.36
MSFT Microsoft Corporation 1.54 14.13 1.10 0.34

(Relative exposures and relative variance contribution. All values are in %. Volatility is annualized.)

Though stock-specific bets remain important, allocators and fund followers should pay particular attention to their factor exposures in the current environment of extreme systematic hedge fund crowding. Many may be effectively invested in leveraged passive index fund portfolio, with the added insult of high fees. AlphaBetaWorks Analytics address all of these needs with the coverage of market-wide and sector-specific herding, plus aggregate factor exposures of funds and portfolios of funds.

Summary

  • The main source of Q4 2015 hedge fund crowding, responsible for nearly half of the relative long equity risk, was record U.S. Market exposure.
  • The main sources of Q4 2015 residual crowding were VRX and NFLX.
  • Given the high factor (systematic) crowding among hedge funds’ long equity portfolios, current analysis of crowding risks must focus on the factor exposures, rather than individual positions.
The information herein is not represented or warranted to be accurate, correct, complete or timely.
Past performance is no guarantee of future results.
Copyright © 2012-2016, AlphaBetaWorks, a division of Alpha Beta Analytics, LLC. All rights reserved.
Content may not be republished without express written consent.


Hedge Fund Crowding Update – Q3 2015

Since crowded stocks are prone to mass liquidation, investors are typically most concerned with residual (idiosyncratic, stock-specific) hedge fund crowding. This overlooks the exceptional factor (systematic) crowding and the record market risk that have been driving recent industry performance. In Q3 2015, when a single factor and a single stock accounted for over half of the aggregate U.S. hedge fund long equity portfolio’s relative risk, hedge fund crowding became unprecedented.

Identifying Hedge Fund Crowding

This piece follows the approach of our earlier articles on crowding: We created a position-weighted portfolio (HF Aggregate) consisting of the common U.S. equity holdings of all tractable long hedge fund portfolios. We then analyzed HF Aggregate’s risk relative to U.S. Market using the AlphaBetaWorks Statistical Equity Risk Model. The top sources of HF Aggregate’s relative risk are the top sources of hedge fund crowding.

Hedge Fund Aggregate’s Risk

The Q3 2015 HF Aggregate had 3.9% estimated future tracking error relative to U.S. Market; factor (systematic) bets were its primary sources. The components of HF Aggregate’s relative risk were as follows:

Factor (systematic) and residual (idiosyncratic) components of the U.S. Hedge Fund Aggregate’s variance relative to U.S. Market

Components of the Relative Risk for U.S. Hedge Fund Aggregate

Source Volatility (ann. %) Share of Variance (%)
Factor 2.91 55.17
Residual 2.62 44.83
Total 3.91 100.00

A simplistic crowding analysis that does not rely on an effective risk model ignores systematic exposures of positions. Since portfolios with very different holdings can have matching factor exposures and can track each other closely, crowding is common even for portfolios with little overlap. Such simplistic analyses thus overlooks factor (systematic) exposures that are responsible for the majority of covariance among hedge funds.

Hedge Fund Factor (Systematic) Crowding

Factor exposures drove over half of the relative risk of HF Aggregate in Q3. Below are its principal factor exposures (in red) relative to U.S. Market’s exposures (in gray):

Chart of the factor exposures contributing most to the factor variance of U.S. Hedge Fund Aggregate Portfolio relative to U.S. Market on 9/30/2015

Factors Contributing Most to the Relative Risk for U.S. Hedge Fund Aggregate

Of these bets, Market (Beta) alone accounts for two thirds of the relative factor risk and over a third of the total risk. The top components of the 2.91% Factor Volatility in the first table are as follows:

Chart of the main factors and their cumulative contribution to the factor variance of U.S. Hedge Fund Aggregate Portfolio relative to U.S. Market on 9/30/2015

Factors Contributing Most to Relative Factor Variance of U.S. Hedge Fund Aggregate

Factor Relative Exposure Factor Volatility Share of Relative Factor Variance Share of Relative Total Variance
Market 17.26 12.28 65.18 35.96
Oil Price 2.93 28.89 20.11 11.10
Industrial 9.30 5.41 7.80 4.30
Utilities -3.32 11.05 4.49 2.48
Finance -7.76 5.18 3.36 1.85
Consumer -4.85 4.27 2.68 1.48
Health 5.68 6.82 2.31 1.27
Communications -1.74 11.77 1.64 0.91
Energy -2.10 12.68 -4.19 -2.31
FX 4.78 7.59 -5.95 -3.28

(Relative exposures and relative variance contribution. All values are in %. Volatility is annualized.)

The most important source of hedge fund crowding is not a stock or a set of stocks, but systematic exposure to a risk factor. Currently, fixation on stock-specific hedge fund bets is at best misguided and at worst dangerous for allocators. Risk management using a robust and predictive system, such as AlphaBetaWorks Risk Analytics, is currently key to controlling systematic fund crowding.

Hedge Fund U.S. Market Factor Exposure History

HF Aggregate’s 9/30/2015 market exposure was approximately 120% (its Market Beta was approximately 1.2). The hedge fund industry is thus taking approximately 20% more market risk than U.S. equities and approximately 25% more market risk than S&P 500. This record exposure has been costly for the industry and many individual funds during the 2015 turmoil, exacerbating volatility due to stock-specific crowding:

Chart of the historical exposure of U.S. Hedge Fund Aggregate Portfolio to the U.S. Market Factor

U.S. Hedge Fund Aggregate’s U.S. Market Factor Exposure History

HF Aggregate generally takes 10-20% more market risk than S&P500. Consequently, comparison of long hedge fund portfolio performance to market indices is misleading and assumption that outperformance relative to S&P500 is alpha is wrong. In a rising market, allocators who make these mistakes are likely to allocate to the most aggressive managers, rather than the most skilled. In flat or declining market, these mistakes become evident. Skill analytics that discriminate among the different levels of systematic risk are the solution.

Hedge Fund Residual (Idiosyncratic) Crowding

About 45% of recent hedge fund crowding is due to residual (idiosyncratic, stock-specific) risk. In part due to its spectacular volatility, a single position in Valeant Pharmaceuticals International (VRX) is now responsible for most of it:

Chart of the main stock-specific bets and their cumulative contribution to the residual variance of U.S. Hedge Fund Aggregate Portfolio relative to U.S. Market on 9/30/2015

Stocks Contributing Most to Relative Residual Variance of U.S. Hedge Fund Aggregate

Though individual crowded names may be wonderful investments, they have tended to underperform; they have seen consistent, and lately brutal, liquidation under the recent outflows:

Symbol Name Relative Exposure Residual Volatility Share of Relative Residual Variance Share of Relative Total Variance
VRX Valeant Pharmaceuticals International, Inc. 4.68 43.92 61.55 27.59
LNG Cheniere Energy, Inc. 1.80 40.12 7.57 3.39
NFLX Netflix, Inc. 1.10 56.17 5.59 2.51
CHTR Charter Communications, Inc. Class A 1.81 20.93 2.09 0.94
JD JD.com, Inc. Sponsored ADR Class A 1.31 28.91 2.08 0.93
TWC Time Warner Cable Inc. 1.86 16.57 1.39 0.62
AGN Allergan plc 1.67 15.39 0.96 0.43
FLT FleetCor Technologies, Inc. 1.20 19.53 0.80 0.36
PCLN Priceline Group Inc 1.11 20.74 0.78 0.35
PAGP Plains GP Holdings LP Class A 0.89 22.91 0.60 0.27

(Relative exposures and relative variance contribution. All values are in %. Volatility is annualized.)

Especially in the prevailing environment of portfolio liquidations, investors should not blindly follow star managers. Instead, any signs of crowding should trigger particularly thorough due-diligence. Allocators should be doubly concerned with crowding as they may be investing in a pool of undifferentiated bets and a leveraged factor portfolio. AlphaBetaWorks’ analytics address all of these needs with coverage of aggregate and sector-specific herding, predictive risk analytics, and detection of skills strongly predictive of future performance.

Summary

  • The main source of Q3 2015 hedge fund crowding is record Market (Beta) exposure, responsible for more than a third of the hedge fund industry’s relative risk.
  • The main source of Q3 2015 residual crowding is VRX.
  • In the current environment, analysis of hedge fund crowding must focus on the factor exposures driving systematic crowding, rather than individual positions.
The information herein is not represented or warranted to be accurate, correct, complete or timely.
Past performance is no guarantee of future results.
Copyright © 2012-2015, AlphaBetaWorks, a division of Alpha Beta Analytics, LLC. All rights reserved.
Content may not be republished without express written consent.