Common approaches to manager selection do a lousy job since nominal returns and similar simplistic metrics of investment performance revert: Most portfolio performance comes from systematic (factor) exposures, and such metrics merely identify the highest-risk portfolios during the bullish regimes and the lowest-risk portfolios during the bearish regimes. As regimes change, so do the leaders. In the past we demonstrated the reversion of mutual funds’ nominal returns, the reversion of hedge funds’ nominal returns, and the failures of popular statistics (Sharpe Ratio, Win/Loss Ratio, etc.) based on nominal returns. This article extends the study of performance persistence to the broadest universe of U.S. institutional portfolios and to the popular Size and Value/Growth style boxes within this universe.
Our earlier work also showed that, when security selection returns are properly calculated with a robust factor model, skill persists – portfolios of the top stock pickers of the past outperform market and peers in the future. We will now validate these findings across all major style boxes and note the particular effectiveness of predictive skill analytics for small-cap manager selection.
Measuring Persistence of Returns
We surveyed portfolios of over 5,000 institutions that have filed Form 13F in the past 10 years. This is the broadest and most representative survivorship-free portfolio database for all institutions that exercised investment discretion over at least $100 million. The collection includes hedge funds, mutual fund companies, and investment advisors. Approximately 3,000 institutions had sufficiently long histories, low turnover, and broad portfolios to be suitable for this study of performance persistence.
We split the 10 years of history into two random 5-year subsets and compared performance of each portfolio over these two periods. If performance persists over time, there will be a positive correlation between returns in one period and returns in the other.
Performance Persistence for all Institutional Portfolios
The Reversion of Nominal Returns
The chart below plots the ranking of nominal returns for each portfolio during the two periods. Each point corresponds to a single institution. The x-axis plots return percentile, or ranking, in the first historical sample. The y-axis plots return percentile, or ranking, in the second historical sample. For illustration, the best-performing filers of the first period have x-values near 100; the best-performing filers of the second period have y-values near 100:
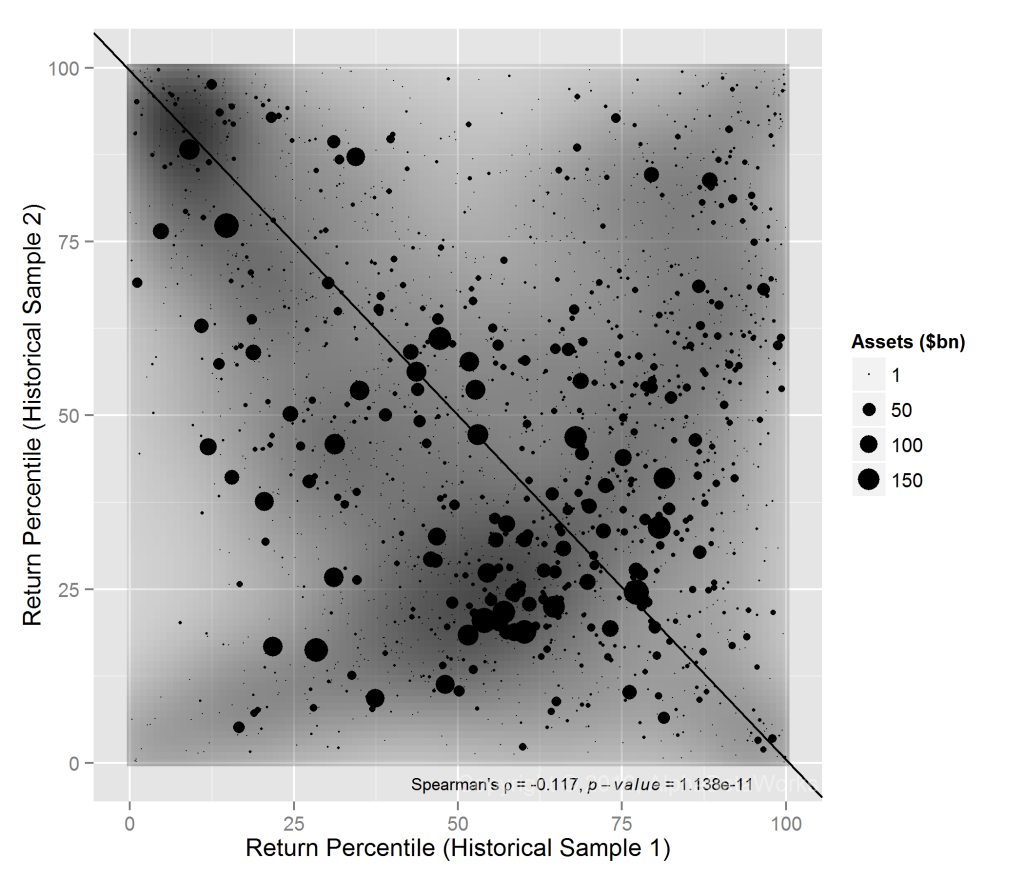
13F Equity Portfolios: Correlation between the rankings of nominal returns for two historical samples
Contrary to a popular slogan, past performance actually is an indication of future results: Managers with above-average nominal returns in one historical sample are likely to have below-average nominal returns in the other. In the above chart, this negative relationship between (reversion of) historical returns is visible as groupings in the bottom right (leaders that became laggards) and top left (laggards that became leaders).
The Persistence of Security Selection Returns
Nominal performance reverts because it is dominated by Market and other systematic factors. Top-performing managers during the bullish regimes are those who take the most risk; top-performing managers during the bearish regimes are those who take the least risk. As regimes change, leadership flips. To eliminate these disruptive factor effects, the AlphaBetaWorks Performance Analytics Platform calculates each portfolio’s return from security selection net of factor effects. αReturn is the return a manager would have generated if all factor returns had been flat.
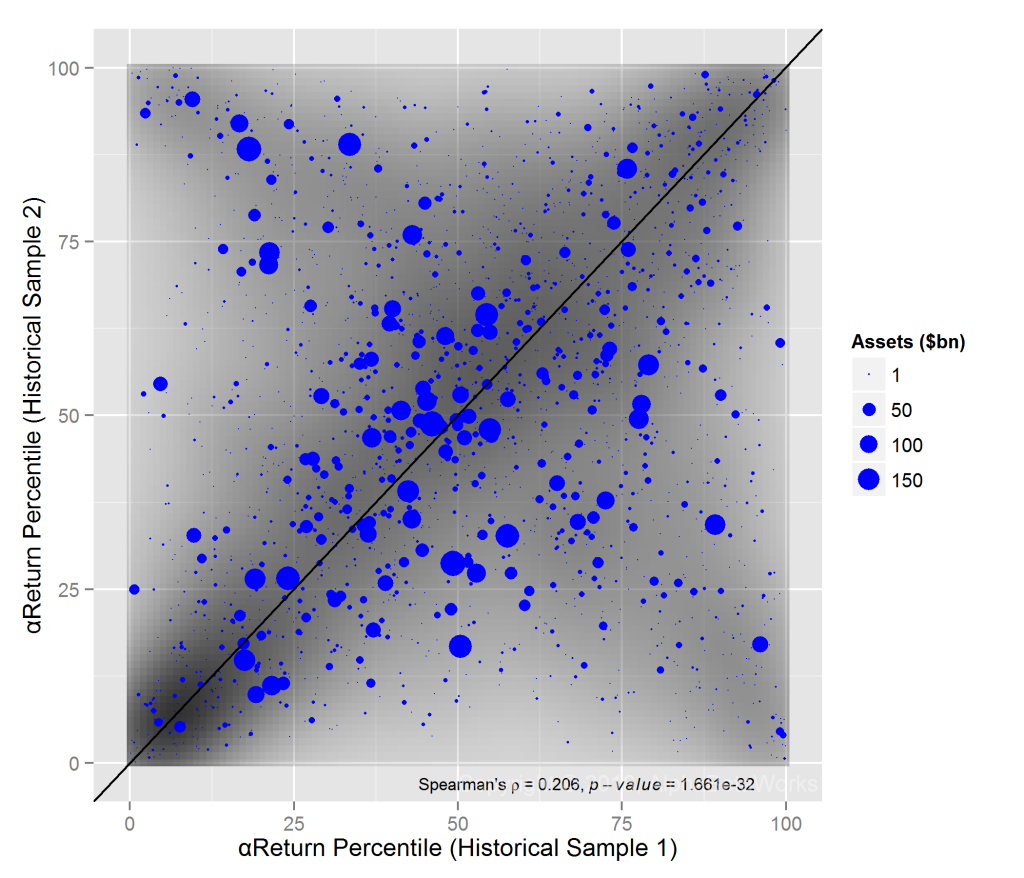
Managers with above-average αReturns in one period are likely to maintain them in the other. In the following chart, this positive relationship between historical αReturns is visible as grouping in the bottom left (laggards that remained laggards) and top right (leaders that remained leaders):
A test of performance persistence across two arbitrary 5-year samples of a 10-year span is especially strict. For most funds covered by the Platform, persistence of security selection skill is far higher over shorter periods. It is highest for approximately 3 years and begins to fade rapidly after 4 years. The chart above also illustrates that low stock picking returns persist and do so more strongly than high stock picking returns – the bottom left cluster of consistently weak stock pickers is the most dense.
Performance Persistence within Each Style Box
Measures of investment style such as Size (average portfolio market capitalization) and Value/Growth are a popular approach to grouping portfolios and analyzing risk. Though not the dominant drivers of portfolio risk and performance, they are often believed to be. Consequently, clients frequently ask whether the reversion of nominal returns and related metrics can be explained by Style Box membership and cycles of style leadership. To test this, we compared performance persistence within each of the four popular style boxes. It turns out style does not explain nominal return reversion and αReturns persist within each style box.
Large-Cap Value Portfolio Return Persistence
Portfolios in the Large-cap Value Style Box show especially high nominal return reversion (-0.23 Spearman’s rank correlation coefficient between samples). This is probably attributable to the high exposures of these portfolios to the cyclical industries that suffer from the most pronounced booms and busts:
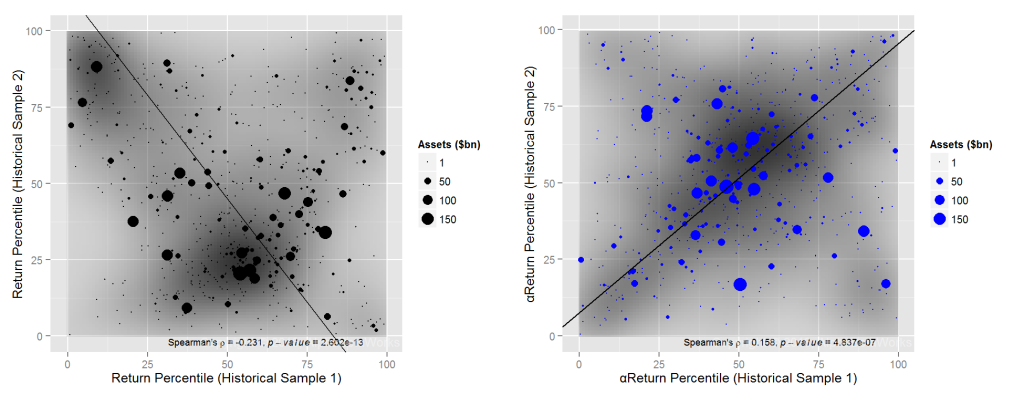
Large-Cap Value 13F Portfolios: Correlation between the rankings of nominal returns and αReturns for two historical samples
Large-Cap Growth Portfolio Return Persistence
Portfolios in the Large-cap Growth Style Box are the closest to random and show the lowest persistence of αReturns. Large-cap Growth stock picking is exceptionally treacherous over the long term. While it is possible to select skilled managers in this area, it is challenging even with the most powerful skill analytics:
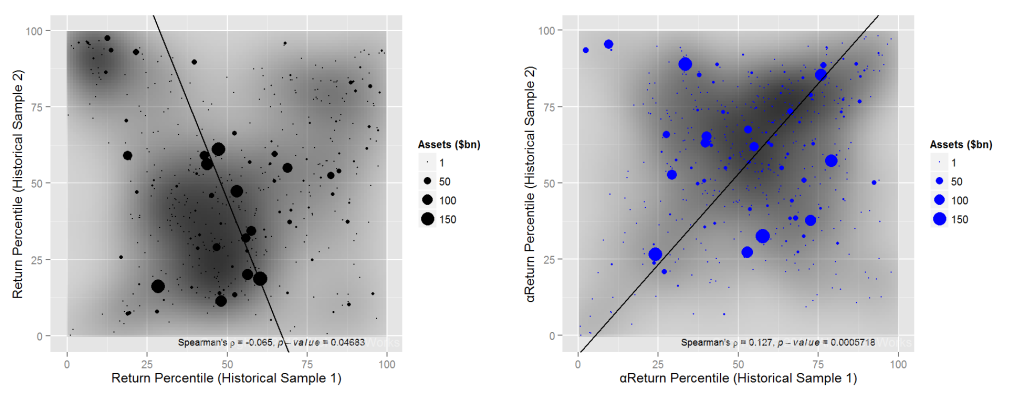
Large-Cap Growth 13F Portfolios: Correlation between the rankings of nominal returns and αReturns for two historical samples
Small-Cap Value Portfolio Return Persistence
Portfolios in the Small-cap Value Style Box show nearly random nominal returns. They also have the most persistent αReturns. Small-cap Value stock picking records are thus most consistent over the long term. This is the area where allocators and investors armed with powerful skill analytics should perform well, especially by staying away from the unskilled managers:
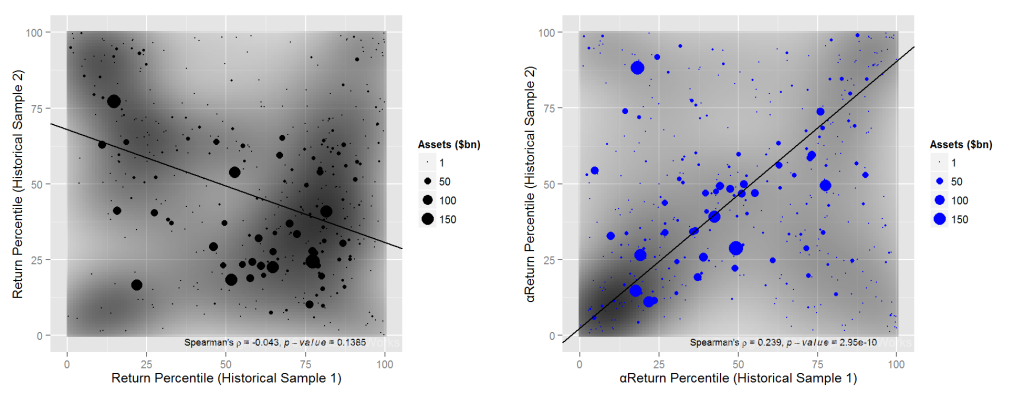
Small-Cap Value 13F Portfolios: Correlation between the rankings of nominal returns and αReturns for two historical samples
Small-Cap Growth Portfolio Return Persistence
Portfolios in the Small-cap Growth Style Box have the second most persistent αReturns. This is also an area where allocators and investors armed with powerful skill analytics will have a strong edge:
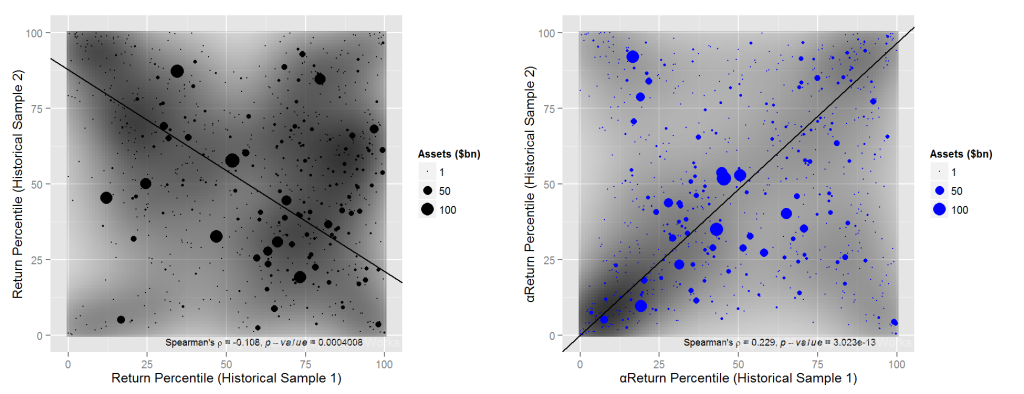
Small-Cap Growth 13F Portfolios: Correlation between the rankings of nominal returns and αReturns for two historical samples
Summary
- Nominal returns and related simplistic metrics of investment skill revert: as market regimes change, the top performers tend to become the bottom performers.
- Security selection returns, when properly calculated with a robust factor model, persist and yield portfolios that outperform.
- Both skill and lack of skill persist, and the lack of skill persists most strongly; while it is important that investors correctly identify the talented managers, it is even more important to divest from their opposites.
- The reversion of nominal returns and the persistence of security selection skill hold across all style boxes, but security selection skill is most persistent for small-cap portfolios.

