
For Many Equity Funds, Bond Risk is More Important than Industry and Style
This year, equity fund investors have been reading – and will soon read more – quarterly letters lamenting volatility and poor performance. The true reasons are rarely identified. Portfolio managers themselves may not fully understand the causes. The hidden bond exposure in equity portfolios is often the culprit.
Hidden Bond Risk in the Equity Market
An equity portfolio with no bond positions is still exposed to the bond market. The relationship between equity and fixed income markets evolves, depending on the macroeconomic environment. This relationship has been significant lately. Over the past five years, 20% of U.S. Equity Market volatility can be explained by a negative correlation to the U.S. Bond Index:
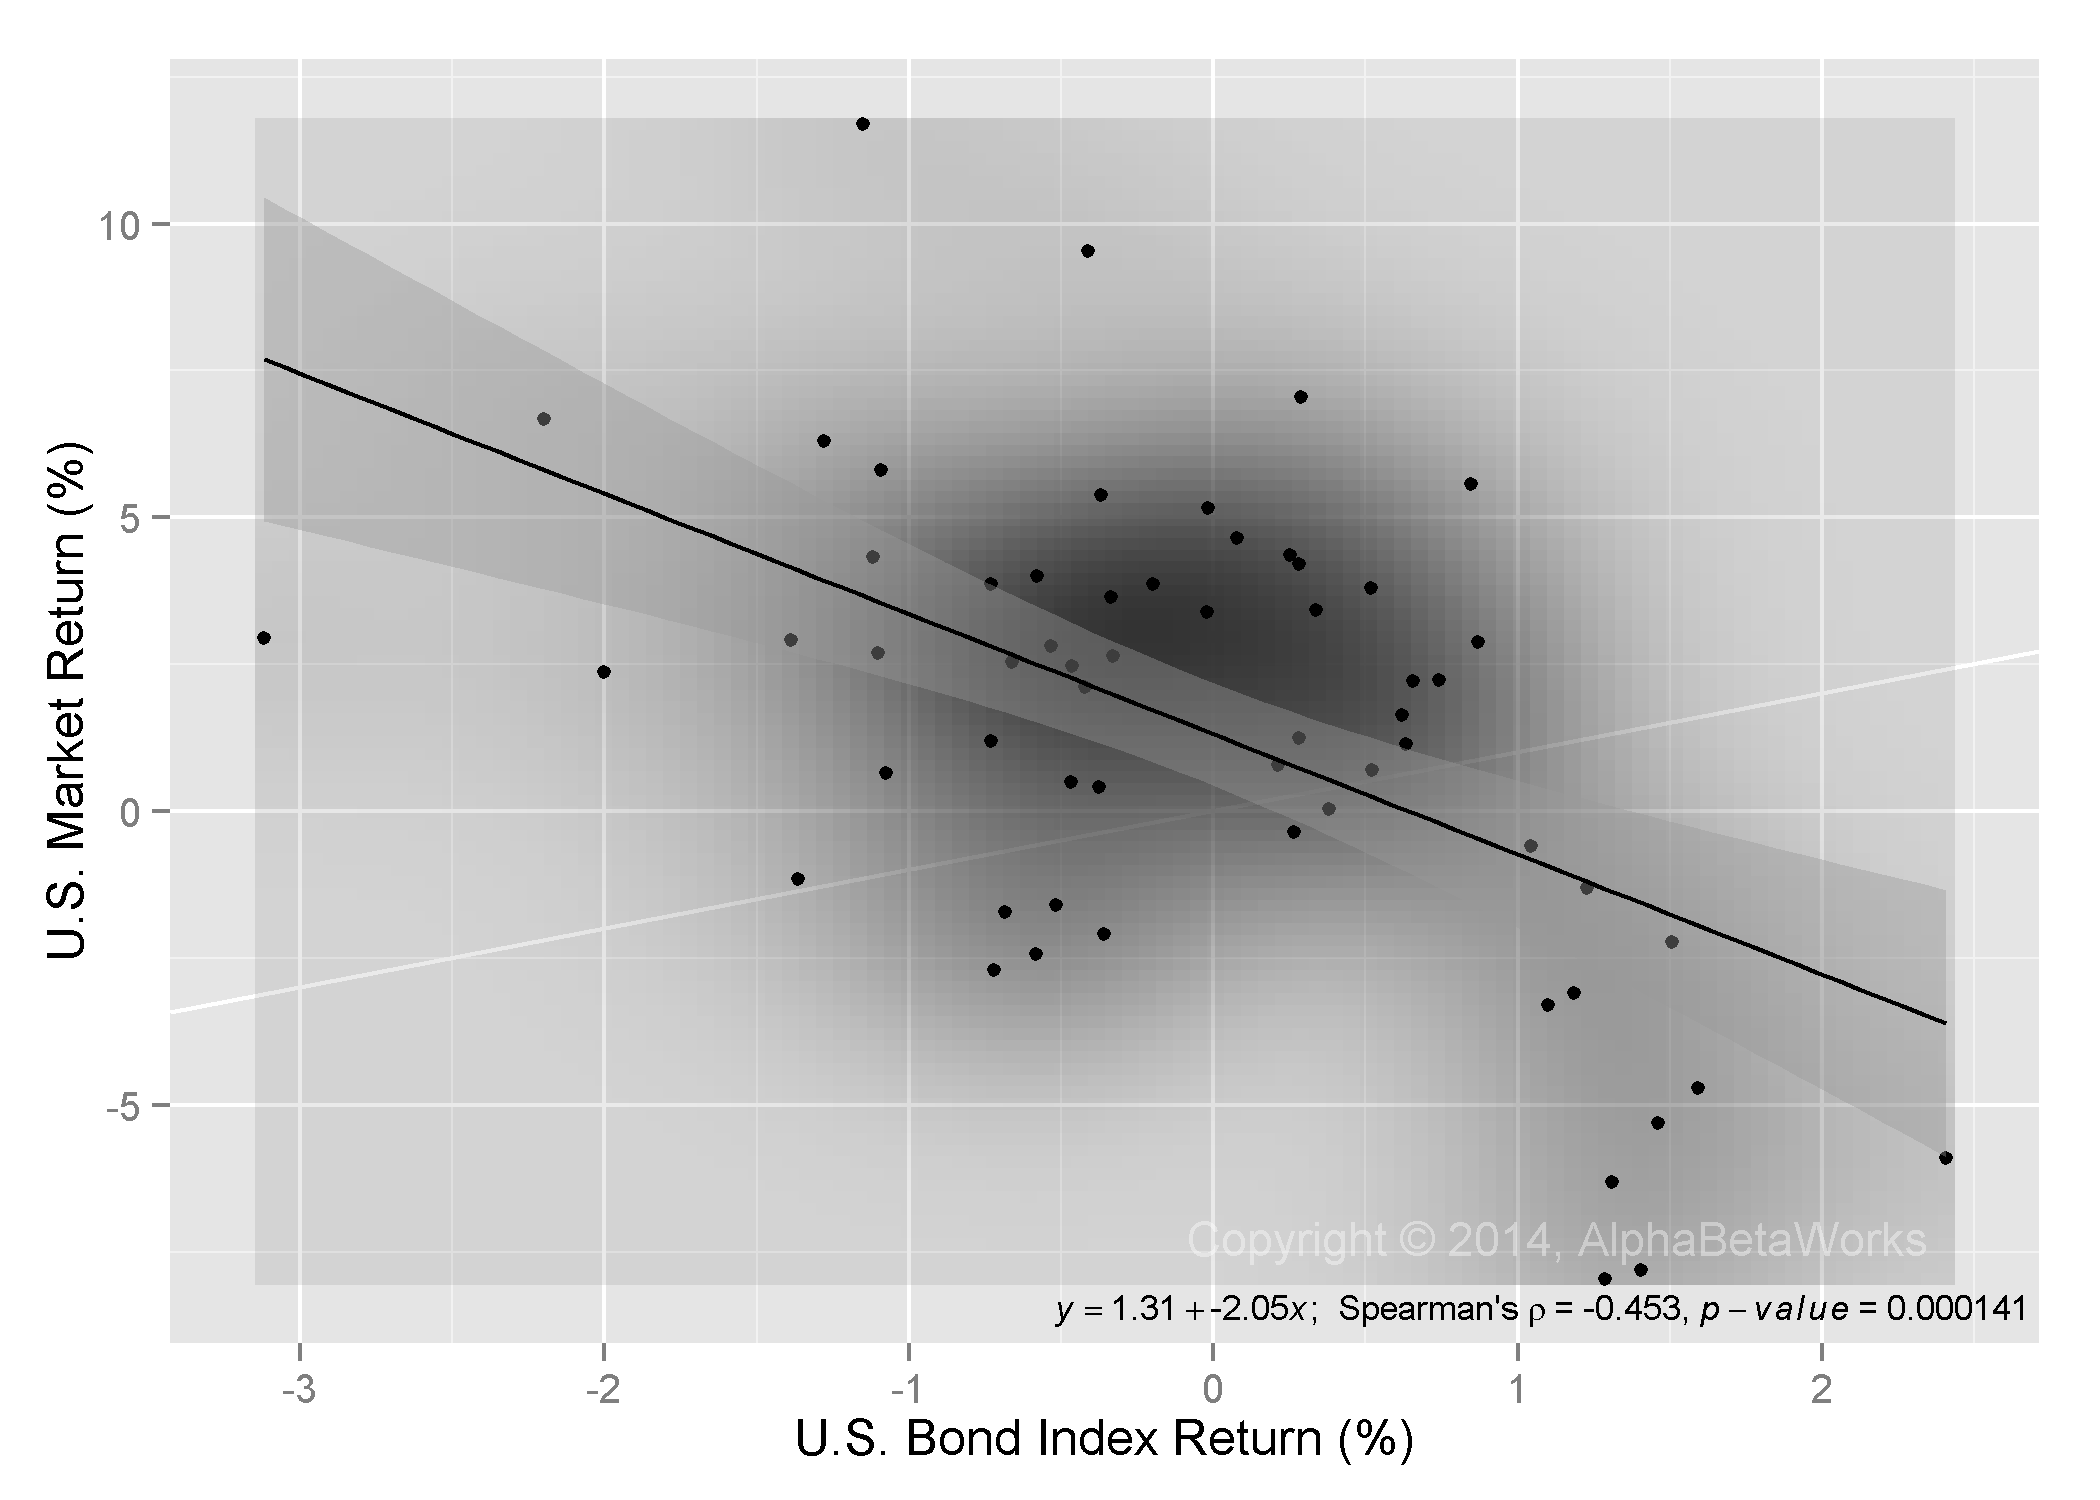
U.S. Market Monthly Returns vs U.S. Bond Index Monthly Returns (2009-2014)
For example: The 5.4% decline in bond prices explains over a third of the 31% Russell 3000 return in 2013.
Hidden Bond Risk in Small Caps
A less well-appreciated source of additional bond risk is the bond exposure of particular industries and stock types. For example, Size Factor (the difference in returns, net of market and sector effects, between the largest and the smallest stocks) has a significant positive relationship with bonds: Small caps tend to have a negative relationship to bond prices, while the opposite is true for large cap stocks.
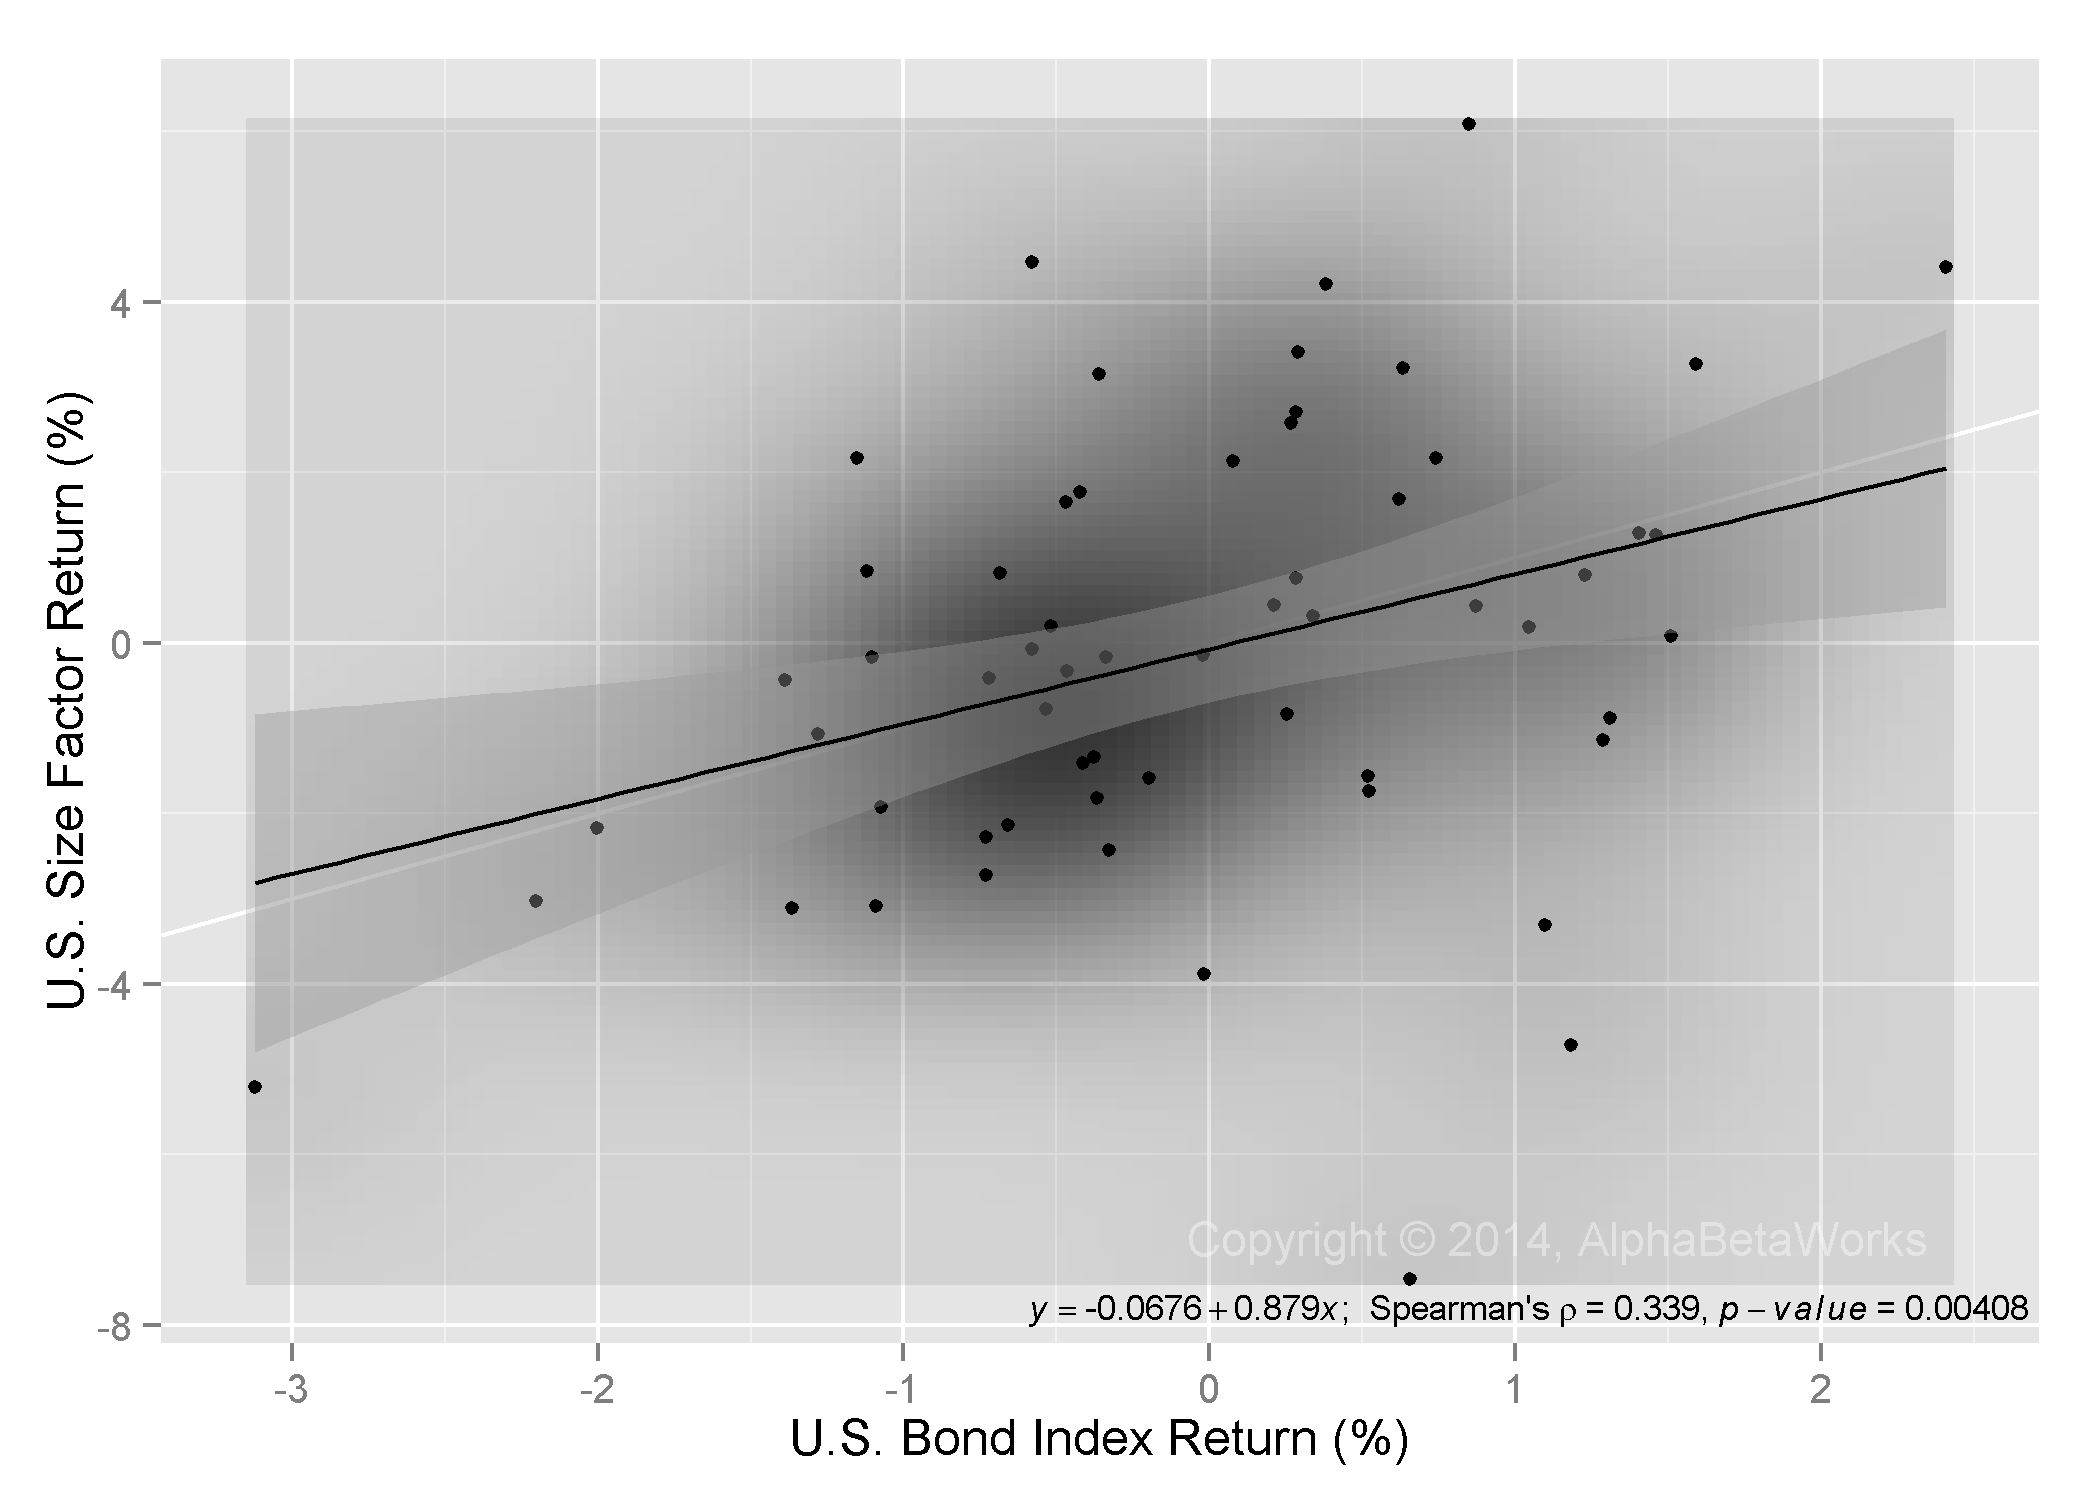
U.S. Size Factor Monthly Returns vs U.S. Bond Index Monthly Returns (2009-2014)
In 2013, the smallest U.S. stocks outperformed the largest by 9%. The 5.4% decline in bonds explains over half of this outperformance. In short, if you’re making an allocation to small or large capitalization funds, you’re making an implicit bet on bonds.
This source of bond exposure is captured by AlphaBetaWorks’ Size Factor exposure (Size beta). This exposure is often overlooked, but a robust equity risk model will identify it.
Company-Specific Bond Risk
Financially levered companies – particularly those with fixed long-term liabilities – have negative exposure to bonds. Any change in interest rates will affect the value of their liabilities and thus their stock prices. For example, Valley National Bancorp (VLY), which is approximately 2.5 times levered, has significant short bond exposure. The statistically observed exposure is -1.4x – almost perfectly in-line with its 150% debt load:
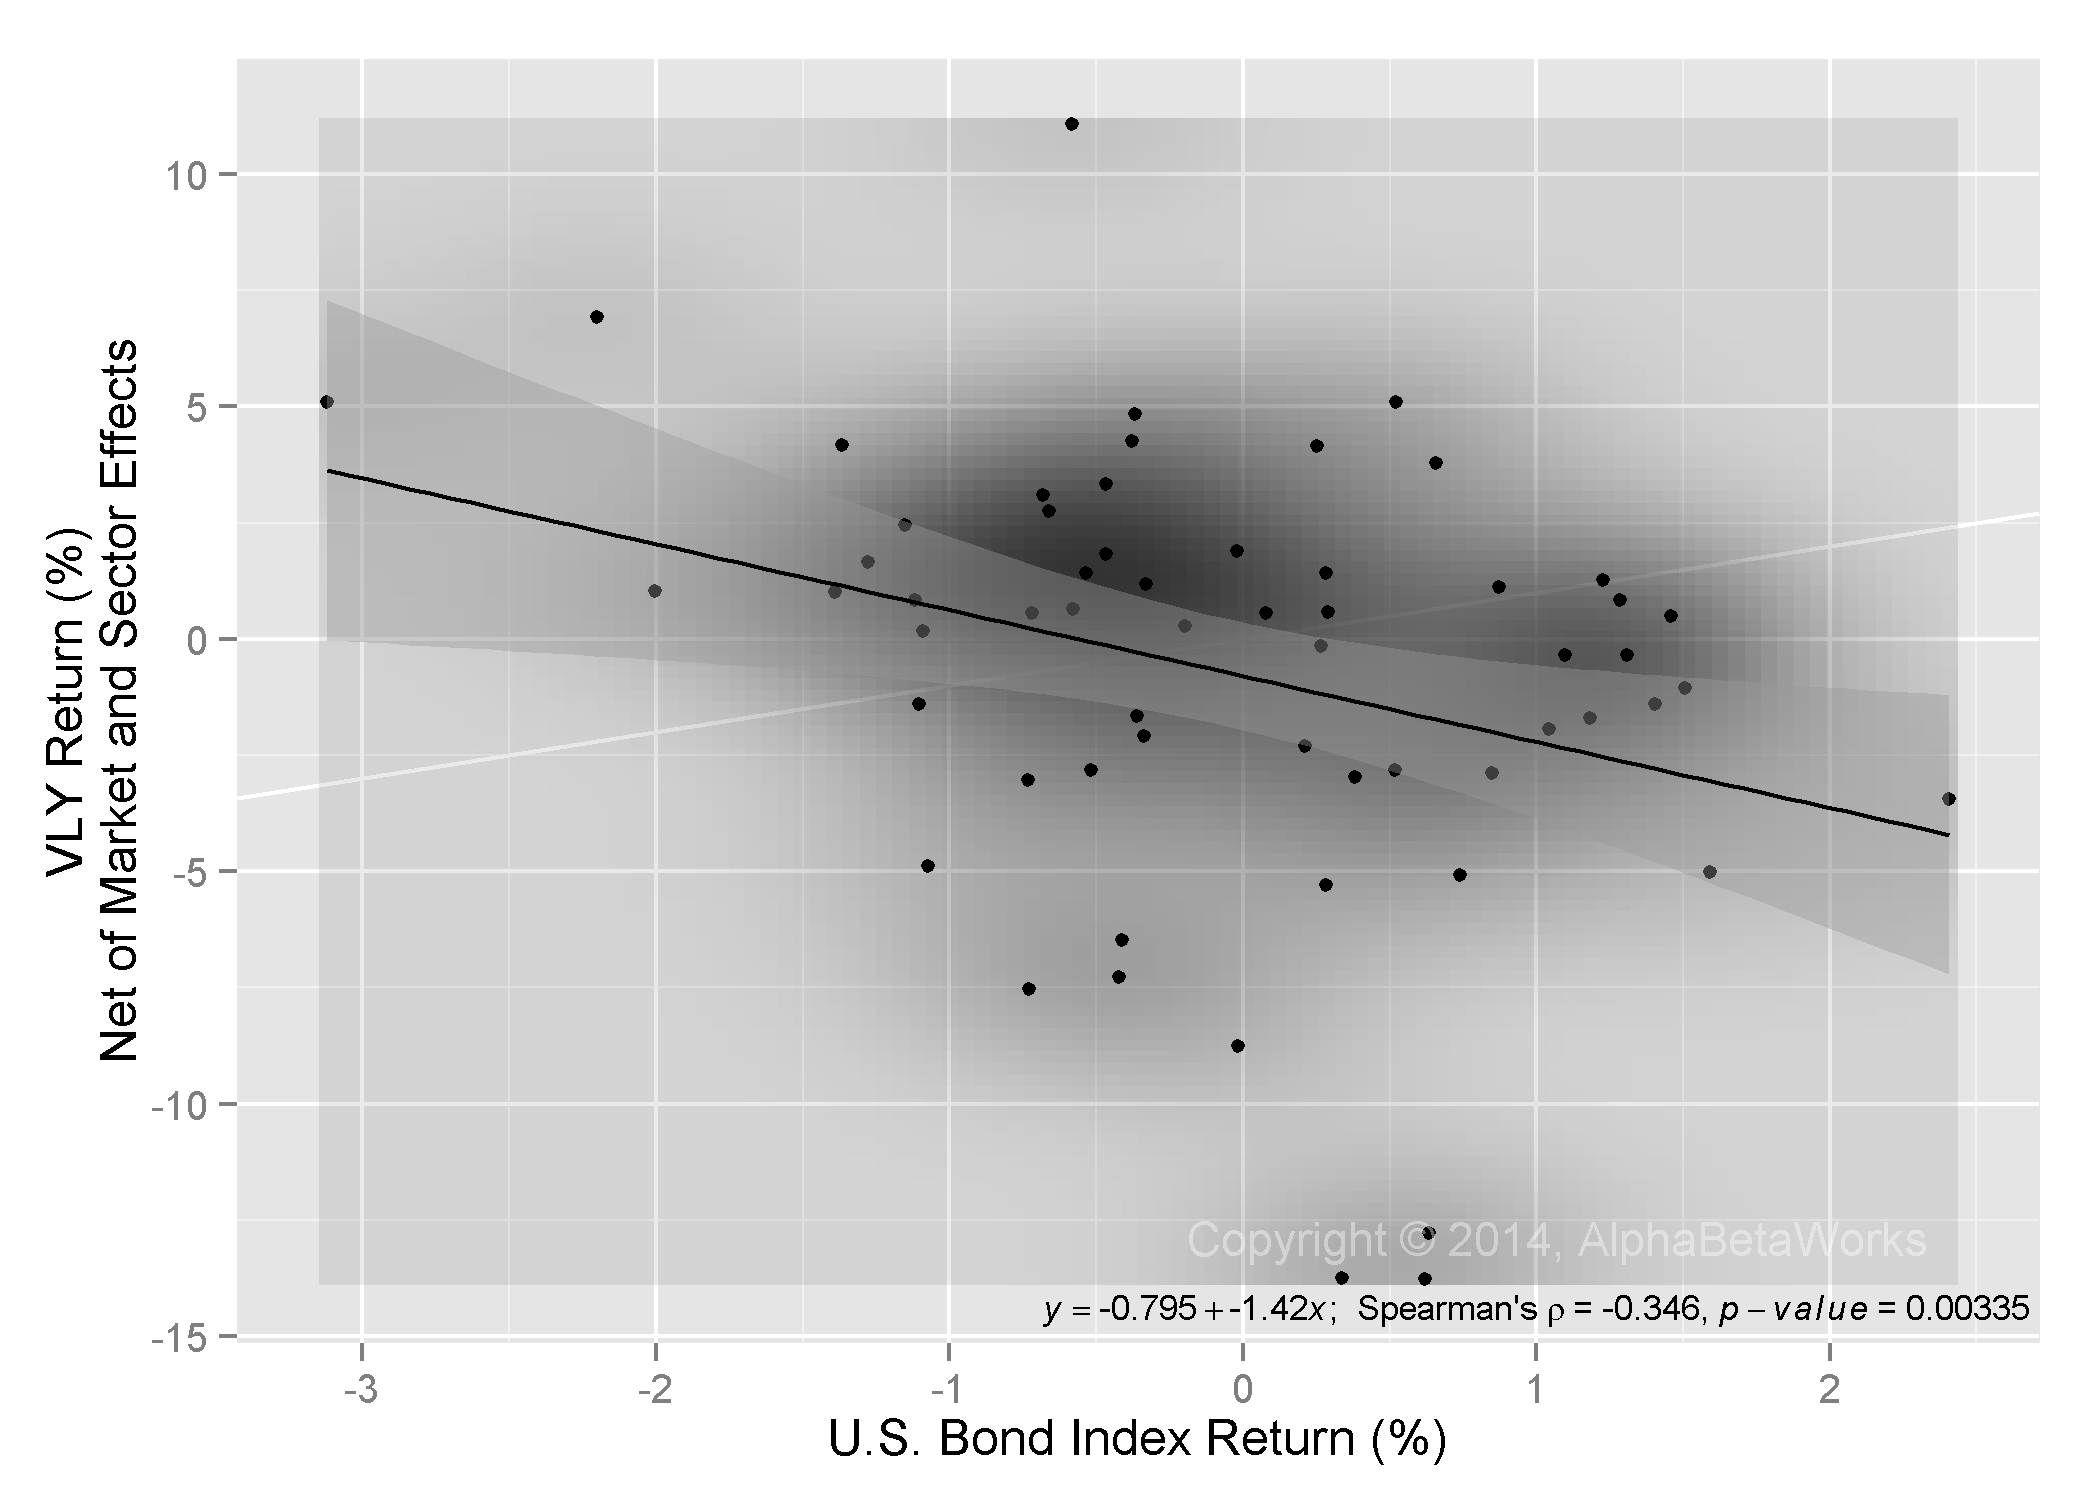
Valley National Bancorp (VLY) Monthly Returns vs U.S. Bond Index Monthly Returns (2009-2014)
Bond performance also captures a number of broad macroeconomic risks: deflation, credit crises, and recessions. Companies that are not financially levered, but are still heavily exposed to these risks, exhibit negative correlation with bonds. For instance, the earnings power of T. Rowe Price Group (TROW) is sensitive to the faith in capital markets, macroeconomic stability, and investor sentiment. TROW and other asset managers tend to have negative bond exposures. Approximately 20% of the volatility of TROW over the past five years, net of market and sector effects, is explained by bond returns:
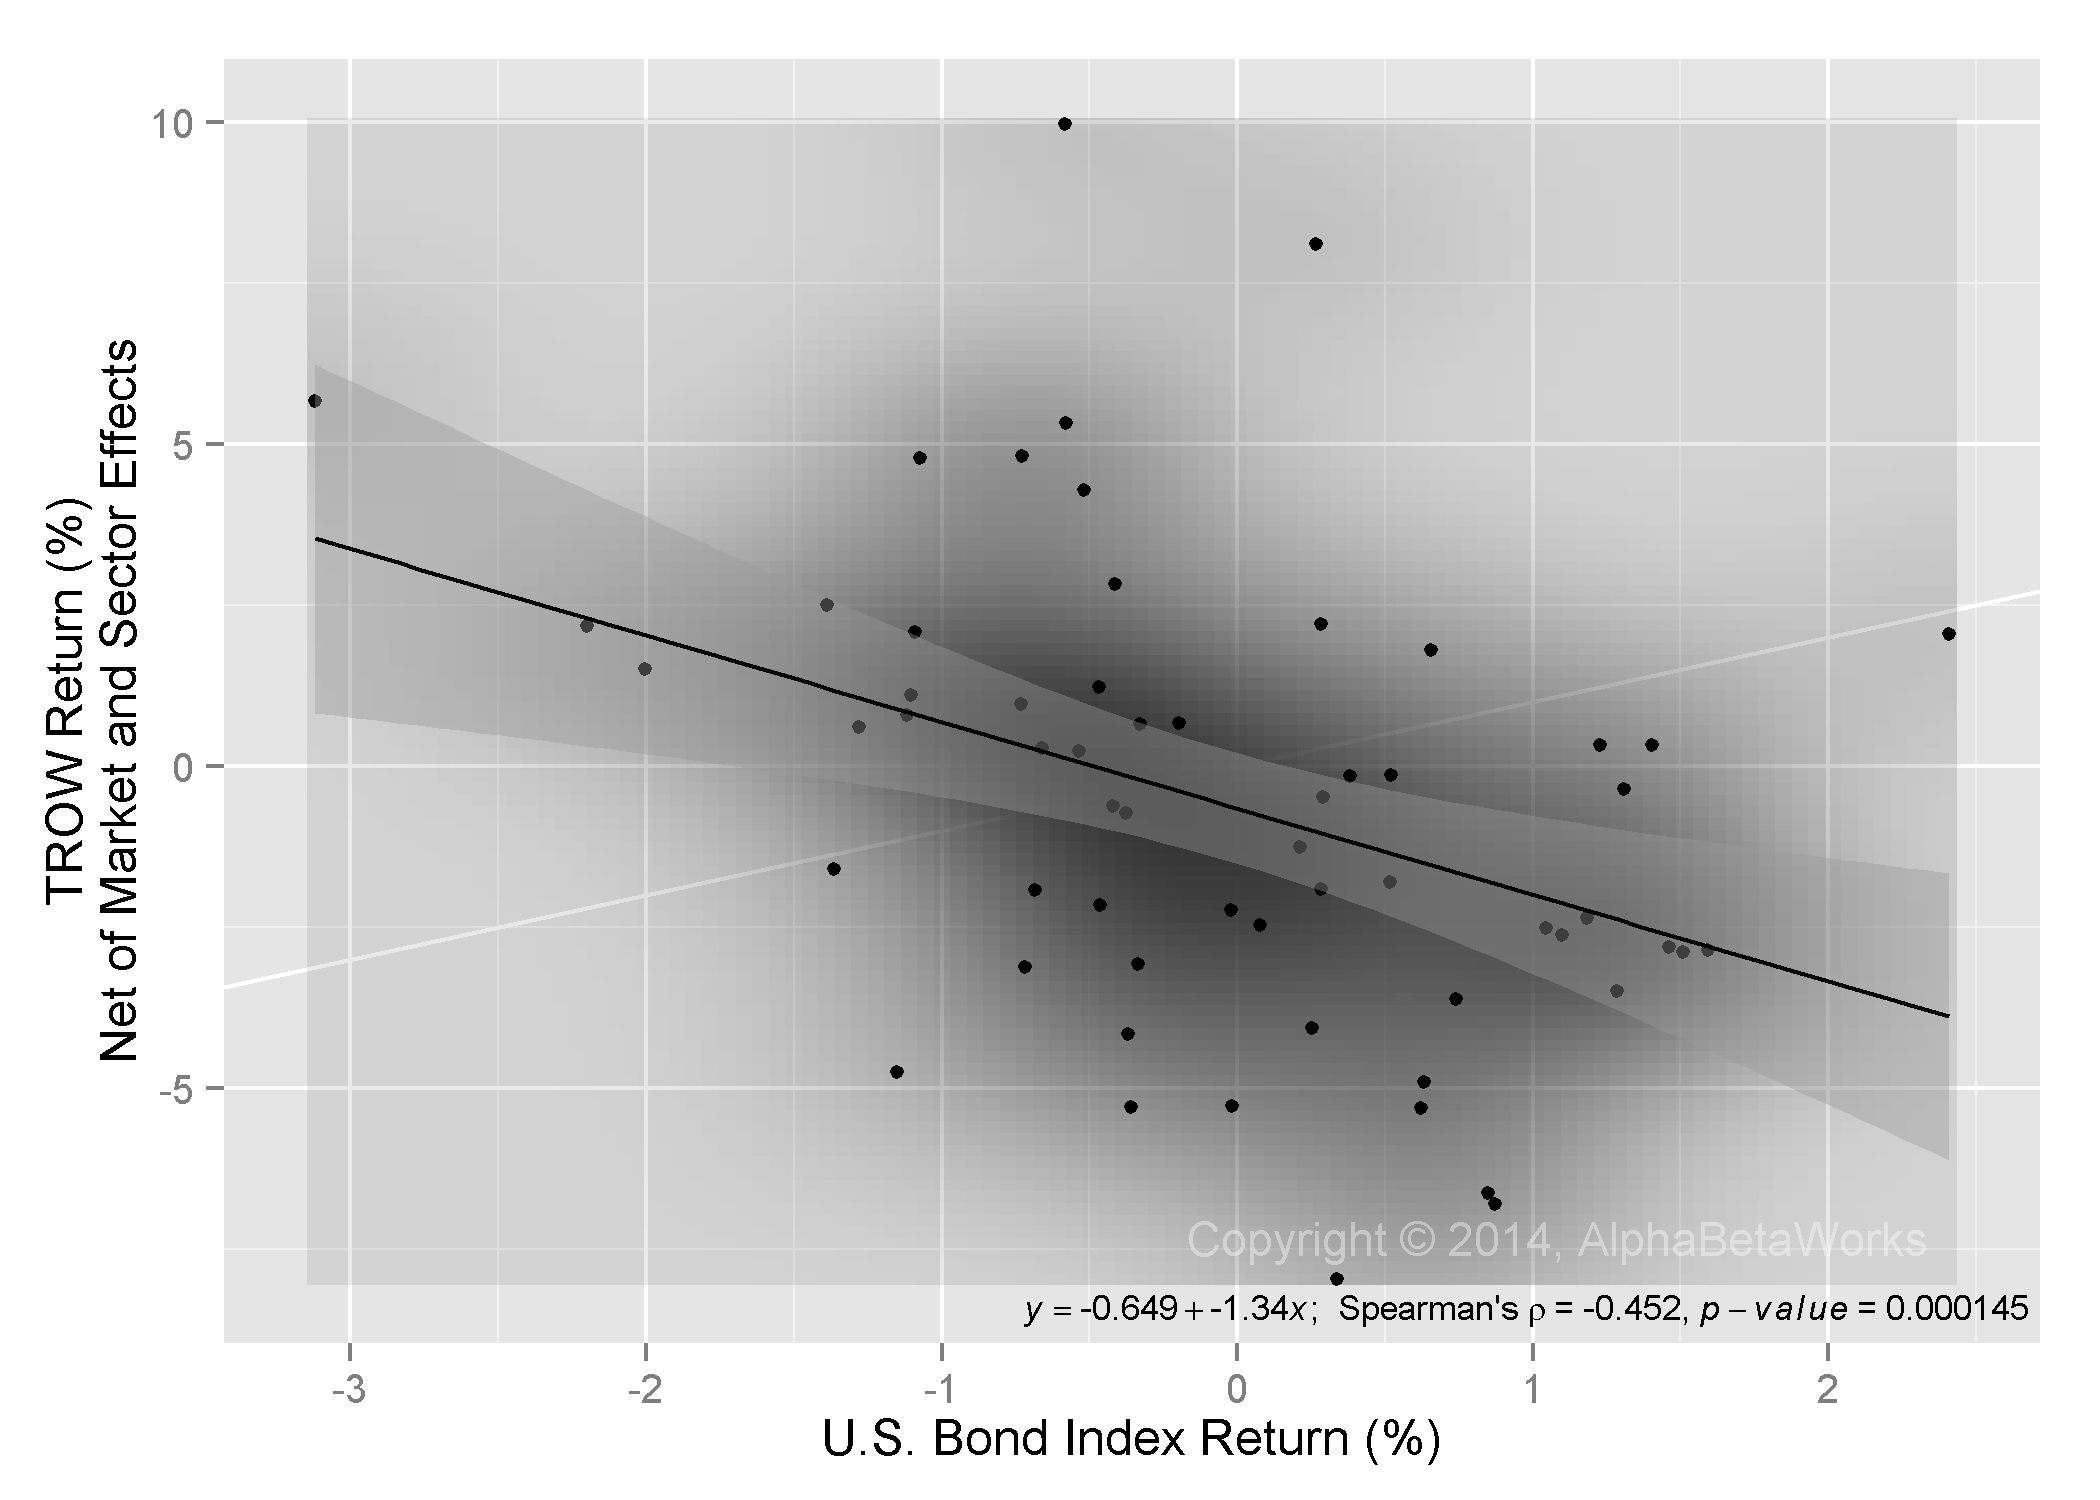
T. Rowe Price Group (TROW) Monthly Returns vs U.S. Bond Index Monthly Returns (2009-2014)
Some businesses own a relatively well-defined stream of long-duration cash flows and are structurally similar to bonds. Most REITs, Royalty Trusts, and MLPs have large and statistically significant long bond exposures. For instance, approximately 22% of the volatility of Education Realty Trust, Inc. (EDR), net of market and sector effects, is explained by bond price changes:
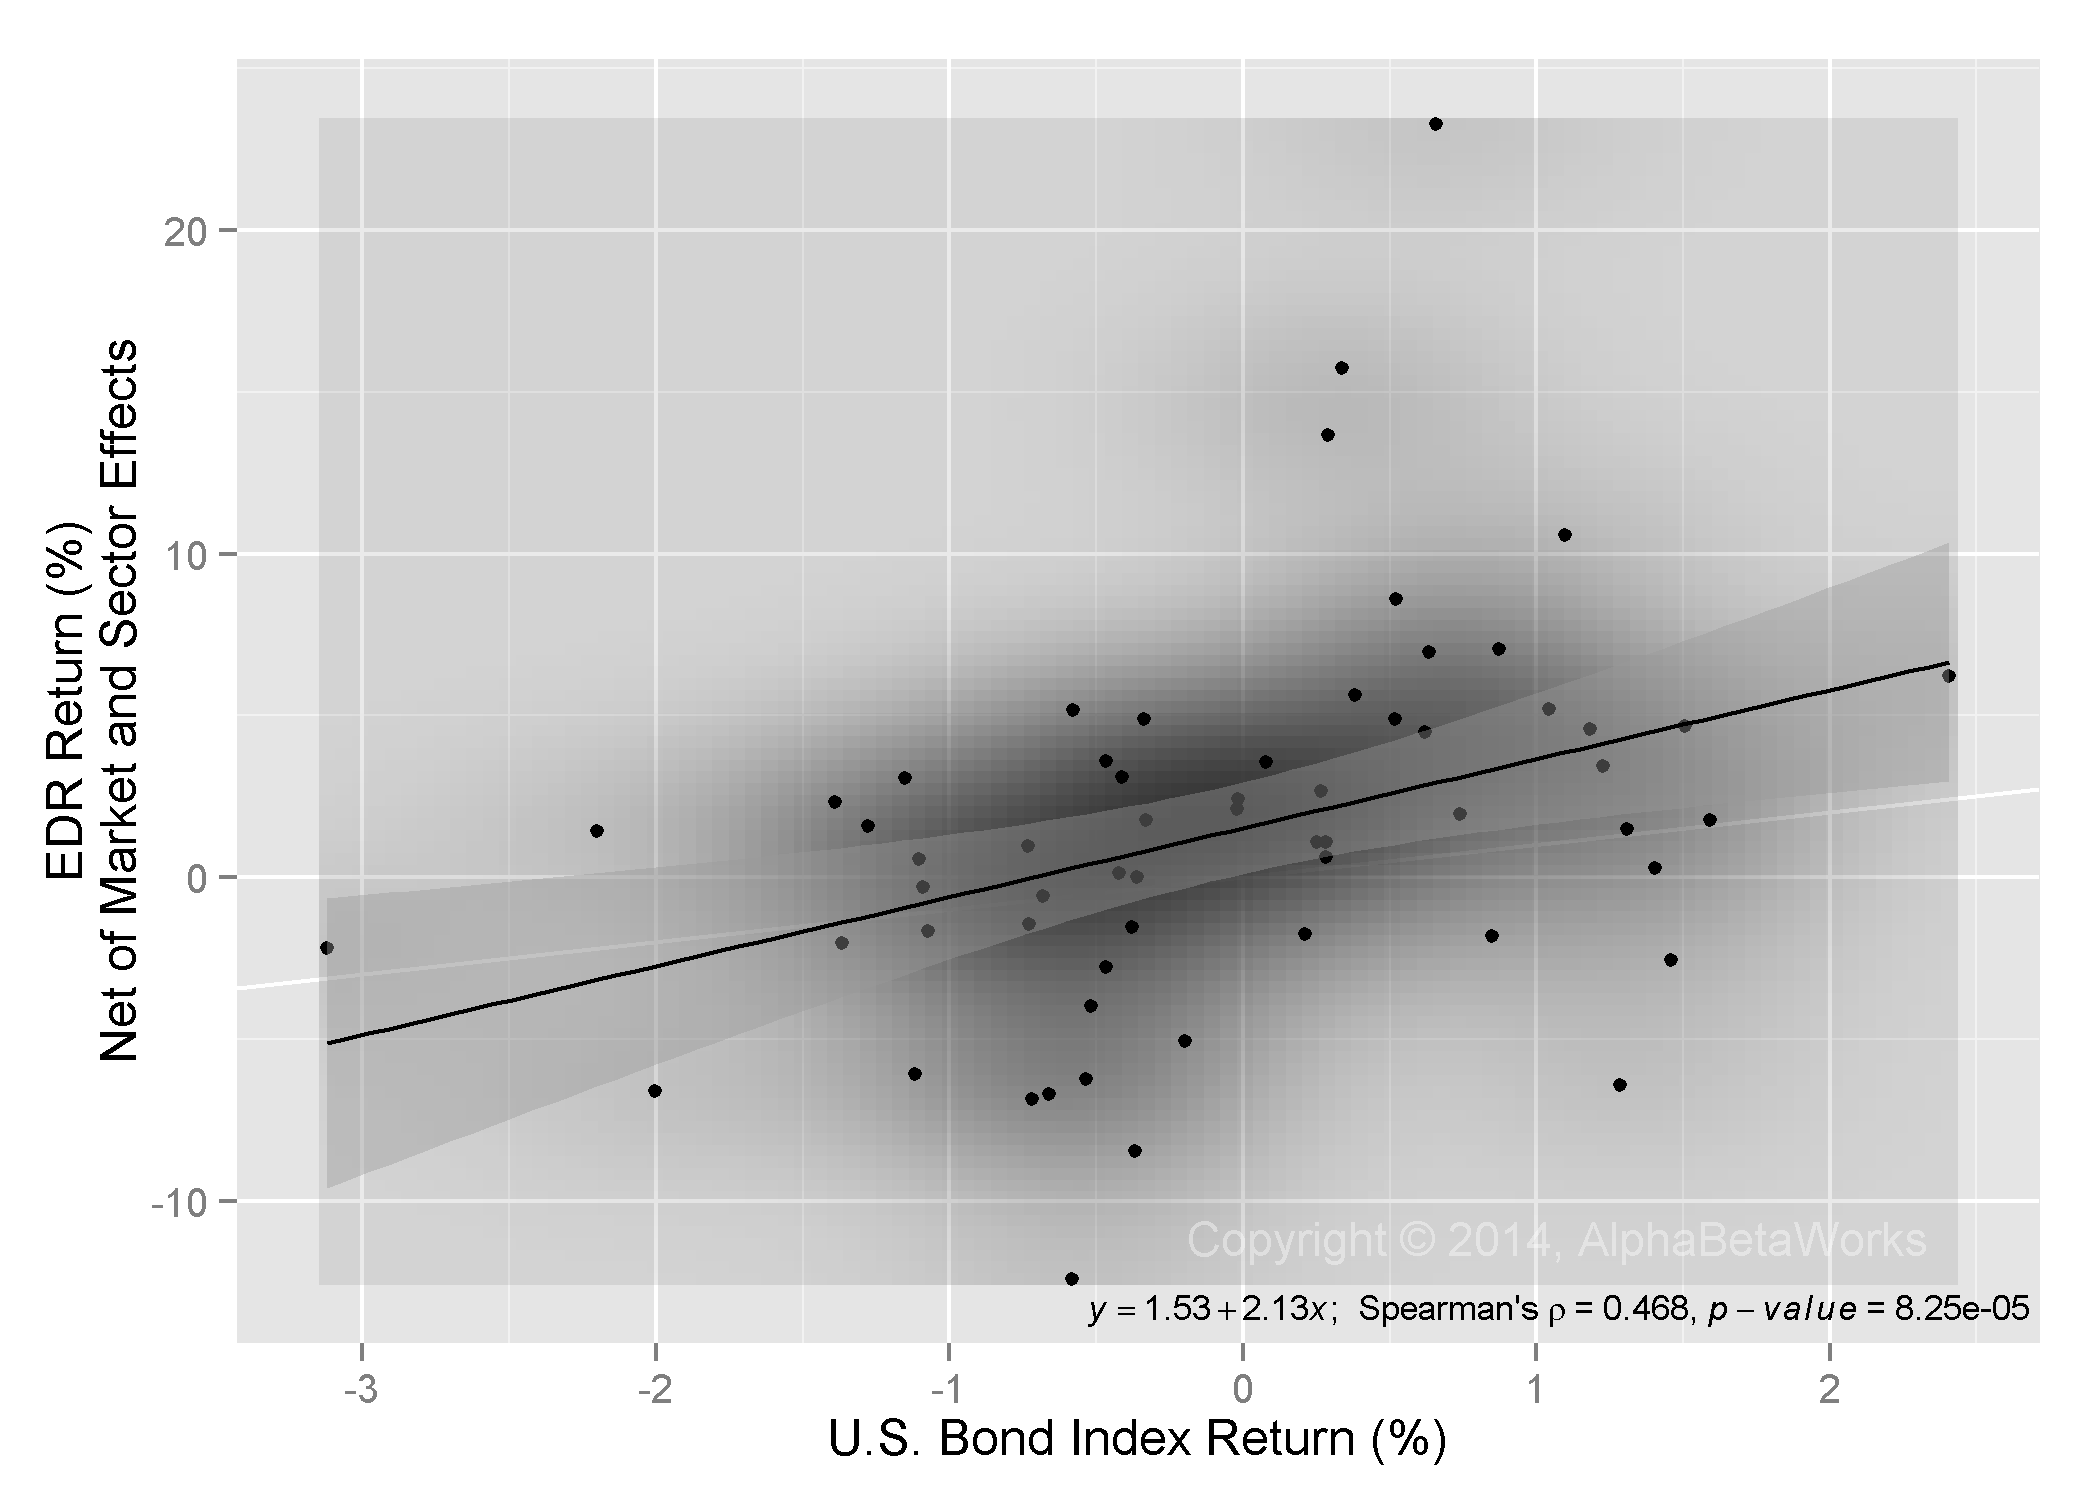
Education Realty Trust, Inc. (EDR) Monthly Returns vs U.S. Bond Index Monthly Returns (2009-2014)
Mutual Fund and Hedge Fund Volatility Due to Bond Exposure
So how important is bond exposure in practice? The AlphaBetaWorks Performance Analytics Platform regularly analyzes 15 years of portfolio and performance history of approximately 3,000 medium and lower turnover U.S. mutual funds and 400 medium and lower turnover U.S. hedge funds to determine the main sources of risk and return. For hedge funds we analyze long equity portfolios, available from 13F filings, only.
For mutual funds, bond exposure accounted for approximately 0.5% of variance – about an equal contribution to the Value/Growth Factor and the Canadian Market.
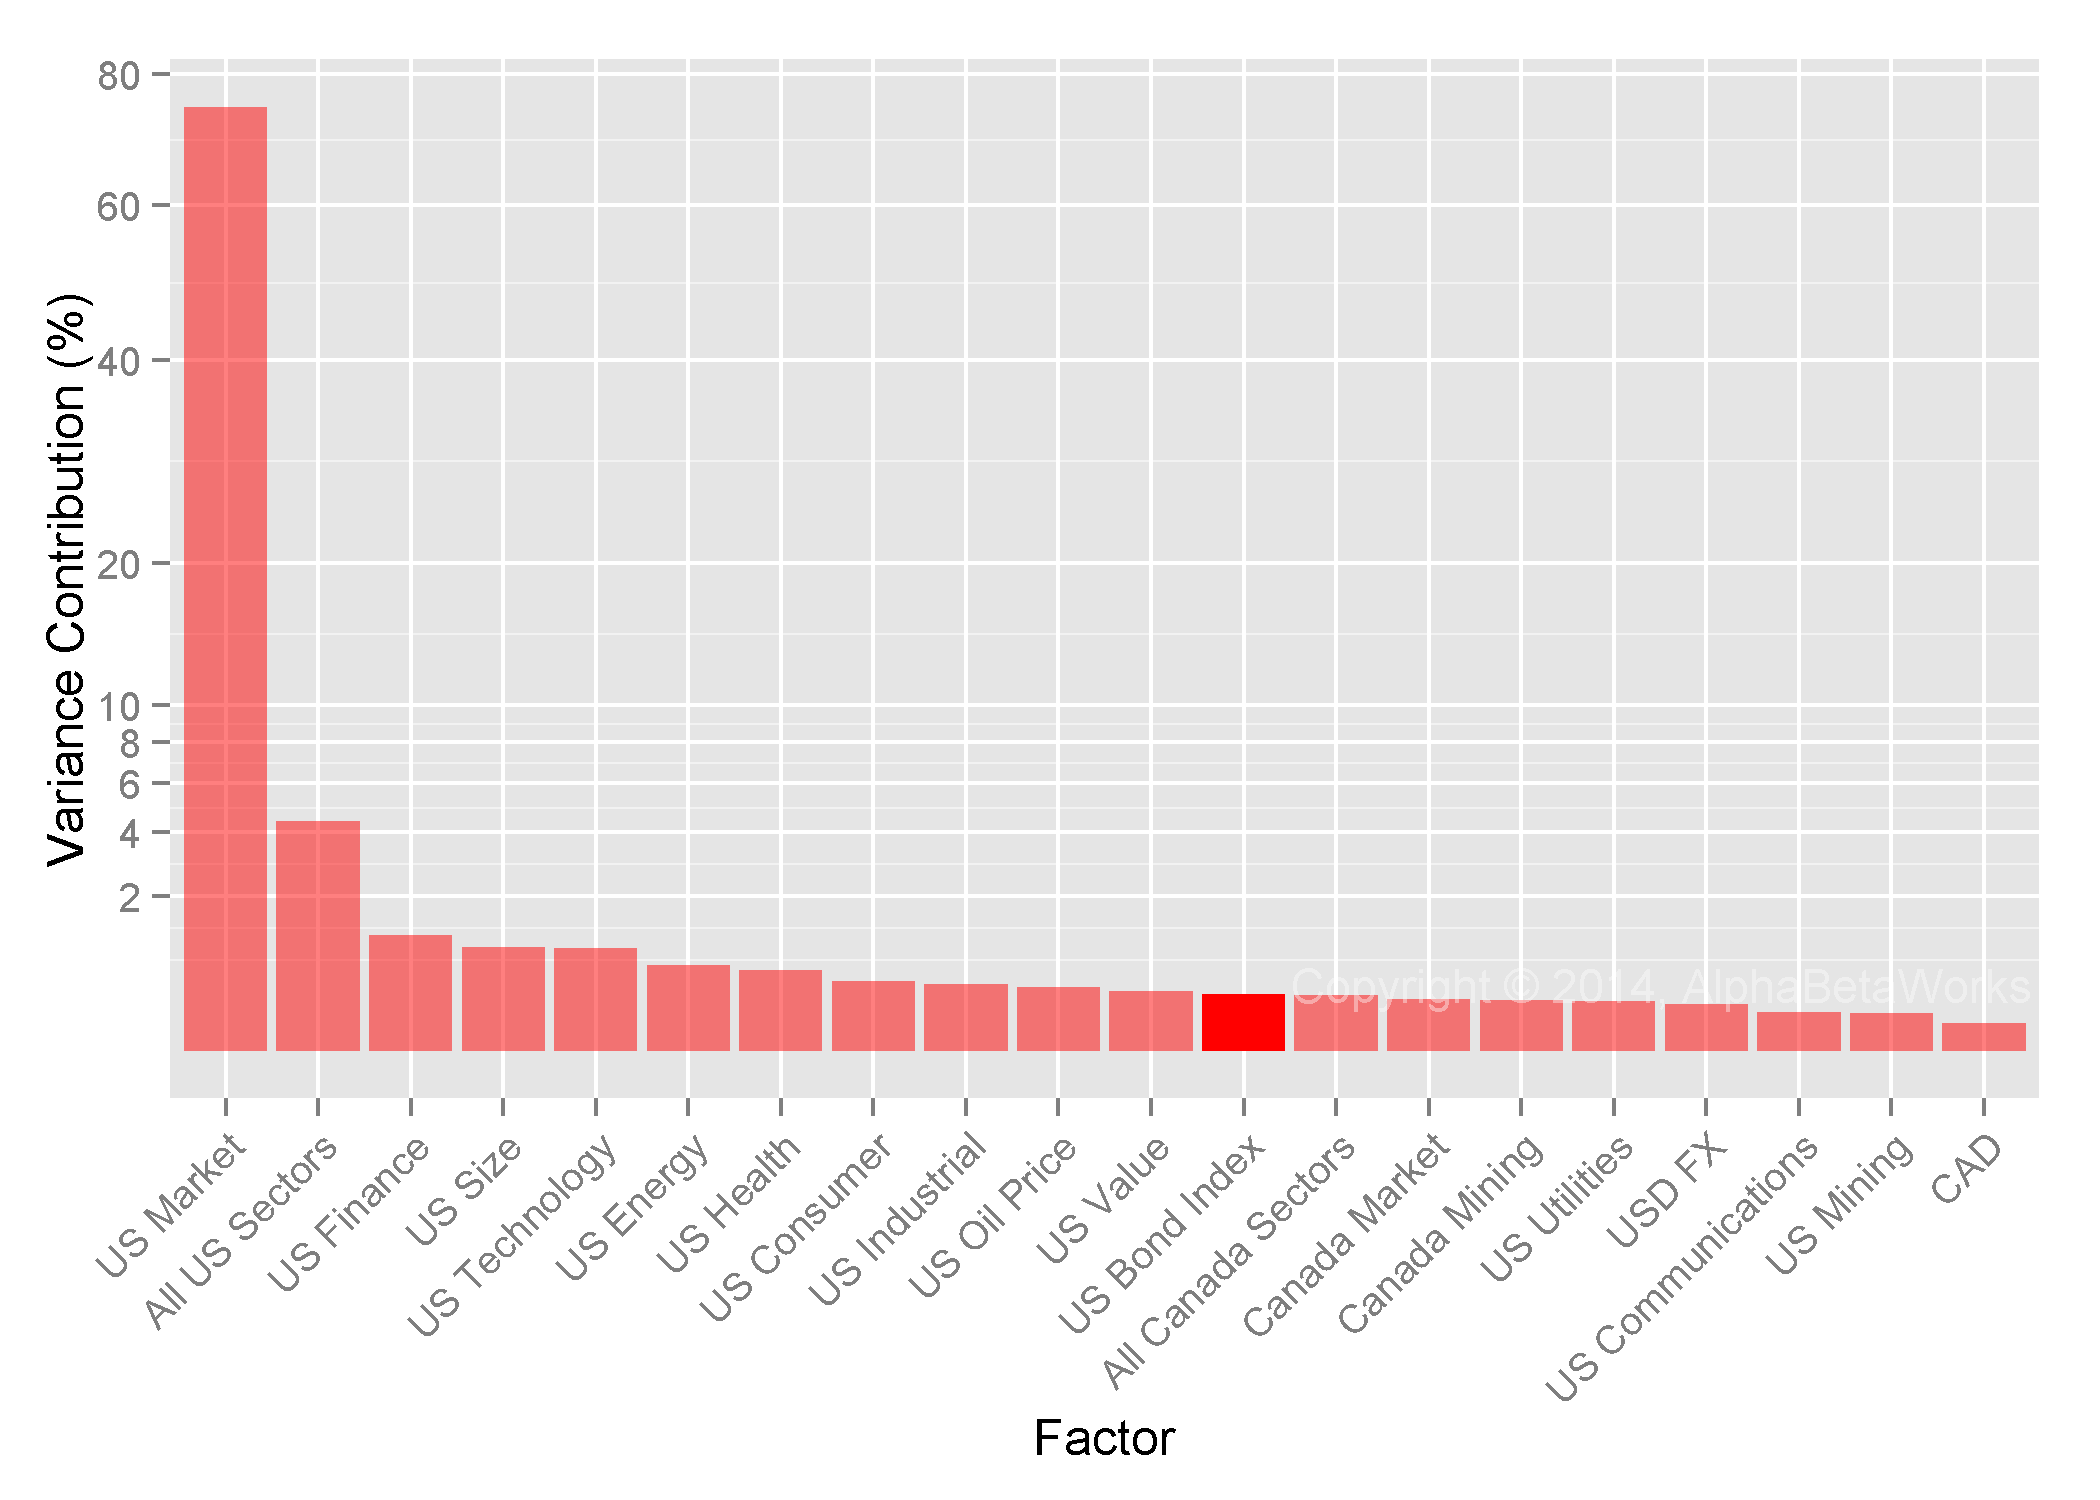
Factors Contributing to U.S. Mutual Fund Performance
For Hedge Funds, bond exposure is a more significant return driver, explaining three times more variance. The Bond Factor is the fourth most important risk factor for long hedge fund portfolios, ahead of Value/Growth, Oil Price, and Technology Sector factors. Only the Market, Finance Sector, and Size factors are more influential to hedge funds.
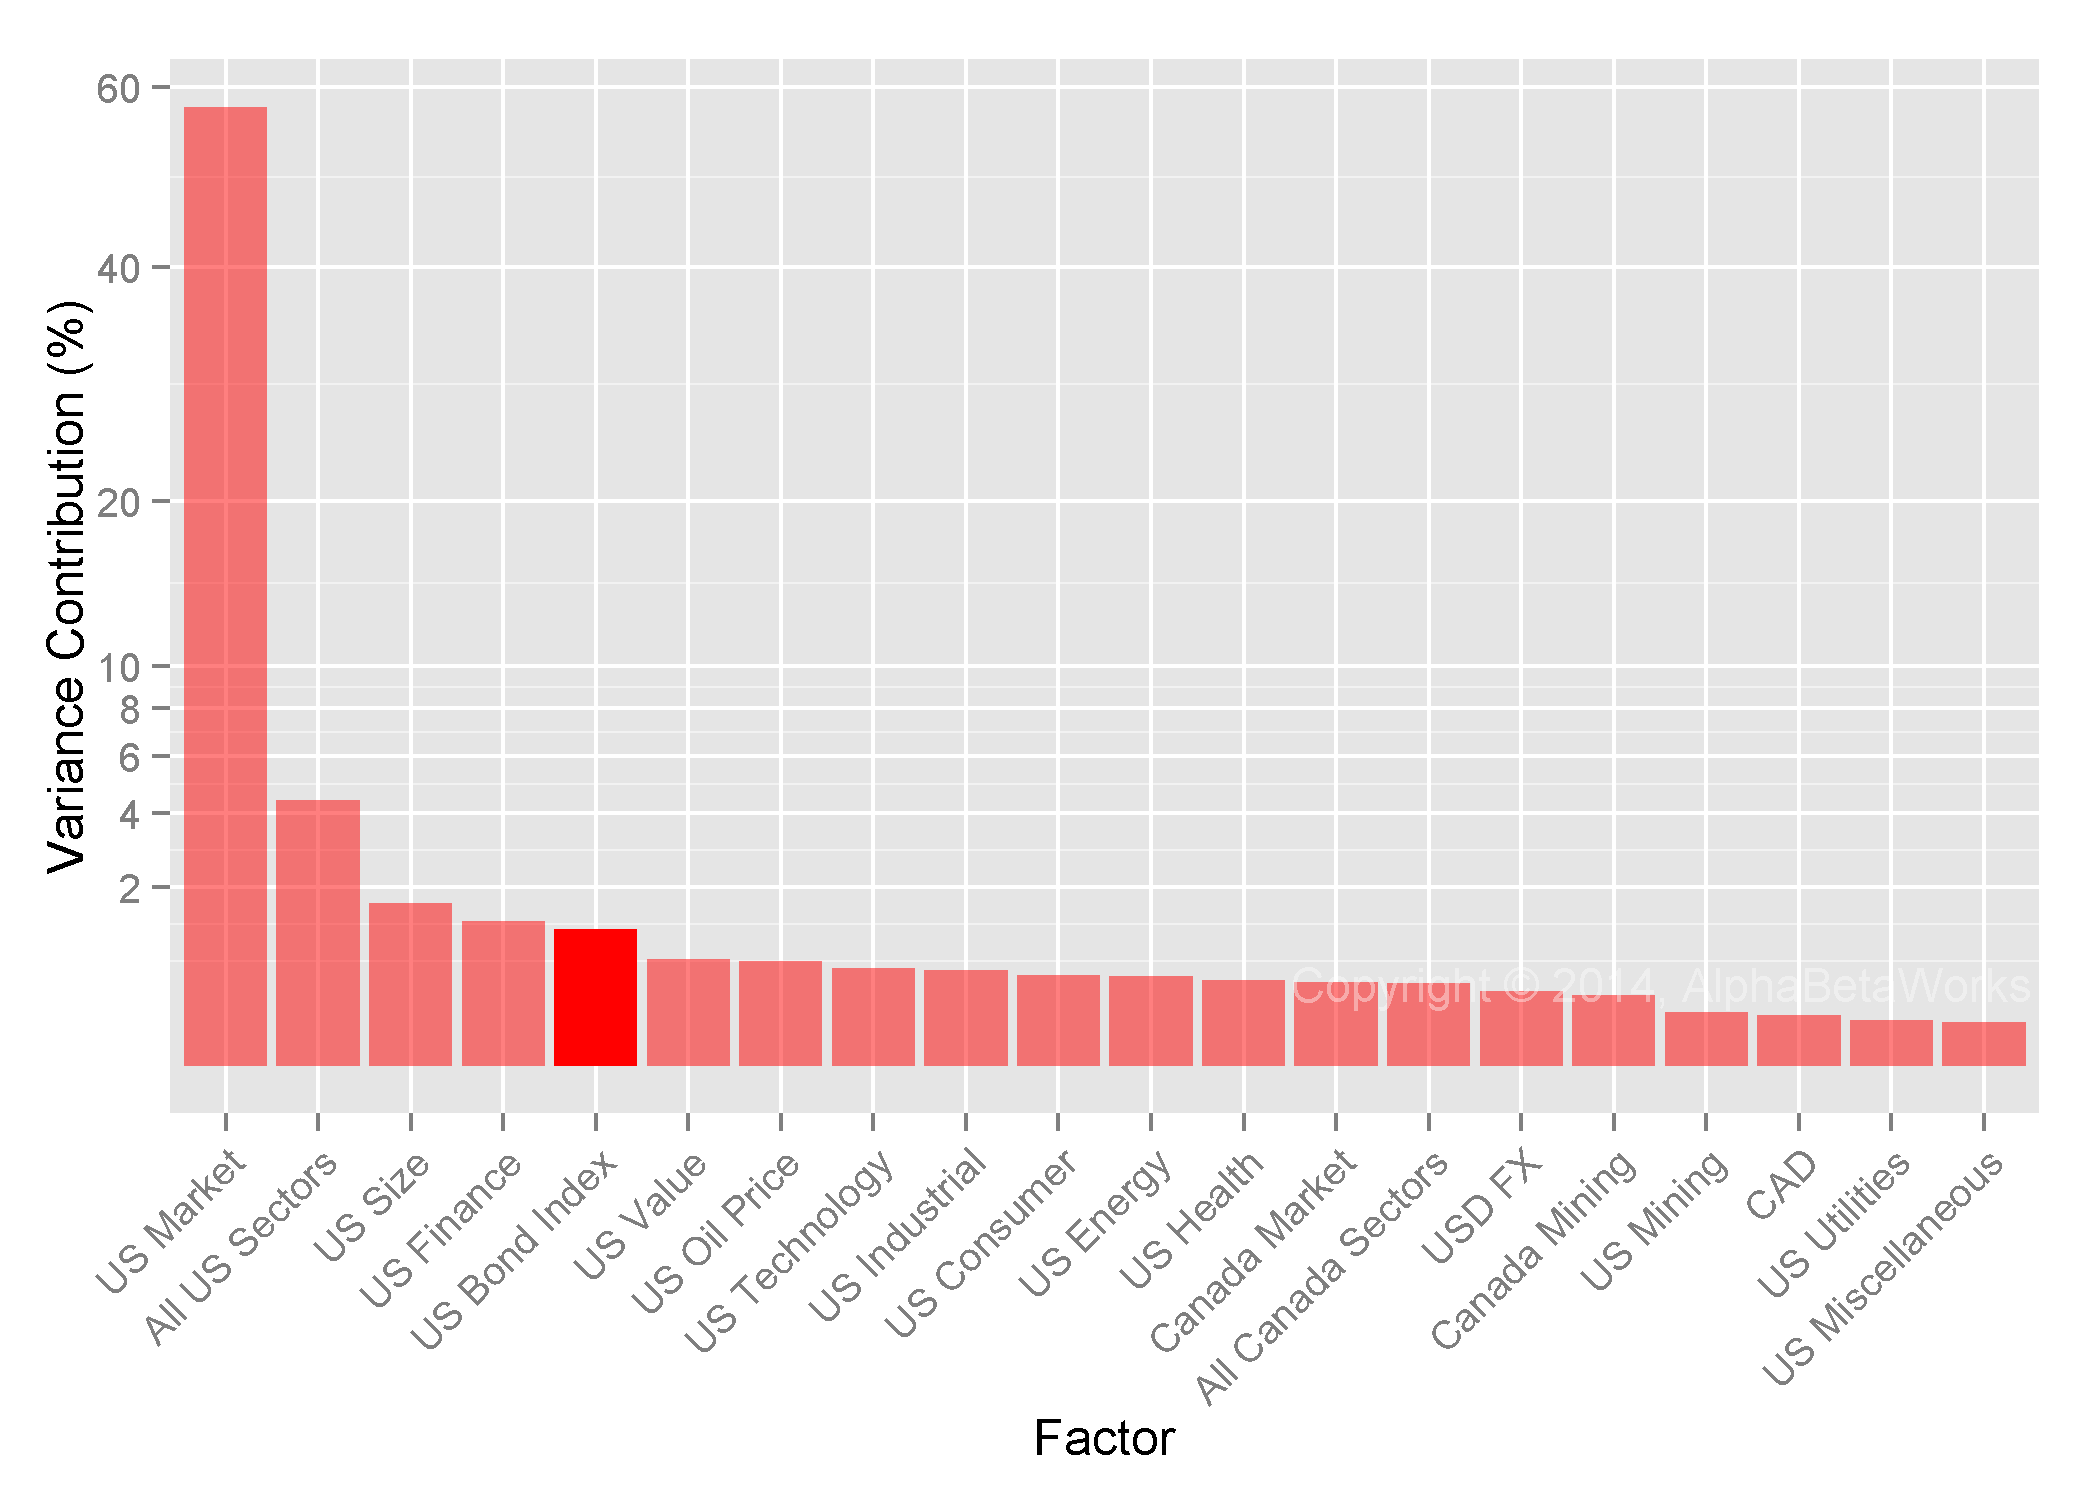
Factors Contributing to U.S. Hedge Fund Performance
The importance of bond risk to hedge funds is a natural consequence of their fondness for indebted companies and other “cheap call options,” often levered bets with embedded short bond exposures. Mind you, this is aggregate data. For many hedge funds, bond exposure is the second most important risk, after market exposure.
Mutual Funds Most Exposed to Bonds
Some U.S. mutual funds with the largest bond bets are listed below. These are the bond exposures in addition to market, sector, and style risk – also sources of bond correlation. Many carry embedded bond bets on the same scale as their AUM:
Equity Mutual Funds – Short Bond Exposure
| Symbol | Name | Bond Exposure (%) | |
| LLSCX | Longleaf Partners Small Cap Fund | -101.41 | |
| RYPNX | Royce Opportunity Fund | -100.33 | |
| HRVIX | Heartland Value Plus Fund | -73.73 | |
| HRTVX | Heartland Value Fund | -70.98 | |
| LKSCX | LKCM Small Cap Equity Fund | -68.44 | |
| VTSIX | Vanguard Tax Managed Small Cap Fund | -60.56 | |
| MSSMX | Morgan Stanley Instl. Fund-Small Company Growth Portfolio | -60.54 | |
| WCSTX | Waddell & Reed Advisors Science & Technology Fund | -57.40 | |
| HIASX | Hartford Small Company HLS Fund | -57.27 | |
| RYVPX | Royce Value Plus Fund | -56.93 | |
Equity Mutual Funds – Long Bond Exposure
| Symbol | Name | Bond Exposure (%) |
| PRMTX | T Rowe Price Media & Telecommunications Fund | 26.69 |
| TEDMX | Templeton Developing Markets Trust | 28.34 |
| HCIEX | Hirtle Callaghan International Equity Fund | 31.16 |
| WRVBX | Waddell & Reed Advisors Vanguard Fund | 33.82 |
| MIEIX | MFS Institutional International Equity Fund | 34.27 |
| OPGSX | Oppenheimer Gold & Special Minerals Fund | 83.63 |
| CSEIX | Cohen & Steers Realty Income Fund | 139.67 |
| CSRIX | Cohen & Steers Institutional Realty Shares Fund | 145.57 |
| CSRSX | Cohen & Steers Realty Shares Fund | 146.59 |
| TRREX | T Rowe Price Real Estate Fund | 154.04 |
Hedge Funds Most Exposed to Bonds
Some U.S. hedge funds with the largest bond bets are listed below. For many of these, bond returns will be the second most important driver of medium-term performance.
Long Equity Hedge Fund Portfolios – Short Bond Exposure
| Name | Bond Exposure (%) |
| ESL Investments, Inc. | -98.81 |
| Harbinger Capital Partners LLC | -86.64 |
| Starboard Value LP | -82.37 |
| Lakewood Capital Management LP | -78.32 |
| Paradigm Capital Management, Inc. | -76.12 |
| Basswood Capital Management LLC | -68.92 |
| Rima Senvest Management LLC | -68.81 |
| Fine Capital Partners LP | -65.84 |
| Palo Alto Investors LLC | -52.35 |
| Greenlight Capital, Inc. | -48.67 |
Long Equity Hedge Fund Portfolios – Long Bond Exposure
| Name | Bond Exposure (%) |
| Cushing MLP Asset Management LP | 42.71 |
| Bridgewater Associates LP | 42.99 |
| Energy Income Partners LLC | 45.24 |
| Baker Bros. Advisors LP | 47.29 |
| Kayne Anderson Capital Advisors LP | 48.13 |
| SCS Capital Management LLC | 49.55 |
| Harvest Fund Advisors LLC | 58.20 |
| Center Coast Capital Advisors LP | 58.92 |
| H Partners Management LLC | 80.39 |
| Atlantic Investment Management, Inc. | 81.61 |
Conclusions
- Hidden bond exposures in equity portfolios are often overlooked by professional investors.
- Market, style, and industry risk factors influence bond exposures in equity portfolios.
- Small capitalization stocks and funds tend to have negative bond exposures.
- Some equity securities are significantly exposed to bonds, even after accounting for market and sector risks.
- For many equity funds, bond exposure is the second most important source of risk and return.


