Typical analysis of hedge fund crowding focuses on individual stocks. This is misguided since over 85% of hedge funds’ monthly return variance is due to factor (systematic) exposures. Their residual, (idiosyncratic, or stock-specific) bets account for less than 15% of it. Likewise, factor crowding has driven much of the hedge fund industry’s performance and volatility. In Q2 2016, half of U.S. hedge funds’ long equity risk (tracking error) relative to the U.S. Market was due to a single crowded factor and two thirds was due to three crowded factors. This article reviews the most crowded bets at 6/30/2016 that have been driving hedge funds’ long equity performance.
Note that active risk is required to generate active returns and warrant management fees. Yet, not all exposures are created equal. Systematic exposures that are shared by the entire hedge fund industry and that can be obtained cheaply via index funds and ETFs do not warrant the same compensation as the distinctive insights of gifted managers. Even worse, these crowded bets expose investors to the damaging stampede of impatient capital.
Identifying Hedge Fund Crowding
We followed the approach of our earlier studies of hedge fund crowding: We processed regulatory filings of over 1,000 hedge funds and created a position-weighted portfolio (HF Aggregate) comprising all tractable hedge fund long U.S. equity portfolios. We then analyzed HF Aggregate’s risk relative to the U.S. Market. The most crowded bets are driving the hedge fund industry’s risk and performance. We identified these bets using the AlphaBetaWorks (ABW) Statistical Equity Risk Model – an effective system of forecasting future risk and performance.
Hedge Fund Industry’s Risk
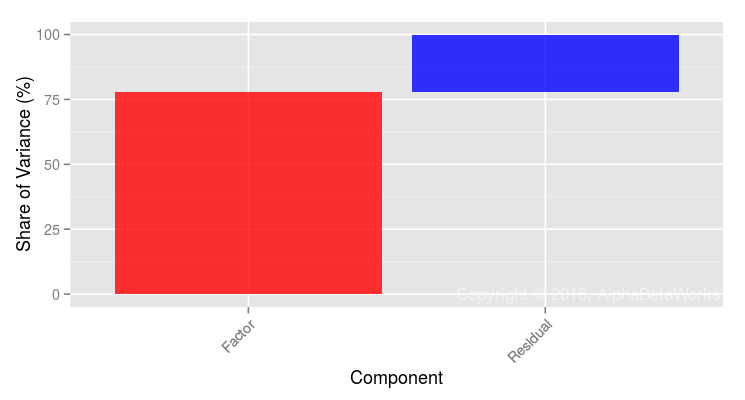
HF Aggregate had 3.5% estimated future volatility (tracking error) relative to the U.S. Market in Q2 2016. Nearly 80% of this was due to its factor (systematic) exposures, rather than individual stocks:
| Source | Volatility (ann. %) | Share of Variance (%) |
| Factor | 3.12 | 77.84 |
| Residual | 1.67 | 22.16 |
| Total | 3.54 | 100.00 |
A typical analysis of hedge fund crowding that focuses on individual stocks and popular holdings is thus misguided. It dwells on only 20% of the industry’s risk, overlooking the other 80%. Funds with no shared positions can still correlate highly when they have similar factor exposures. Consequently, such a simplistic analysis of position overlap and holdings misrepresents fund risk risk and fosters dangerous complacency.
Hedge Fund Factor (Systematic) Crowding
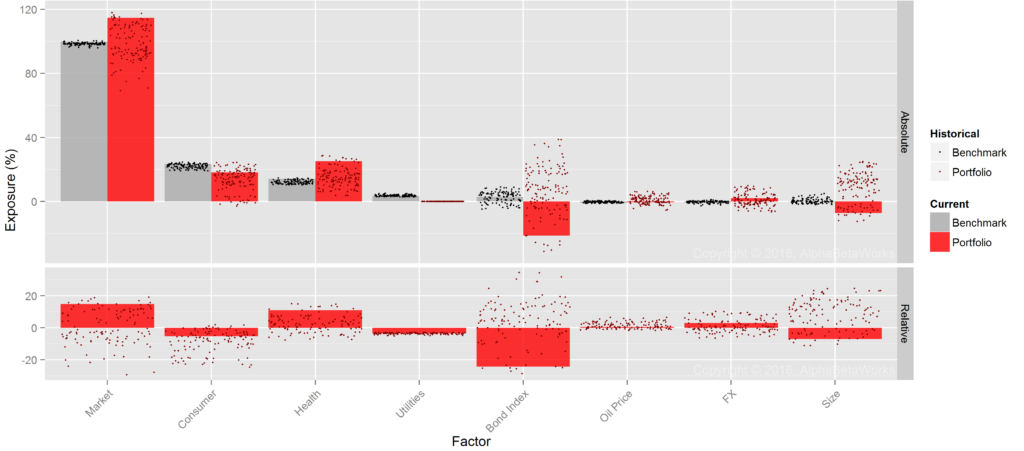
Below are HF Aggregate’s principal factor exposures (in red) relative to the U.S. Market’s (in gray). These are the primary bets behind factor risk and crowding in the table above:
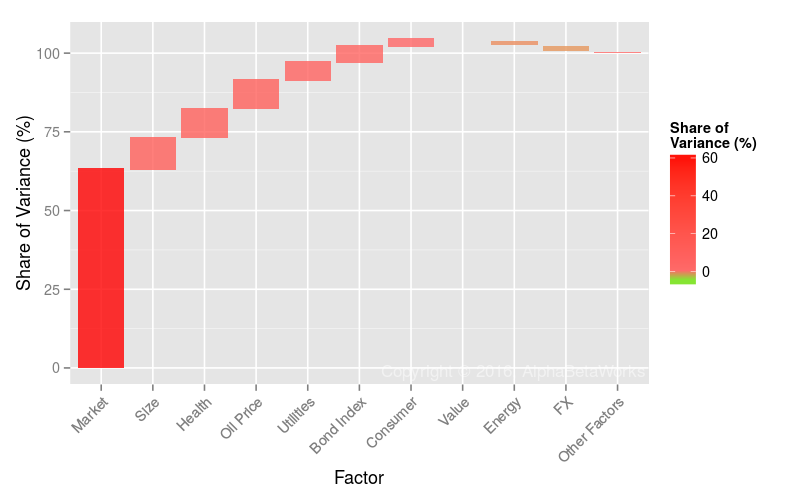
Market (Beta) is the dominant long equity bet within the hedge fund industry. It accounts for approximately two thirds of relative factor risk and half of relative total risk:
| Factor | Relative Exposure | Factor Volatility | Share of Relative Factor Variance | Share of Relative Total Variance |
| Market | 17.62 | 12.58 | 62.96 | 49.01 |
| Size | -9.39 | 8.46 | 10.00 | 7.78 |
| Health | 9.45 | 6.95 | 9.19 | 7.15 |
| Oil Price | 1.89 | 31.29 | 9.12 | 7.10 |
| Utilities | -3.74 | 12.42 | 5.71 | 4.44 |
| Bond Index | -7.90 | 3.55 | 5.01 | 3.90 |
| Consumer | -5.40 | 3.96 | 2.30 | 1.79 |
| FX | 2.18 | 7.30 | -1.99 | -1.55 |
| Energy | -2.30 | 13.44 | -1.62 | -1.26 |
| Value | -1.81 | 13.33 | -0.53 | -0.41 |
(Relative exposures and relative variance contribution. All values are in %. Volatility is annualized.)
The most crowded long equity bet is high systematic exposure to the U.S. Market – not any particular stock. In fact, high systematic market risk is more important to U.S. hedge fund long portfolios than all of their stock-specific bets combined. This makes the popular fascination with fund holdings and position overlap particularly dangerous. As factor crowding continues to dominate stock-specific risk and stock picking skill, the survival of asset managers and allocators increasingly relies on their grasp of systematic crowding and the predictive power of their risk management systems.
Hedge Fund U.S. Market Factor Crowding
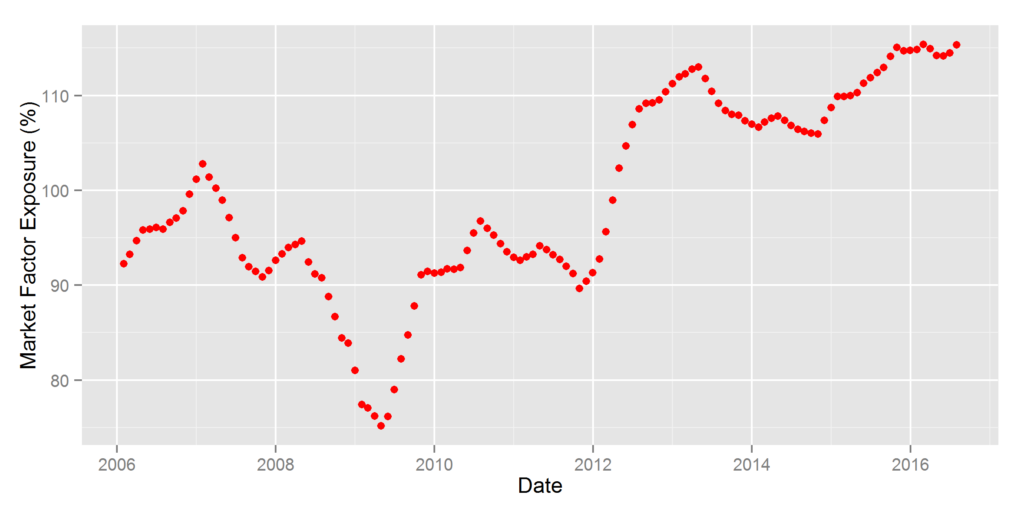
The current Market Factor Exposure of HF Aggregate is approximately 115% (its Market Beta is approximately 1.15). This exposure has remained above 100% since 2012:
The average hedge fund long equity portfolio now carries approximately 15% more market risk than the Russell 3000 Index and approximately 20% more than the slightly less risky S&P 500 Index. This higher exposure illustrates the danger of evaluating them relative to broad benchmarks. In a year when S&P 500 returns 10%, the average hedge fund would need to return approximately 12% to match what investors would have earned by taking the same risk passively.
Hedge Fund U.S. Size Factor Crowding
The ABW Size Factor is the difference in returns, net of market and sector effects, between the largest and the smallest stocks. It is closely related to the Fama–French SMB Factor, but includes critical fixes: The ABW Size Factor strips out market and sector effects from security returns, revealing pure size risk. By contrast, SMB Factor captures size risk together with market beta and sector effects, since market exposure and sector composition differ between small- and large-cap stocks. This market and sector noise in the SMB Factor makes accurate risk estimation challenging and accurate performance attribution impossible.
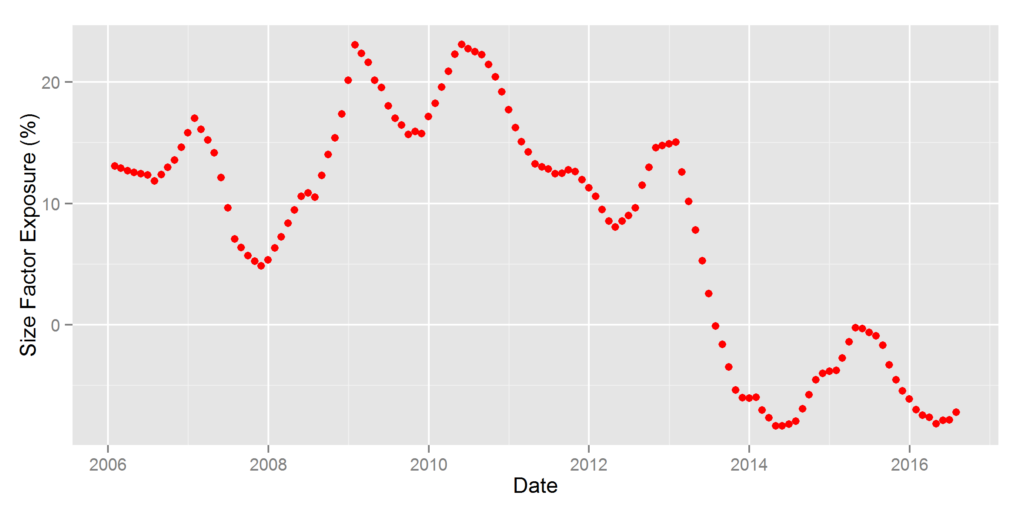
Negative Size exposure corresponds to small-cap risk. Hedge fund long equity portfolios currently have near-record small-cap exposure, equivalent to an approximately 10% bet on small company outperformance:
Hedge Fund U.S. Health Factor Crowding
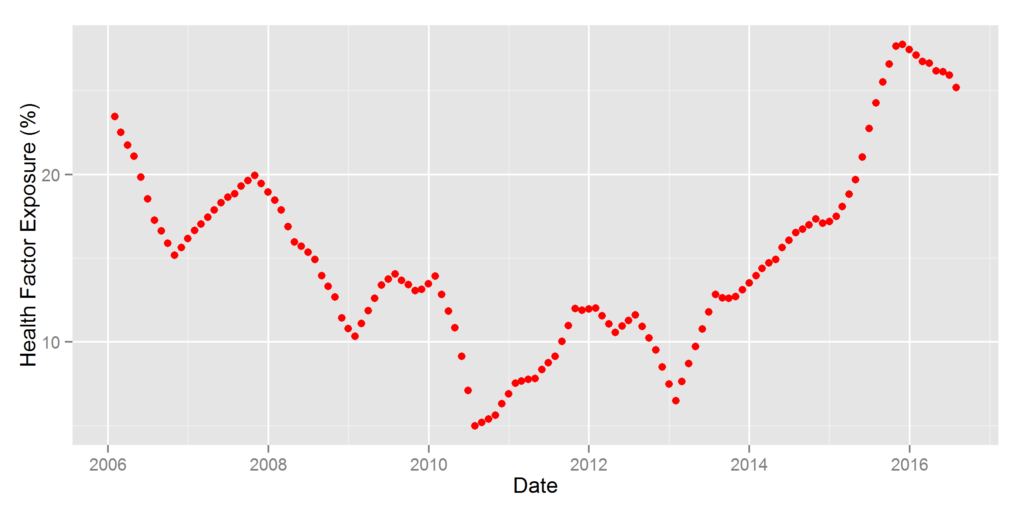
Current hedge fund Heath Factor exposure remains near an all-time high:
Hedge Fund Residual (Idiosyncratic) Crowding
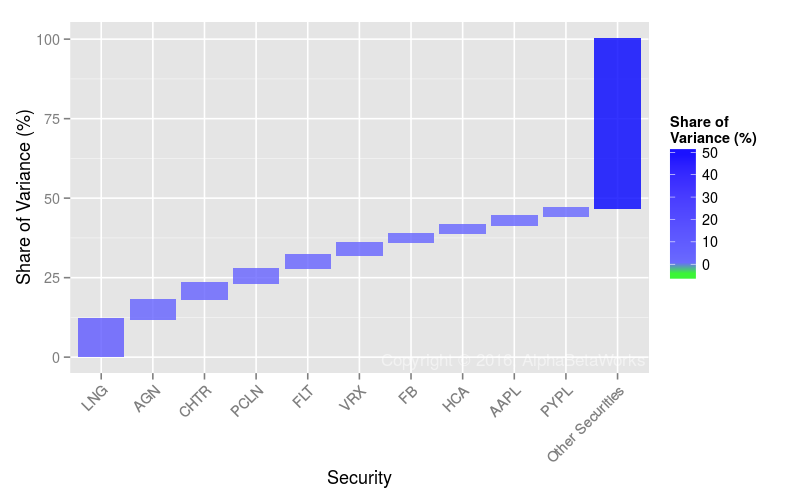
As of 6/30/2016, a quarter of hedge fund crowding was due to residual (idiosyncratic, stock-specific) risk. As factor crowding increased, residual crowding has diminished. Thus, stock-specific risk and stock-picking still have faded in importance:
| Symbol | Name | Relative Exposure | Residual Volatility | Share of Relative Residual Variance | Share of Relative Total Variance |
| LNG | Cheniere Energy | 1.65 | 34.66 | 11.77 | 2.61 |
| AGN | Allergan plc | 2.79 | 14.71 | 6.06 | 1.34 |
| CHTR | Charter Communications | 1.84 | 20.58 | 5.16 | 1.14 |
| PCLN | Priceline Group | 1.61 | 22.25 | 4.64 | 1.03 |
| FLT | FleetCor Technologies | 1.74 | 19.87 | 4.29 | 0.95 |
| VRX | Valeant Pharmaceuticals | 0.82 | 39.76 | 3.85 | 0.85 |
| FB | Facebook, Inc. Class A | 0.89 | 31.39 | 2.84 | 0.63 |
| HCA | HCA Holdings | 1.21 | 22.78 | 2.76 | 0.61 |
| AAPL | Apple Inc. | -1.68 | 16.41 | 2.74 | 0.61 |
| PYPL | PayPal Holdings Inc | 1.66 | 15.88 | 2.49 | 0.55 |
(Relative exposures and relative variance contribution. All values are in %. Volatility is annualized.)
The most crowded stocks continue to be sensitive to asset flows in and out of the industry. Yet, in the current environment of extreme systematic hedge fund crowding, allocators and fund followers should continue to pay more attention to factor risk. Indeed, allocators invested in a seemingly diversified portfolio of hedge funds may, in fact, be paying high active fees for a passive factor portfolio.
Summary
- At Q2 2016, nearly 80% of hedge funds’ relative long equity risk was due to factor, or systematic, exposures.
- The main source of Q2 2016 hedge fund crowding, responsible for half of long equity tracking error, was record U.S. Market exposure.
- Short Size Factor (small-cap bias) and long Health Factor exposures were the next most crowded bets, both near their historic extremes.
- Given high current hedge fund factor crowding, an analysis of aggregate and individual hedge funds must focus on systematic exposures and risk shared across positions, and not solely on individual positions.
- Fund investors, followers, and allocators must monitor whether they are investing in exceptional insights or generic factor exposures otherwise available via cheap passive instruments.

