Real-world restrictions on hedge fund investing wreak havoc on common allocation strategies
Common return measures fail to predict future hedge fund performance. More important, under typical allocation and withdrawal constraints, these failures due to mean reversion become more severe:
- Portfolios based on top nominal returns and win/loss ratios tend to under-perform.
- Portfolios based on top Sharpe ratios don’t outperform.
- Portfolios based on predictive skill analytics and robust factor models continue to consistently outperform.
To illustrate, we follow the approach of our earlier pieces on hedge funds: Our dataset spans the long portfolios of all U.S. hedge funds active over the past 15 years that are tractable using 13F filings. Top- and bottom-performing portfolios are selected based on 36 months of performance history.
But here we impose realistic allocation constraints: a 6-month delay between holdings reporting and fund investment, plus a bi-annual window for investments into, or withdrawals from, hedge funds. For example, an allocator who wishes to invest in a fund using 12/31/2013 data can only do so on 6/30/2014 and cannot redeem until 12/31/2014. These practical liquidity restrictions deepen the impact of hedge fund mean reversion.
Hedge Fund Selection Using Nominal Returns
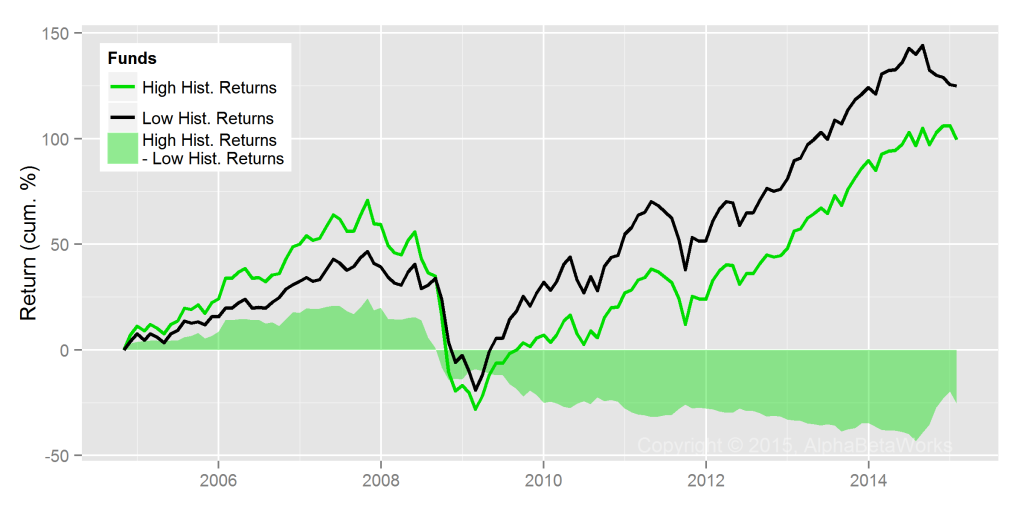
The following chart tracks two simulated funds of hedge funds. One contains the top-performing 5% and the other the bottom-performing 5% of hedge fund U.S. equity long books. We use a 36-month trailing performance look-back; investments are made with a six-month delay (as above):
|
Cumulative Return (%) |
Annual Return (%) |
|
| High Historical Returns |
99.54 |
6.74 |
| Low Historical Returns |
125.12 |
7.92 |
| High – Low Returns |
-25.57 |
-1.18 |
The chart reveals several regimes of hedge fund mean reversion: In a monotonically increasing market, such as 2005-2007, relative nominal performance persists; funds with the highest systematic risk outperform. When the regime changes, however, they under-perform. At the end of 2008, the top nominal performers are those taking the lowest systematic risk. In 2009, as the regime changes again, these funds under-perform.
Hedge Fund Selection Using Sharpe Ratios
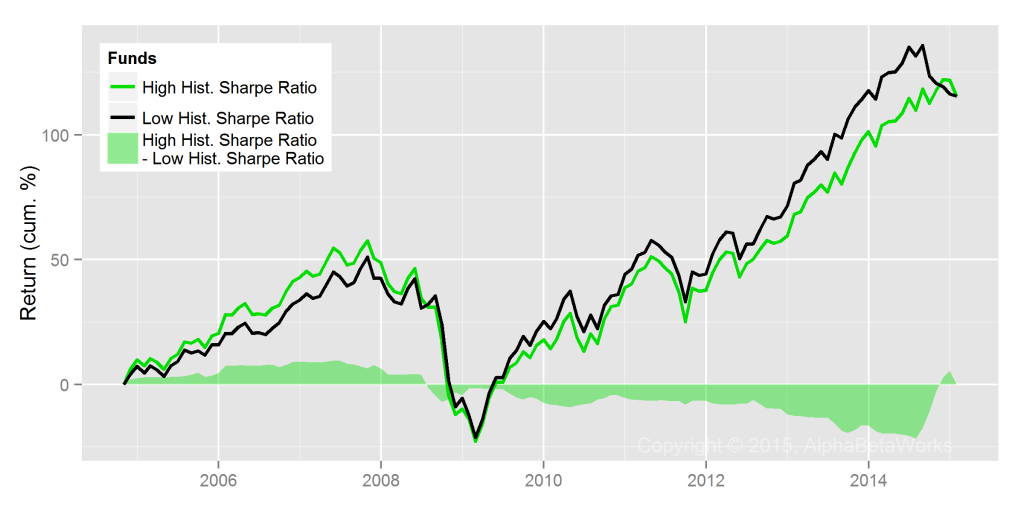
The following chart tracks portfolios of funds with the top 5% and bottom 5% Sharpe ratios:
|
Cumulative Return (%) |
Annual Return (%) |
|
| High Historical Sharpe Ratios |
115.31 |
7.48 |
| Low Historical Sharpe Ratios |
115.52 |
7.49 |
| High – Low Sharpe Ratios |
-0.20 |
-0.01 |
Since Sharpe ratio simply re-processes nominal returns, and only partially adjusts for systematic risk, it also fails when market regimes change. However, it is less costly. While Sharpe ratio may not be predictive under practical constraints of hedge fund investing, at least (unlike nominal returns) it does little damage.
Hedge Fund Selection Using Win/Loss Ratios
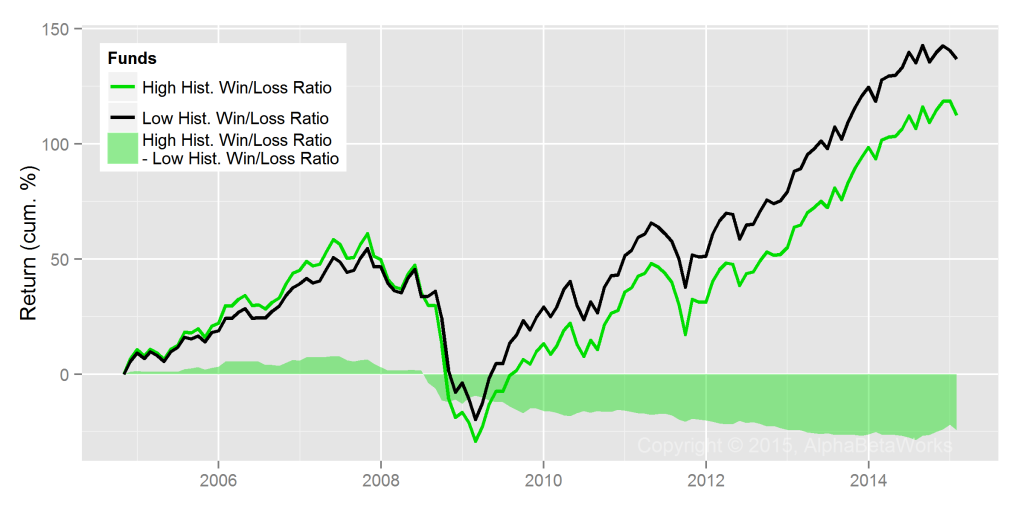
The following chart tracks portfolios of funds with the top 5% and the bottom 5% win/loss ratios, related to the batting average. These are examples of popular non-parametric approaches to skill evaluation:
|
Cumulative Return (%) |
Annual Return (%) |
|
| High Historical Win/Loss Ratios |
112.41 |
7.35 |
| Low Historical Win/Loss Ratios |
136.86 |
8.41 |
| High – Low Win/Loss Ratios |
-24.45 |
-1.06 |
The win/loss ratio suffers from the same challenges as nominal returns: Win/loss ratio favors funds with the highest systematic risk in the bullish regimes and funds with the lowest systematic risk in the bearish regimes. As with nominal returns, this can be predictive while market trends continue. When trends change, the losses are especially severe under liquidity constraints.
Hedge Fund Selection Using αReturns
Systematic (factor) returns that make up the bulk of portfolio volatility are the primary source of mean reversion. Proper risk adjustment with a robust risk model controls for factor returns; it addresses mean reversion and identifies residual returns due to security selection.
AlphaBetaWorks’ measure of residual security selection performance is αReturn – outperformance relative to a replicating factor portfolio. αReturn is also the return a portfolio would have generated if markets had been flat.
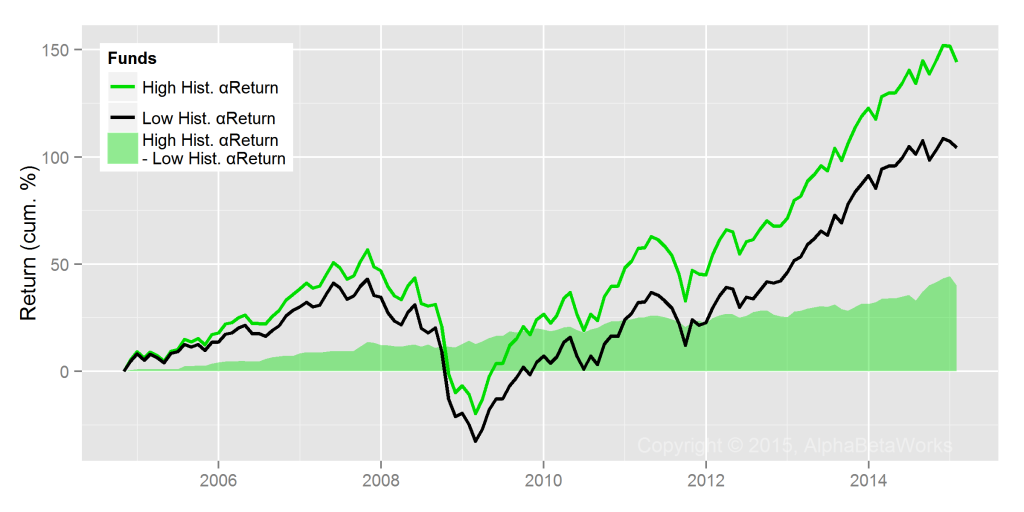
The following chart tracks portfolios of funds with the top 5% and the bottom 5% αReturns. These portfolios have matching factor exposures:
|
Cumulative Return (%) |
Annual Return (%) |
|
| High Historical αReturns |
144.33 |
8.72 |
| Low Historical αReturns |
104.25 |
6.97 |
| High – Low αReturns |
40.08 |
1.75 |
Even with the same 6-month investment delay and bi-annual liquidity constraints, long portfolios of the top stock pickers outperformed long portfolios of the bottom stock pickers by 40% cumulatively over the past 10 years.
This outperformance has been consistent. Indeed, top stock pickers (high αReturn funds) have continued to do well in recent years. Security selection results of the industry’s top talent are strong. Widespread discussions of the difficulty of generating excess returns in 2014 reflect the sorry state of commonly used risk and skill analytics.
Conclusions
- Due to hedge fund mean reversion, yesterday’s nominal winners tend to become tomorrow’s nominal losers.
- Under typical hedge fund liquidity constraints, mean reversion is aggravated. Funds of top performing hedge funds under-perform.
- Re-processing nominal returns does not eliminate mean reversion:
- Funds with top and bottom Sharpe ratios perform similarly;
- Funds with top win/loss ratios underperform funds with bottom win/loss ratios.
- Risk-adjusted returns from security selection (stock picking) persist. Robust skill analytics, such as αReturn, identify strong future stock pickers.


