Why Returns-Based Style Analysis Breaks for Smart Beta Strategies
Smart beta (SB) strategies tend to vary market beta and other factor exposures (systematic risk) over time. Consequently, market timing is an important source of their risk-adjusted returns, at times more significant than security selection. We have previously discussed that returns-based style analysis (RBSA) and similar methods fail for portfolios that vary exposures. Errors are most pronounced for the most active funds:
- Estimates of a fund’s historical and current systematic risks may be flawed.
- Excellent low-risk funds may be incorrectly deemed poor.
- Poor high-risk funds may be incorrectly deemed excellent.
Due to the variation in Smart Beta strategies’ exposures over time, returns-based methods tend to fail for these strategies as well.
Three Smart Beta Strategies
We analyze the historical risk of three SB strategies as implemented by the following ETFs:
SPLV indexes 100 stocks from the S&P 500 with the lowest realized volatility over the past 12 months. PRF indexes the largest US equities based on book value, cash flow, sales, and dividends. SPHQ indexes the constituents of the S&P 500 with stable earnings and dividend growth.
All three smart beta strategies varied their factor exposures including their market exposures.
Low Volatility ETF (SPLV) – Market Timing
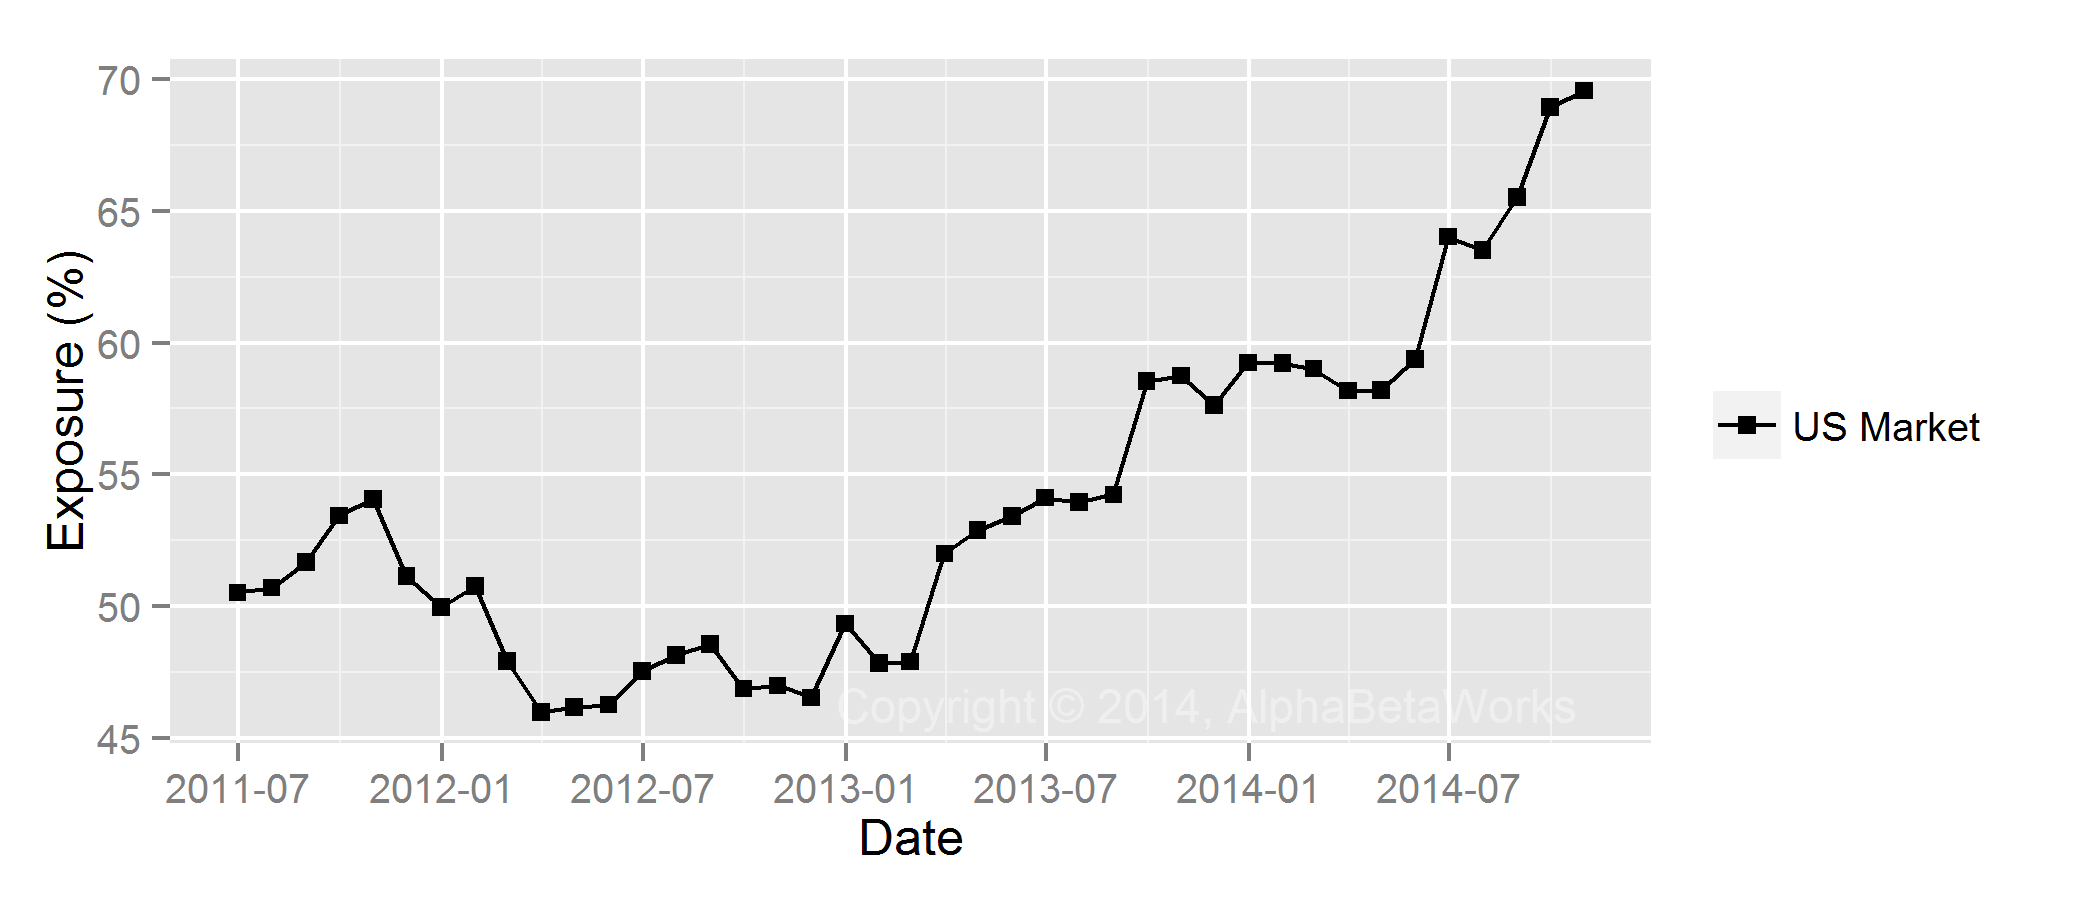
The low-volatility smart beta strategy has varied its market exposure significantly, increasing it by half since 2011. As stocks with the lowest volatility – and their risk – changed over time, the fund implicitly timed the broad equity market. The chart below depicts the market exposure of SPLV over time:

PowerShares S&P 500 Low Volatility Portfolio ETF (SPLV) – Historical U.S. Market Exposure
Low Volatility ETF (SPLV) – Historical Factor Exposures
SPLV’s market exposure fluctuates due to changes in its sector bets. Since the market betas of sectors differ from one another, as sector exposures vary so does the fund’s market exposure:
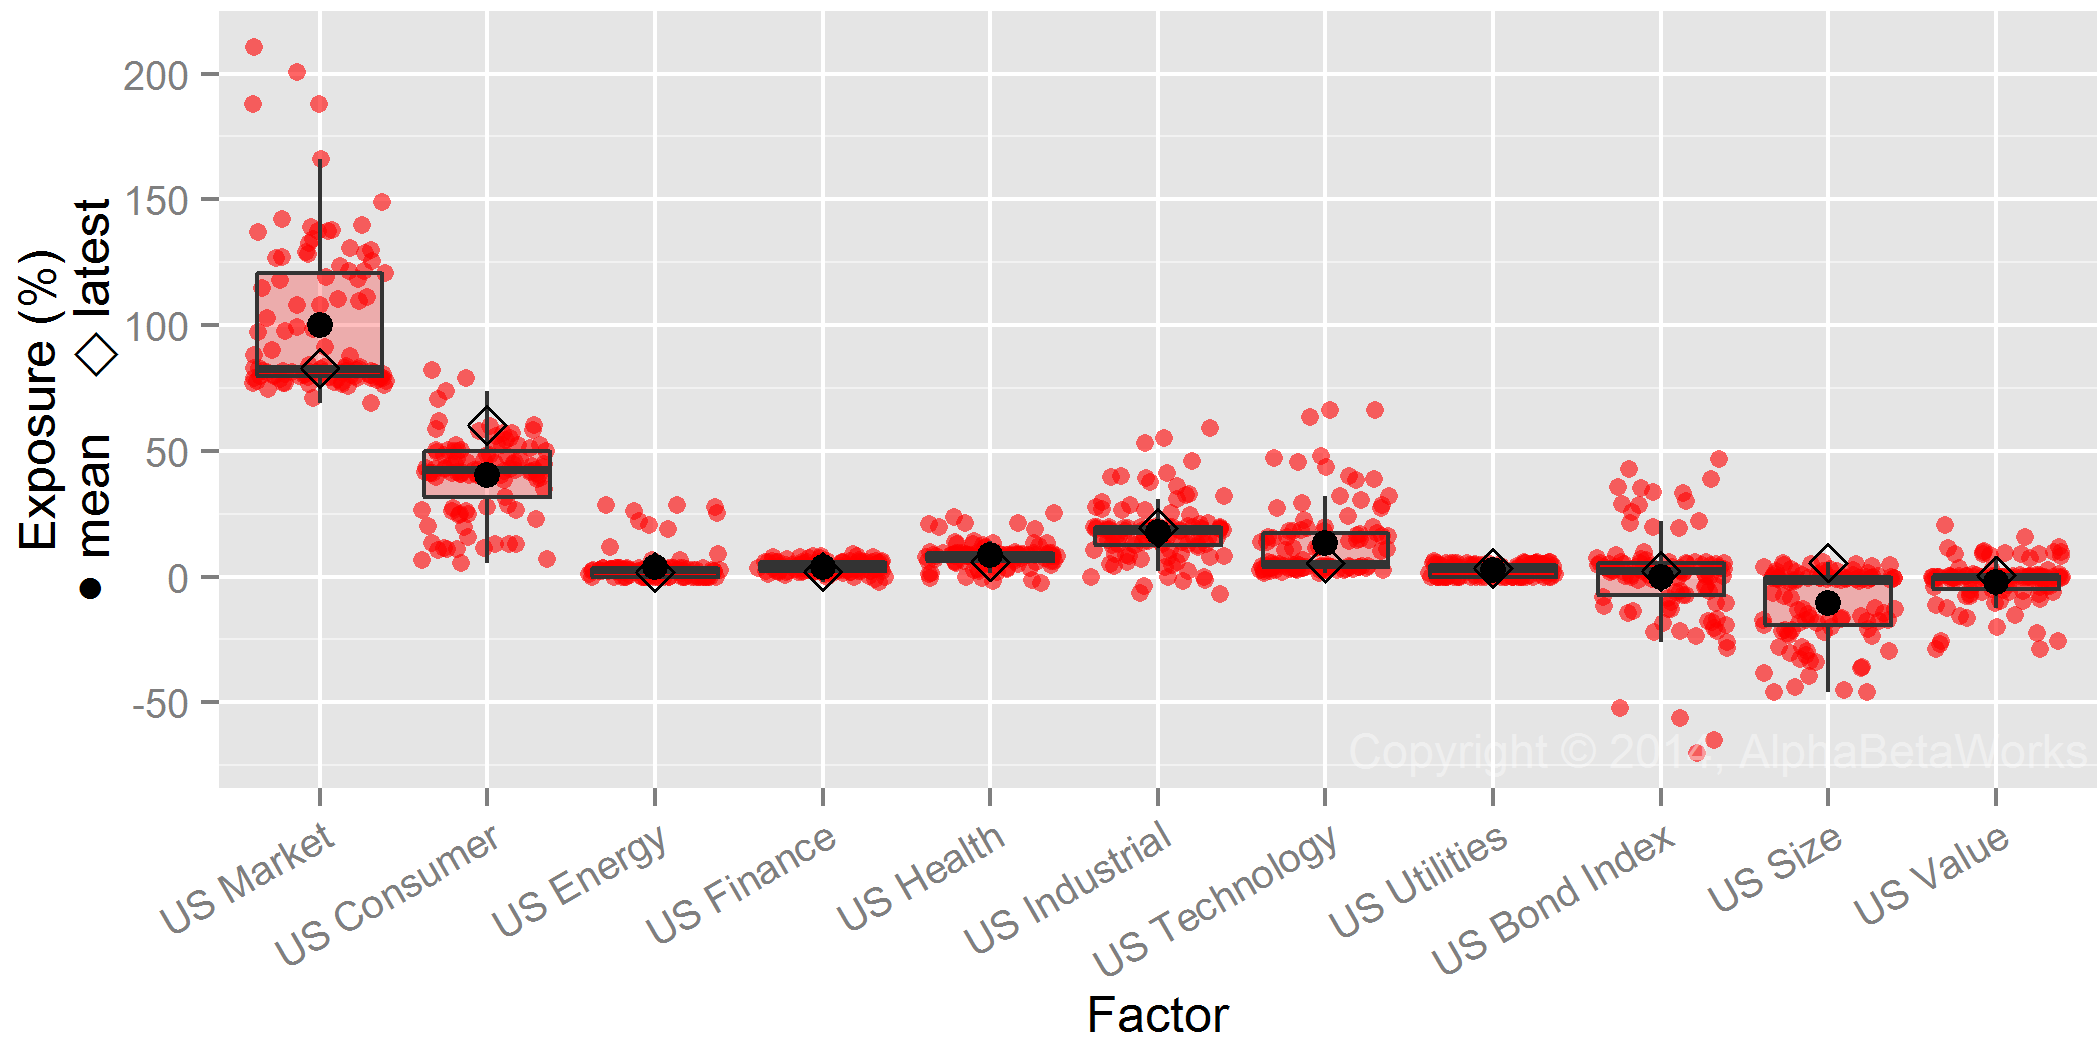
PowerShares S&P 500 Low Volatility Portfolio ETF (SPLV) – Significant Historical Factor Exposures
Low Volatility ETF (SPLV) – Returns-Based Analysis
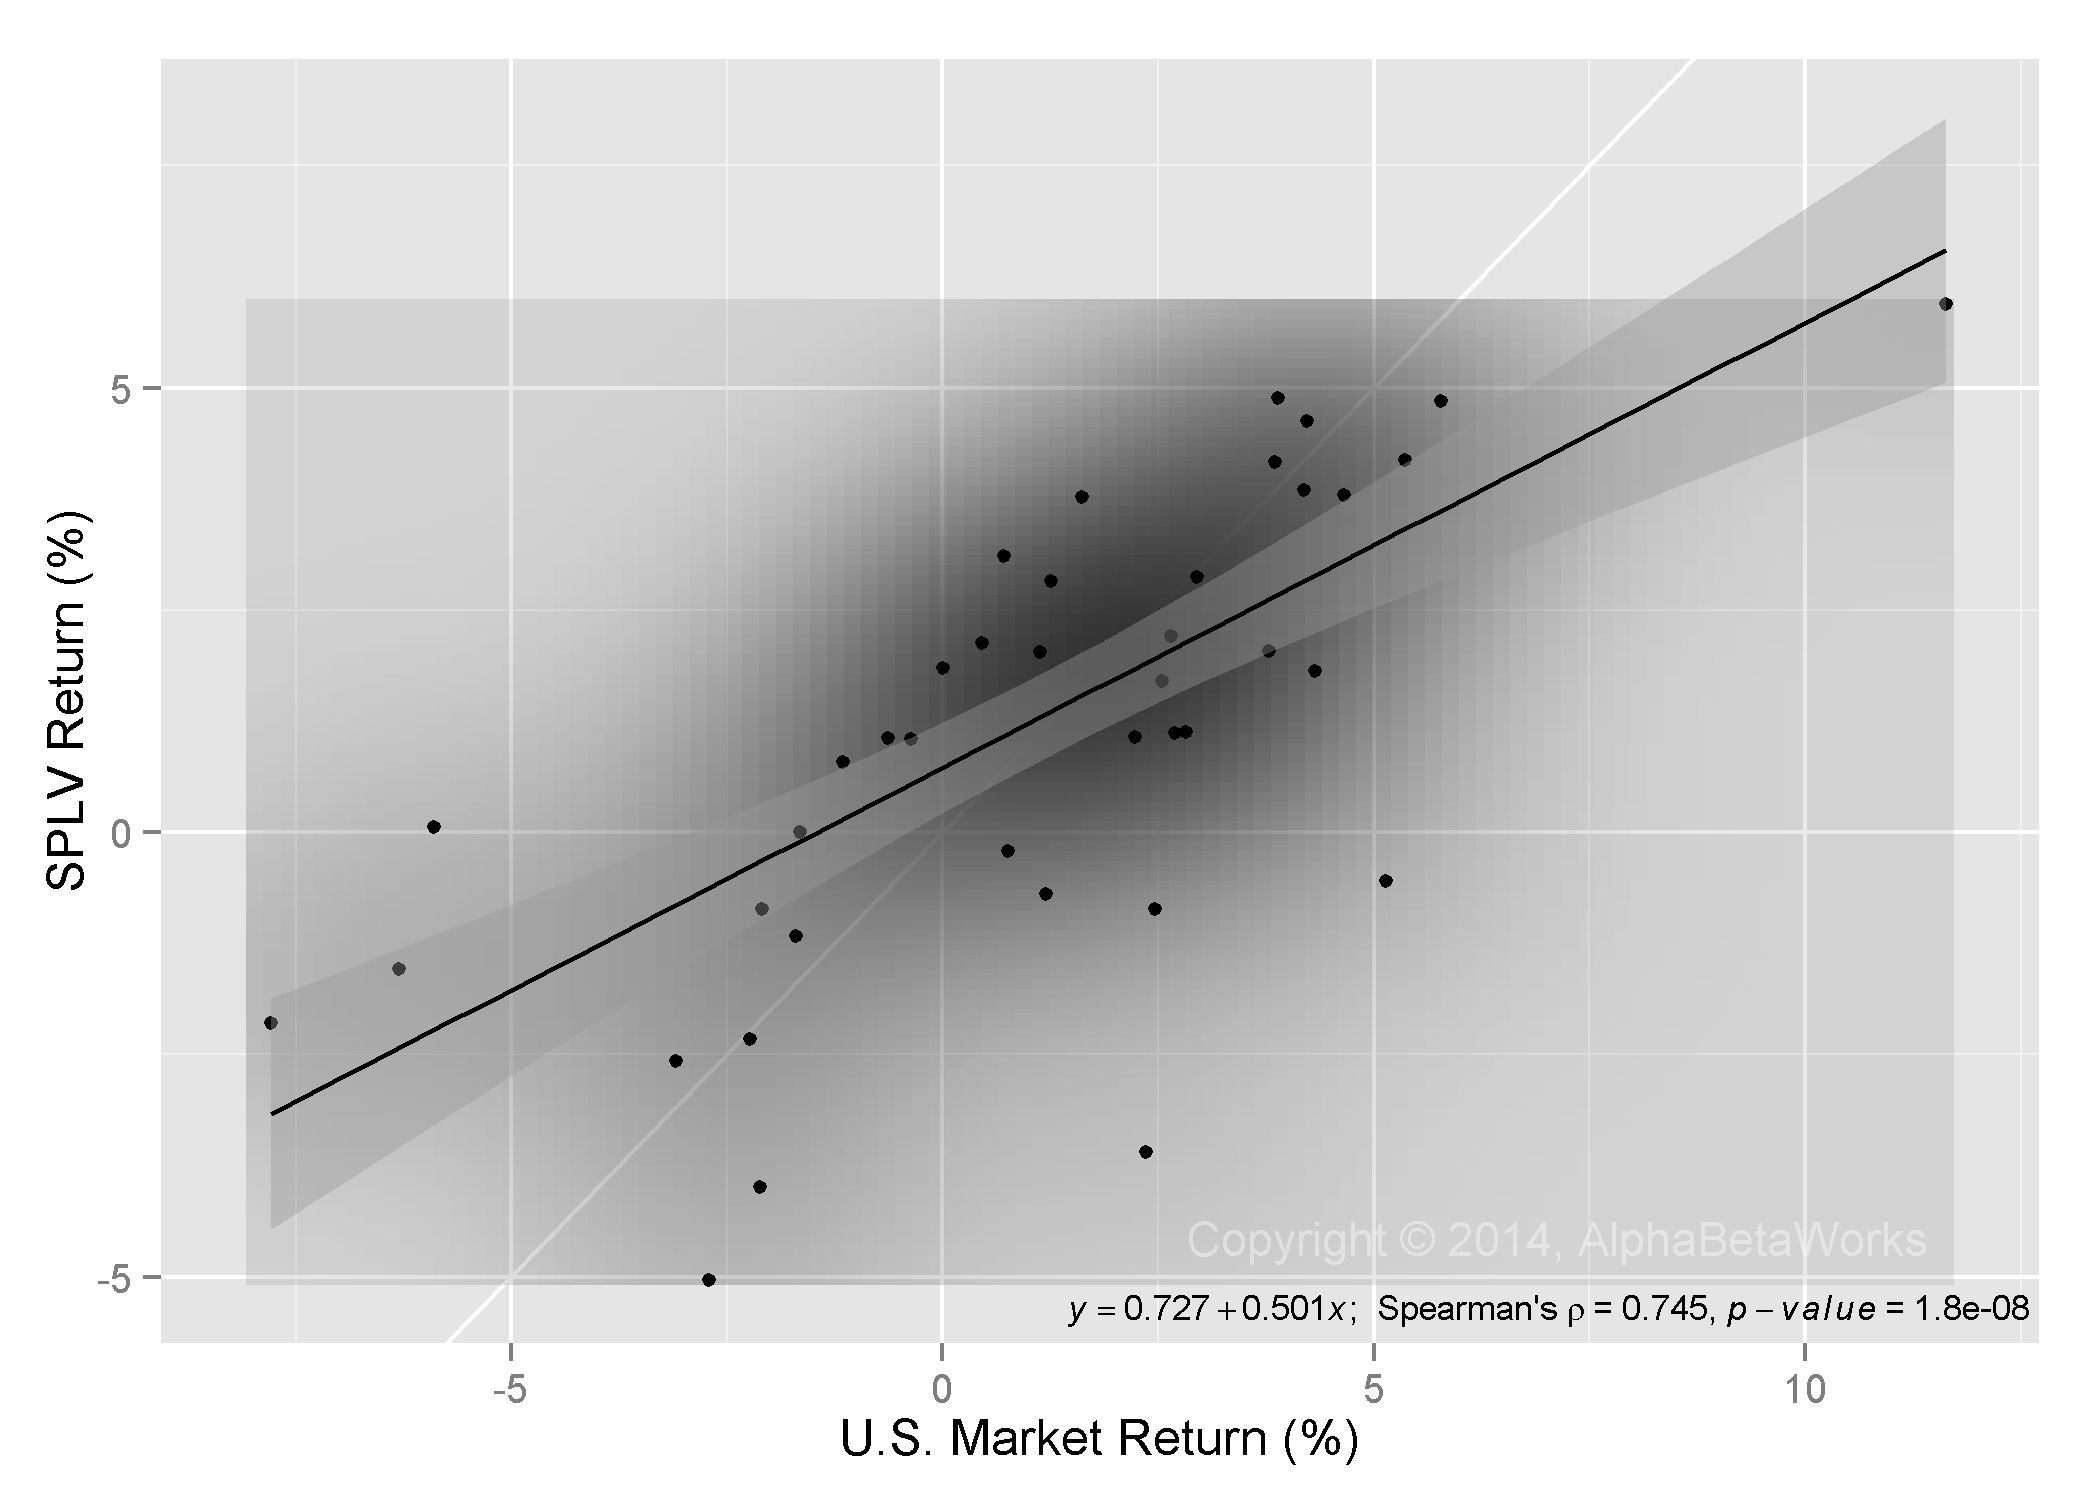
The chart below illustrates a returns-based analysis (RBSA) of SPLV. A regression of SPLV’s monthly returns against U.S. Market’s monthly returns estimates the fund’s U.S. Market factor exposure (beta) at 0.50 – significantly different from the historical risk observed above:

PowerShares S&P 500 Low Volatility Portfolio ETF (SPLV) – Historical Returns vs. the Market
This estimate of beta understates SPLV’s historical market beta (0.55) by a tenth and understates current market beta (0.70) by more than a third. RBSA thus fails to evaluate the current and historical risk of this low volatility smart beta strategy. Performance attribution and all other analyses that rely on estimates of historical factor exposures will also fail.
Fundamental ETF (PRF) – Market Timing
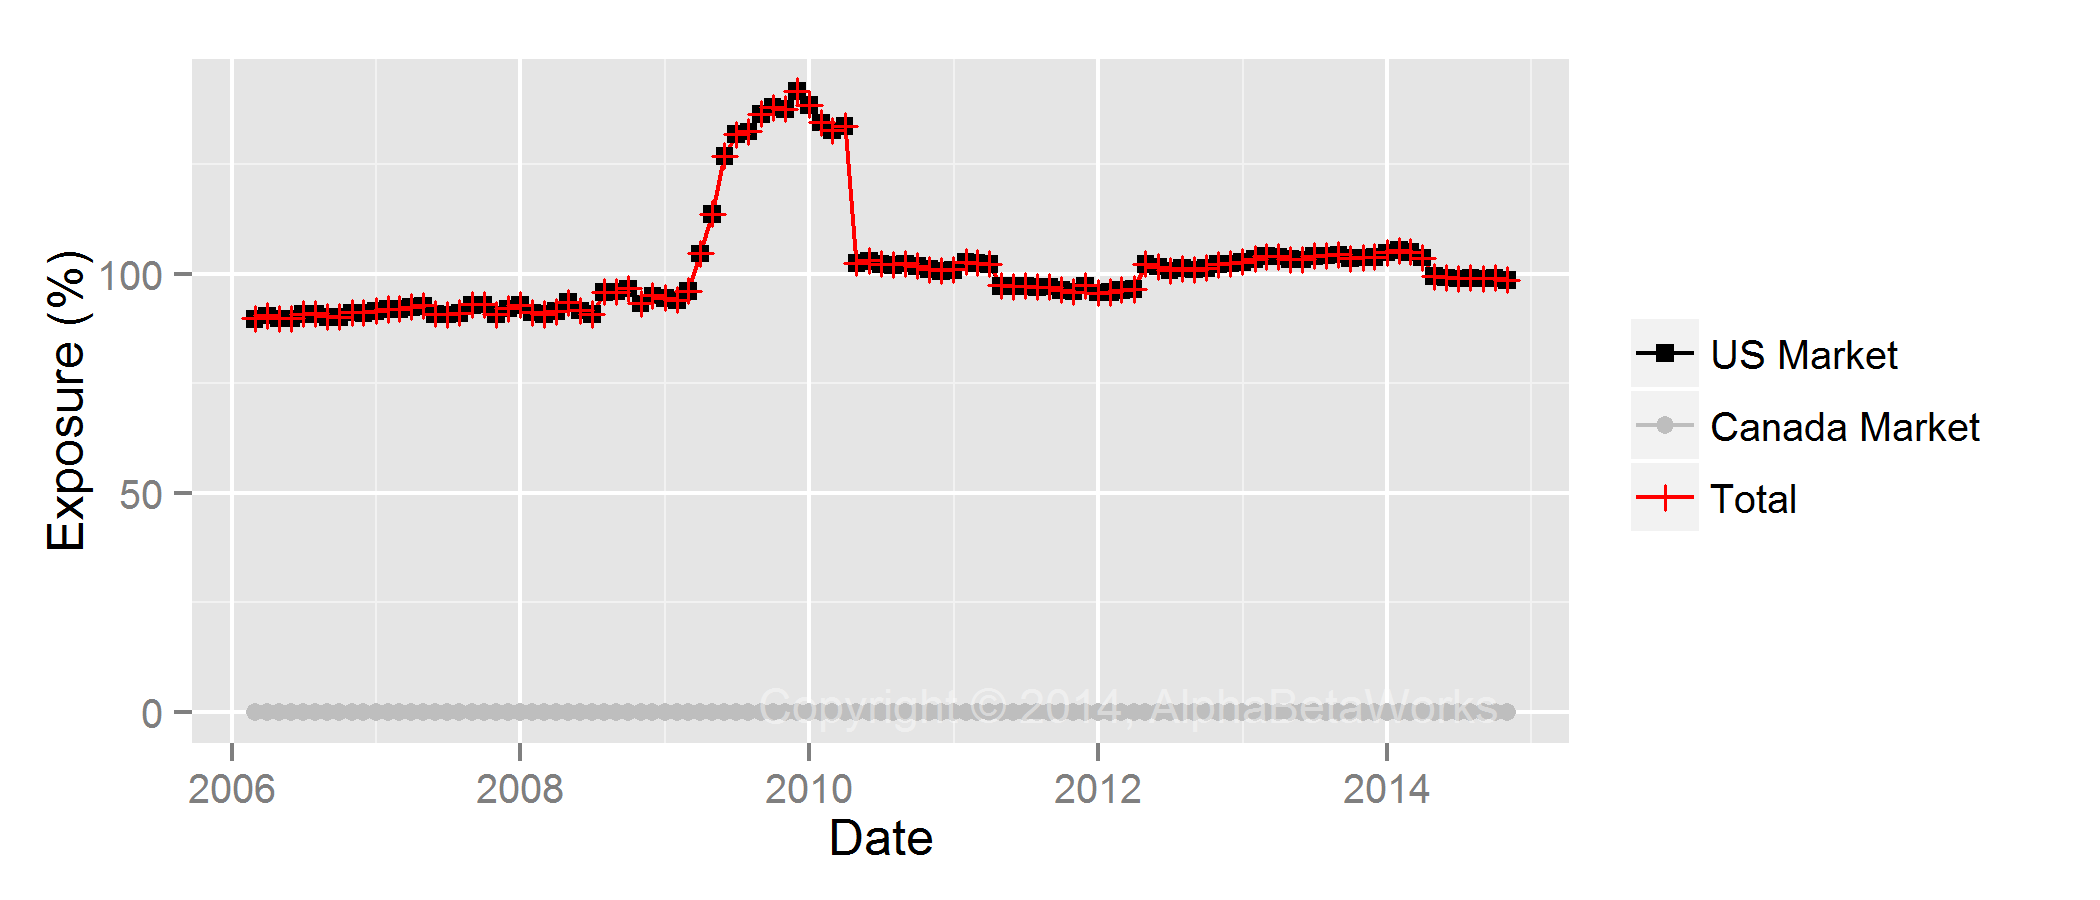
The market risk of the Fundamental ETF has been remarkably constant, except from 2009 to 2010. Back in 2009 PRF increased exposure to high-beta (mostly financial) stocks in a spectacularly prescient act of market timing:

PowerShares FTSE RAFI US 1000 Portfolio ETF (PRF) – Historical Market Exposure
Fundamental ETF (PRF) – Historical Factor Exposures
The historical factor exposure chart for PRF illustrates this spike in Finance Factor exposure from the typical 20-30% range to over 50% and the associated increase in U.S. Market exposure:
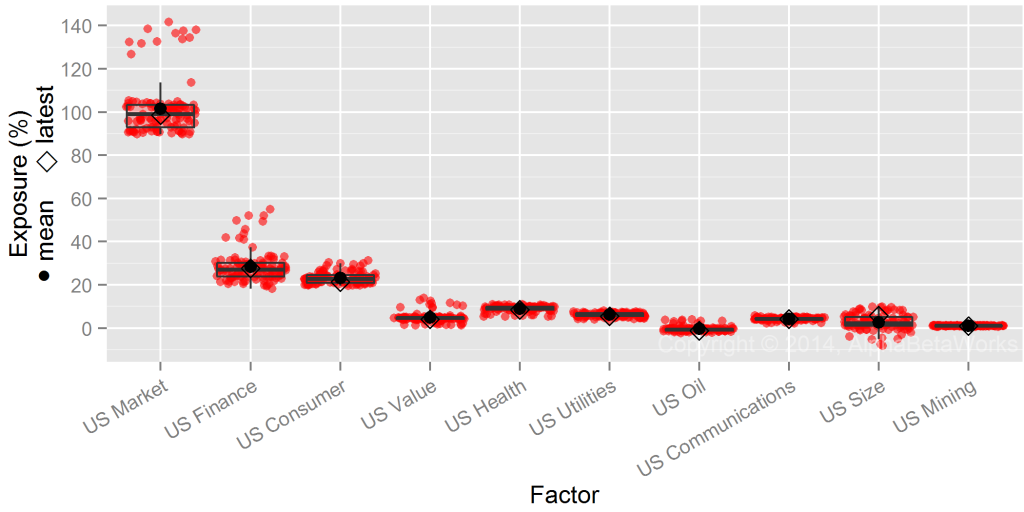
PowerShares FTSE RAFI US 1000 Portfolio ETF (PRF) – Significant Historical Factor Exposures
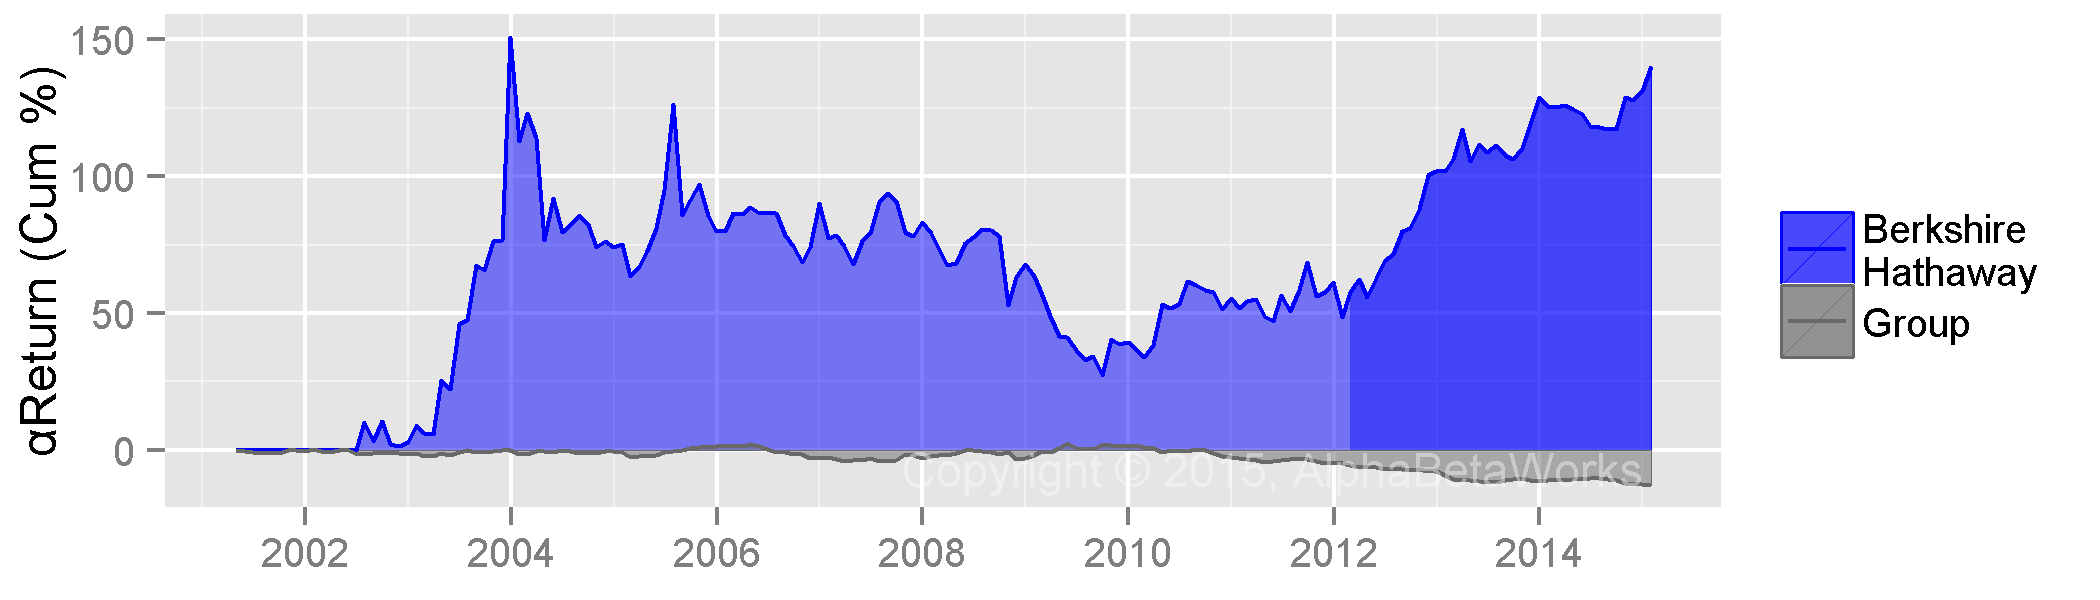
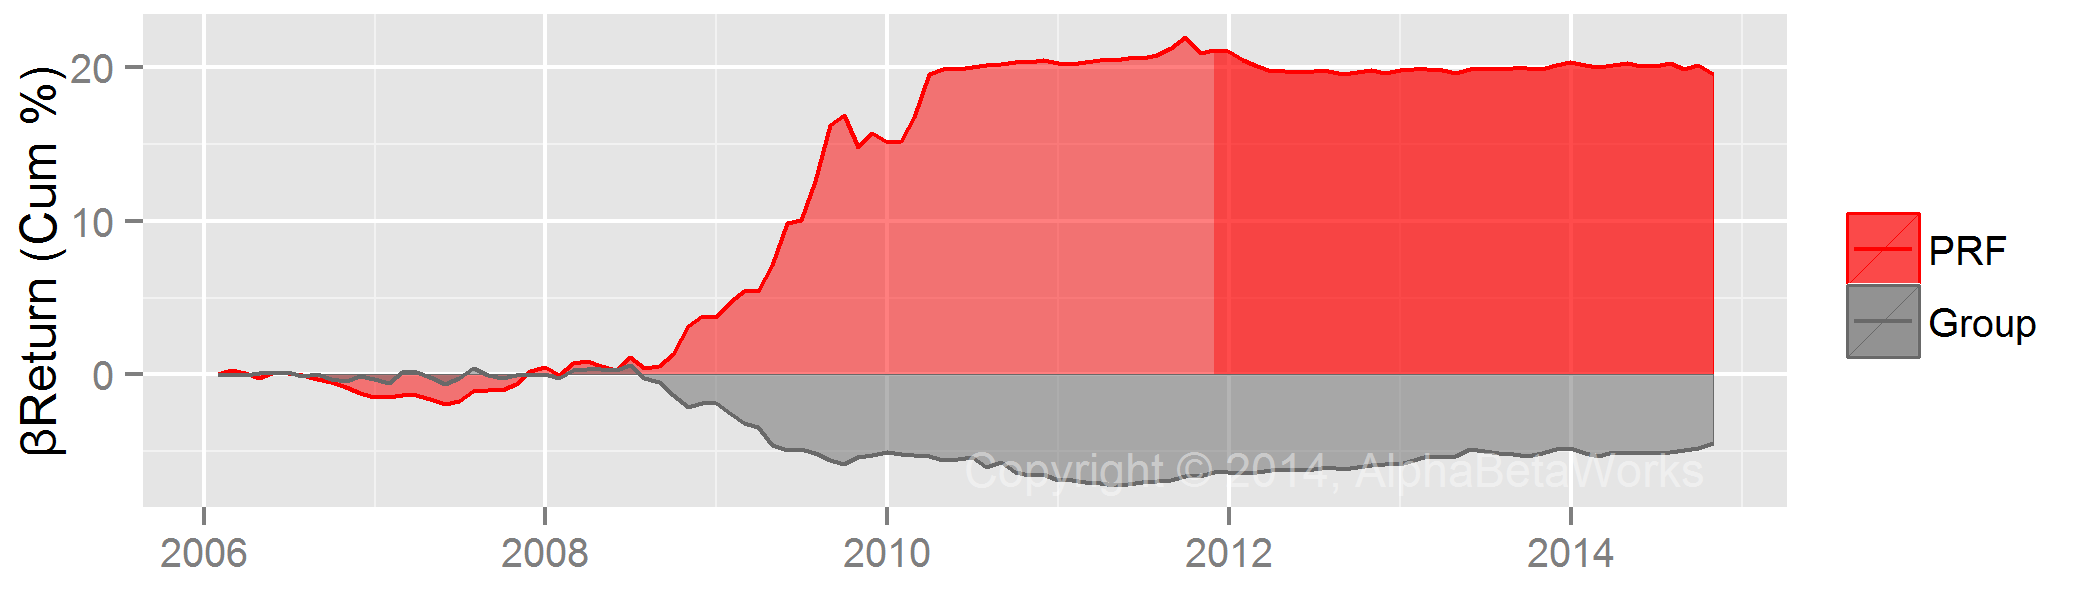
This 2009-2010 exposure spike generated a significant performance gain for the fund. PRF made approximately 20% more than it would have with constant factor exposures, as illustrated below:

PowerShares FTSE RAFI US 1000 Portfolio ETF (PRF) – Historical Risk-Adjusted Return from Market Timing
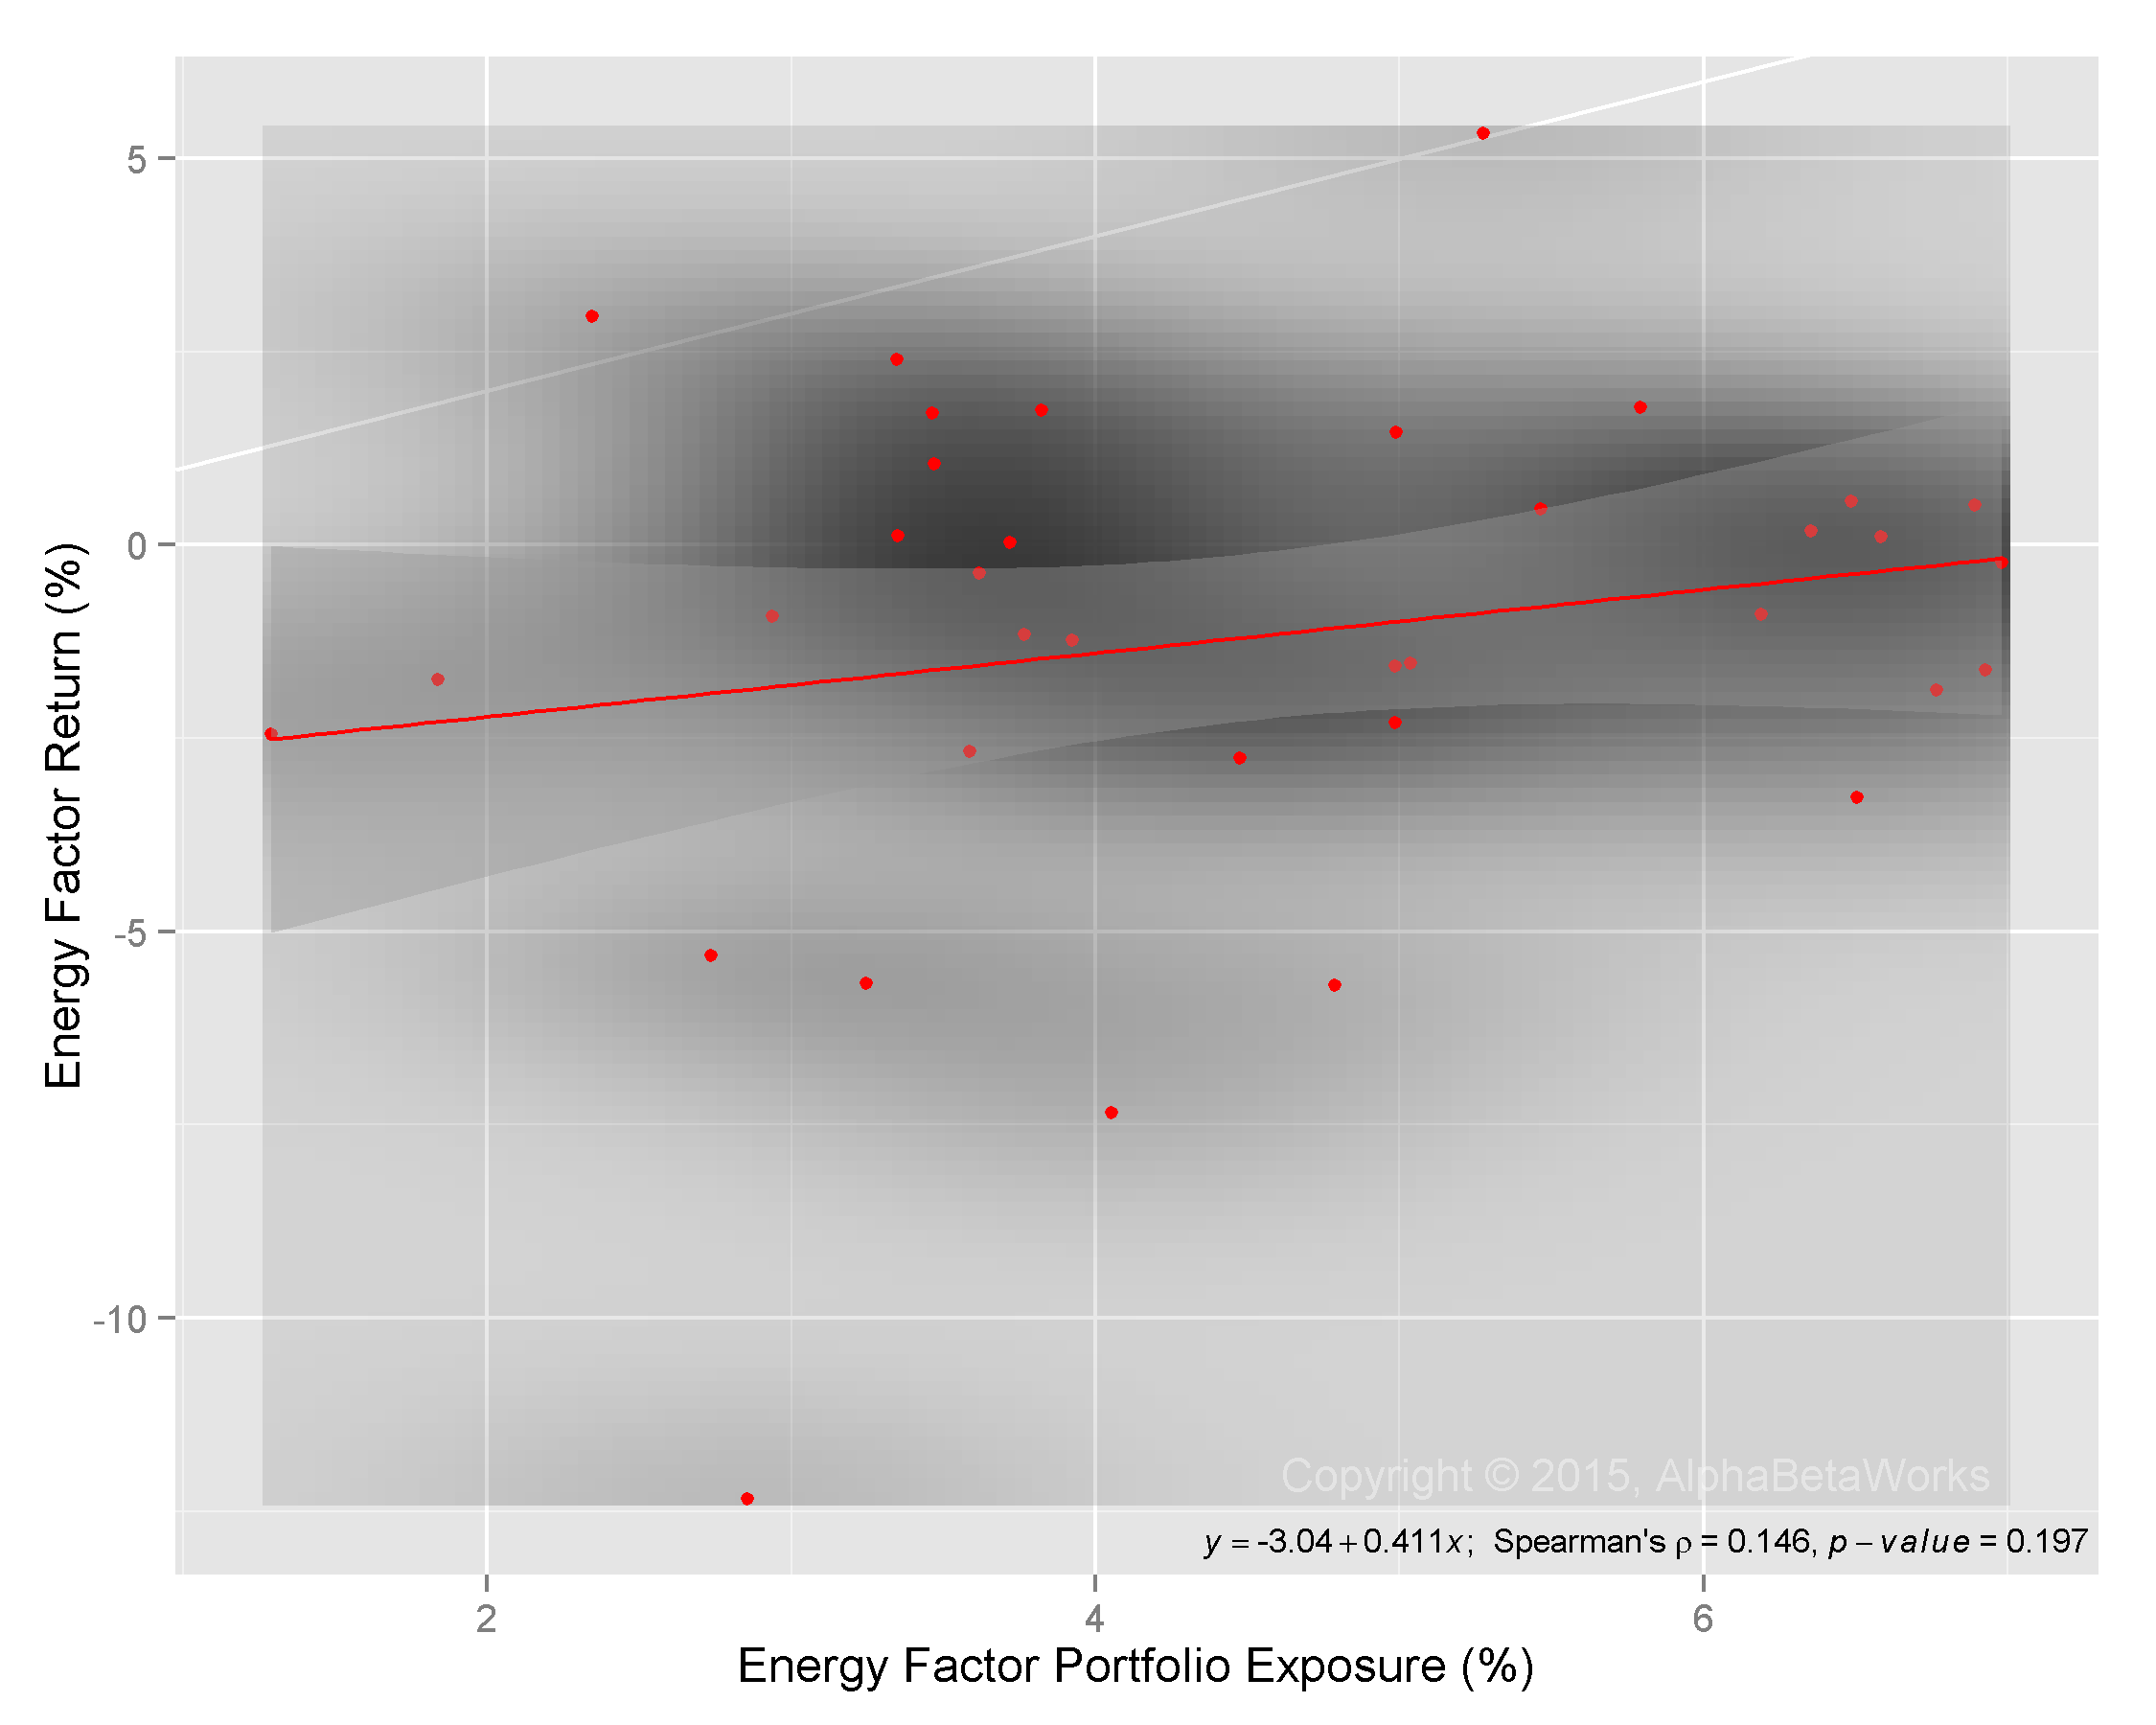
By contrast, PRF’s long-term risk-adjusted return from security selection is insignificant:
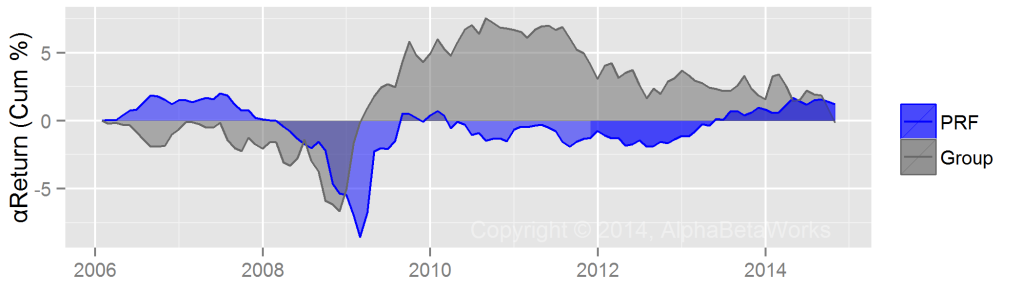
PowerShares FTSE RAFI US 1000 Portfolio ETF (PRF) – Historical Risk-Adjusted Return from Security Selection
Factor timing turns out to be more important for the performance of some smart beta strategies than security selection.
Fundamental ETF (PRF) – Returns-Based Analysis
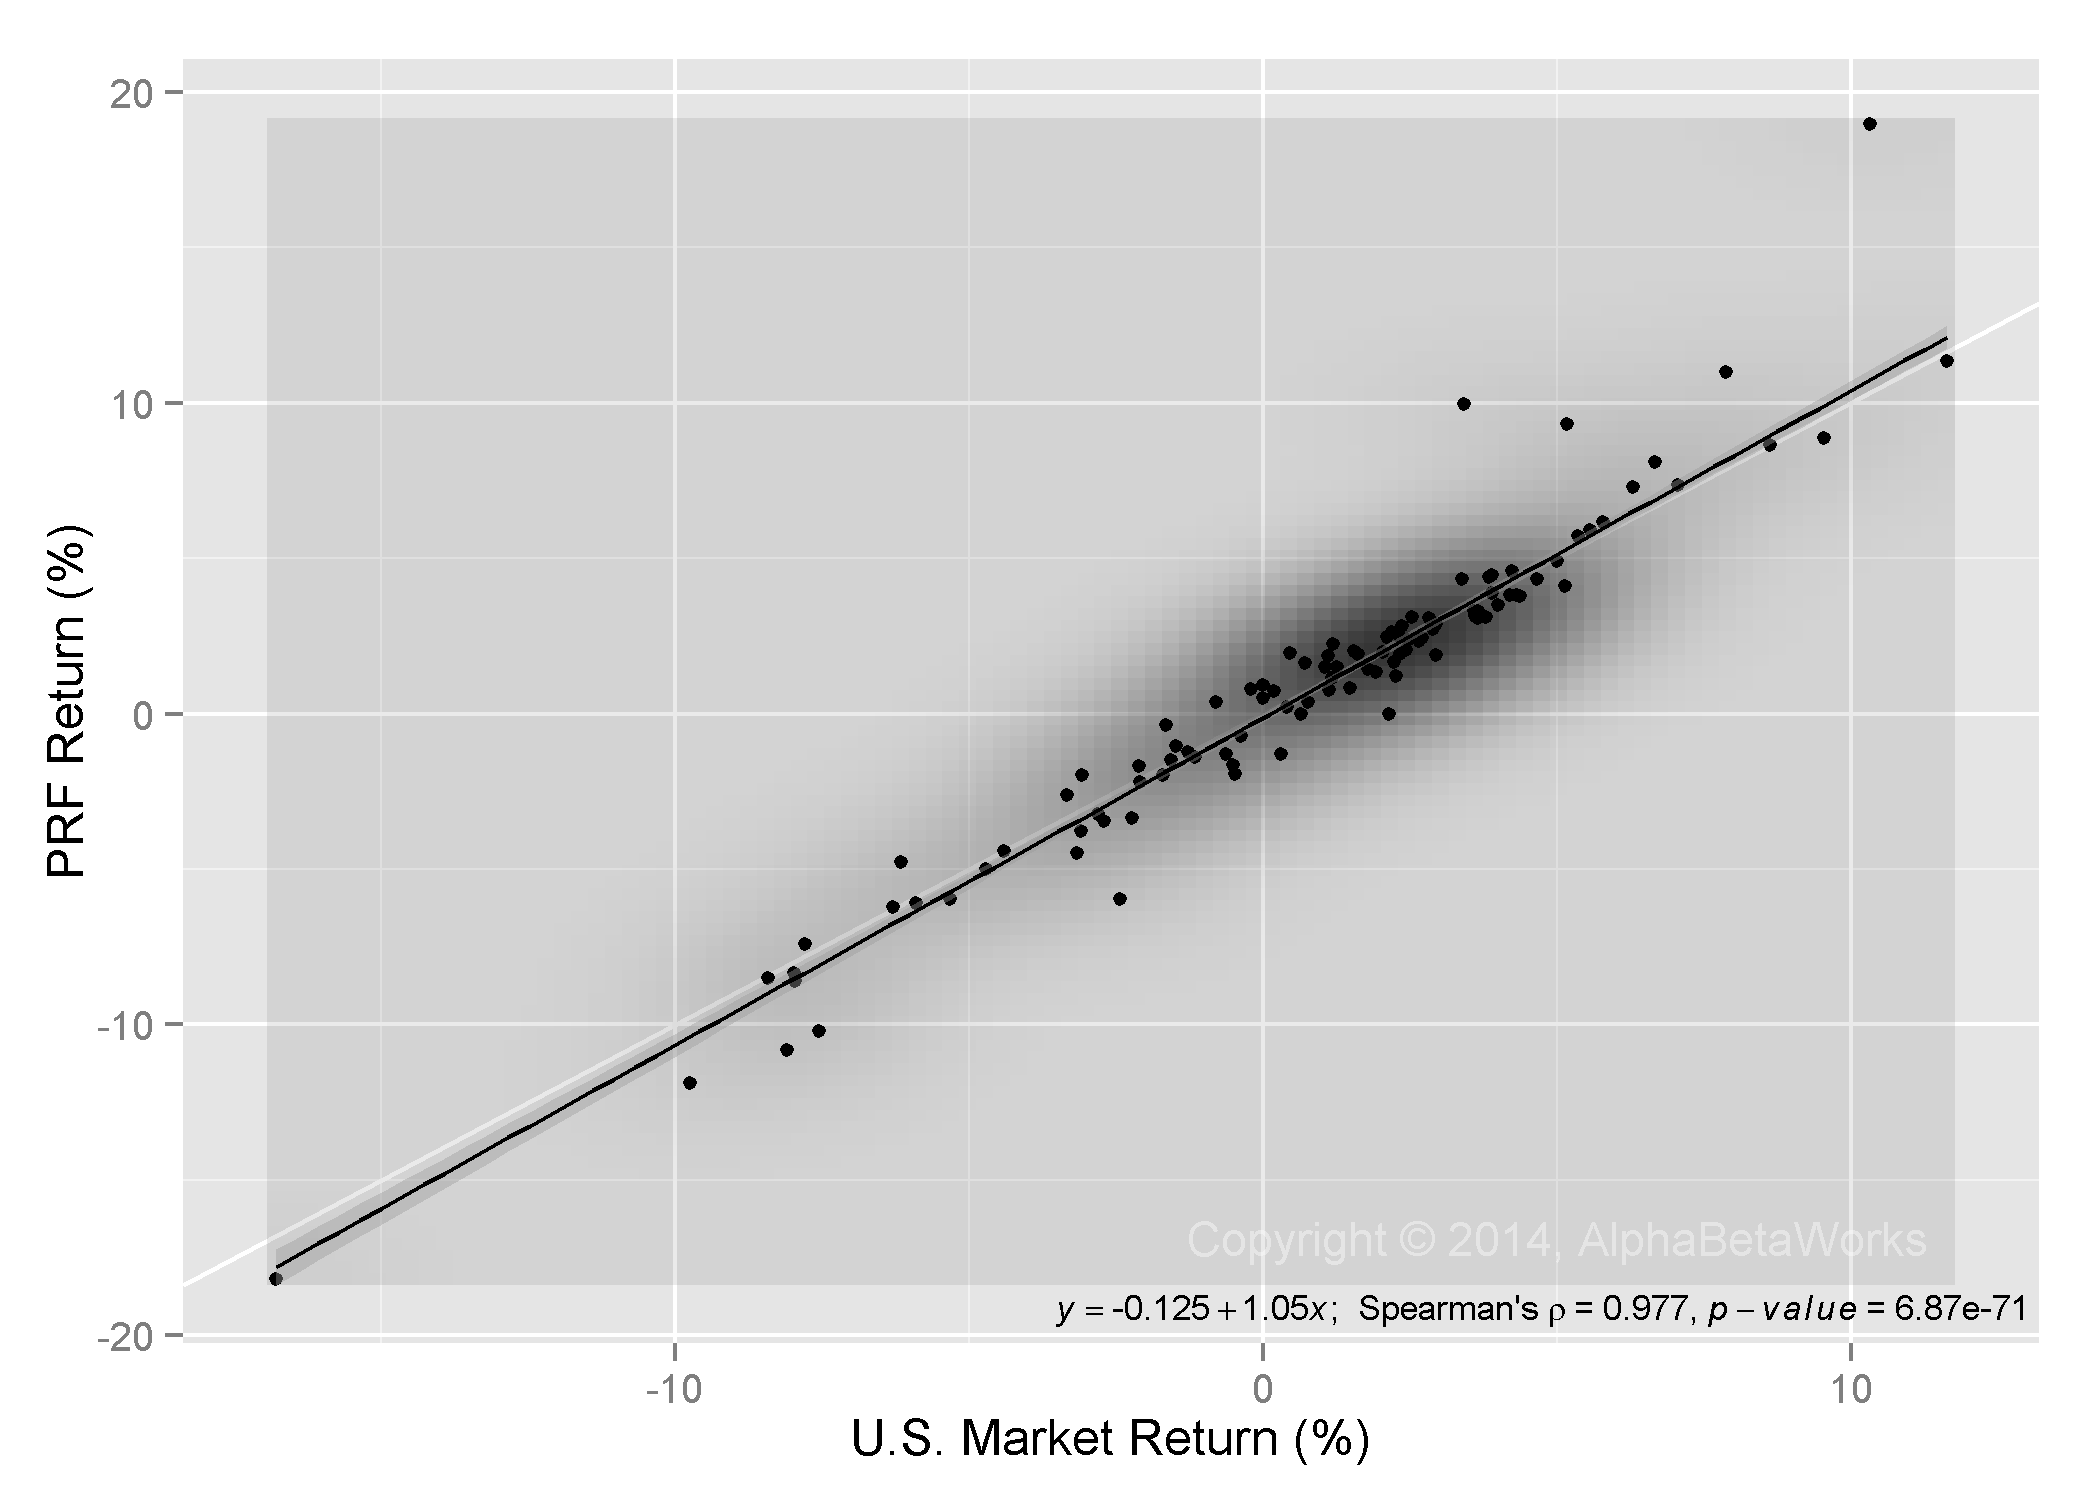
A returns-based analysis of PRF estimates historical U.S. market beta around 1.05:

PowerShares FTSE RAFI US 1000 Portfolio ETF (PRF) – Historical Returns vs. the Market
This 1.05 beta estimate only slightly overstates the fund’s current and historical betas, but misses the 2009-2010 exposure spike. Returns-based analysis thus does a decent job evaluating the average risk of a fundamental indexing smart beta strategy, but fails in historical attribution.
Quality ETF (SPHQ) – Market Timing
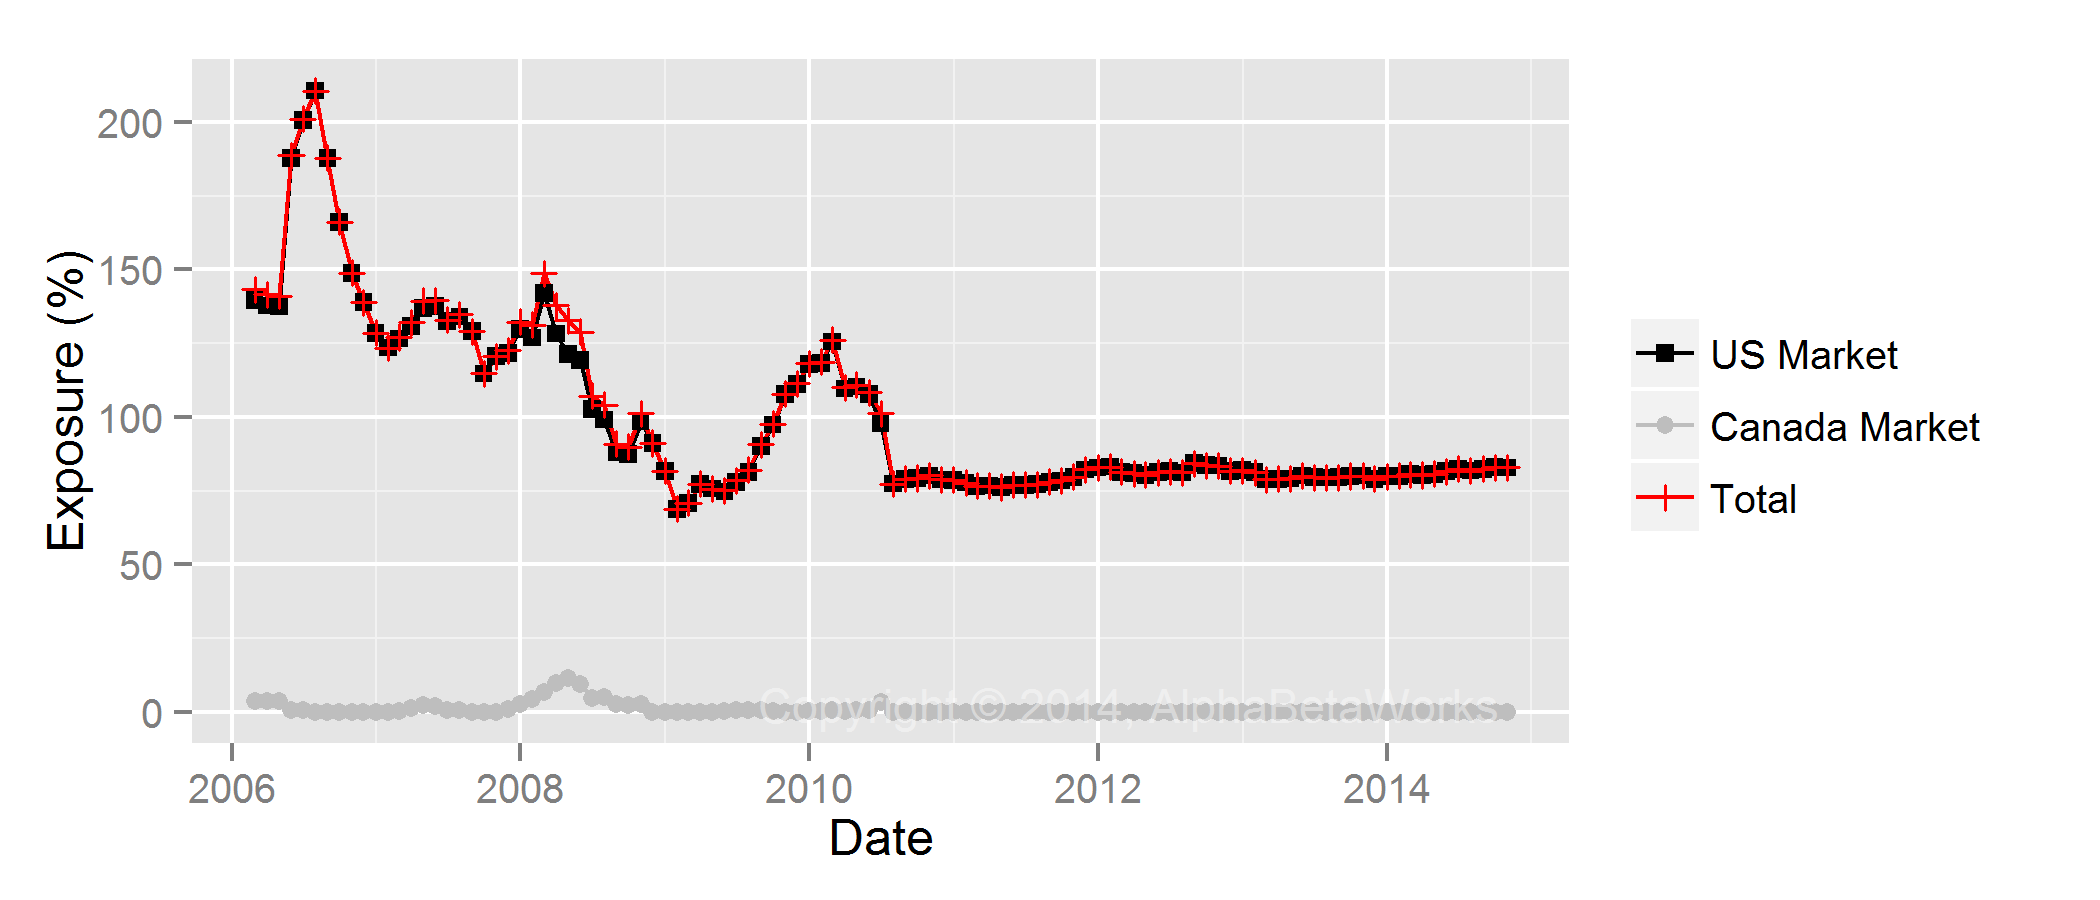
The market exposure of the quality smart beta strategy (SPHQ) swung wildly before 2011. It has been stable since:

PowerShares S&P 500 High Quality Portfolio ETF (SPHQ) – Historical Market Exposure
Quality ETF (SPHQ) – Historical Factor Exposures
As with the other smart beta strategies, market timing by SPHQ comes from significant variations in sector bets:

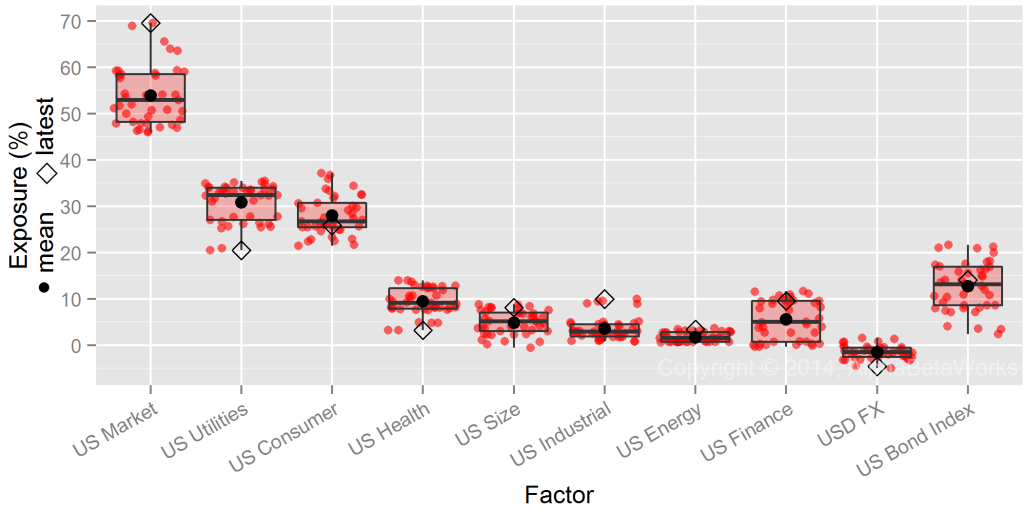
PowerShares S&P 500 High Quality Portfolio ETF (SPHQ) – Significant Historical Factor Exposures
Quality ETF (SPHQ) – Returns-Based Analysis
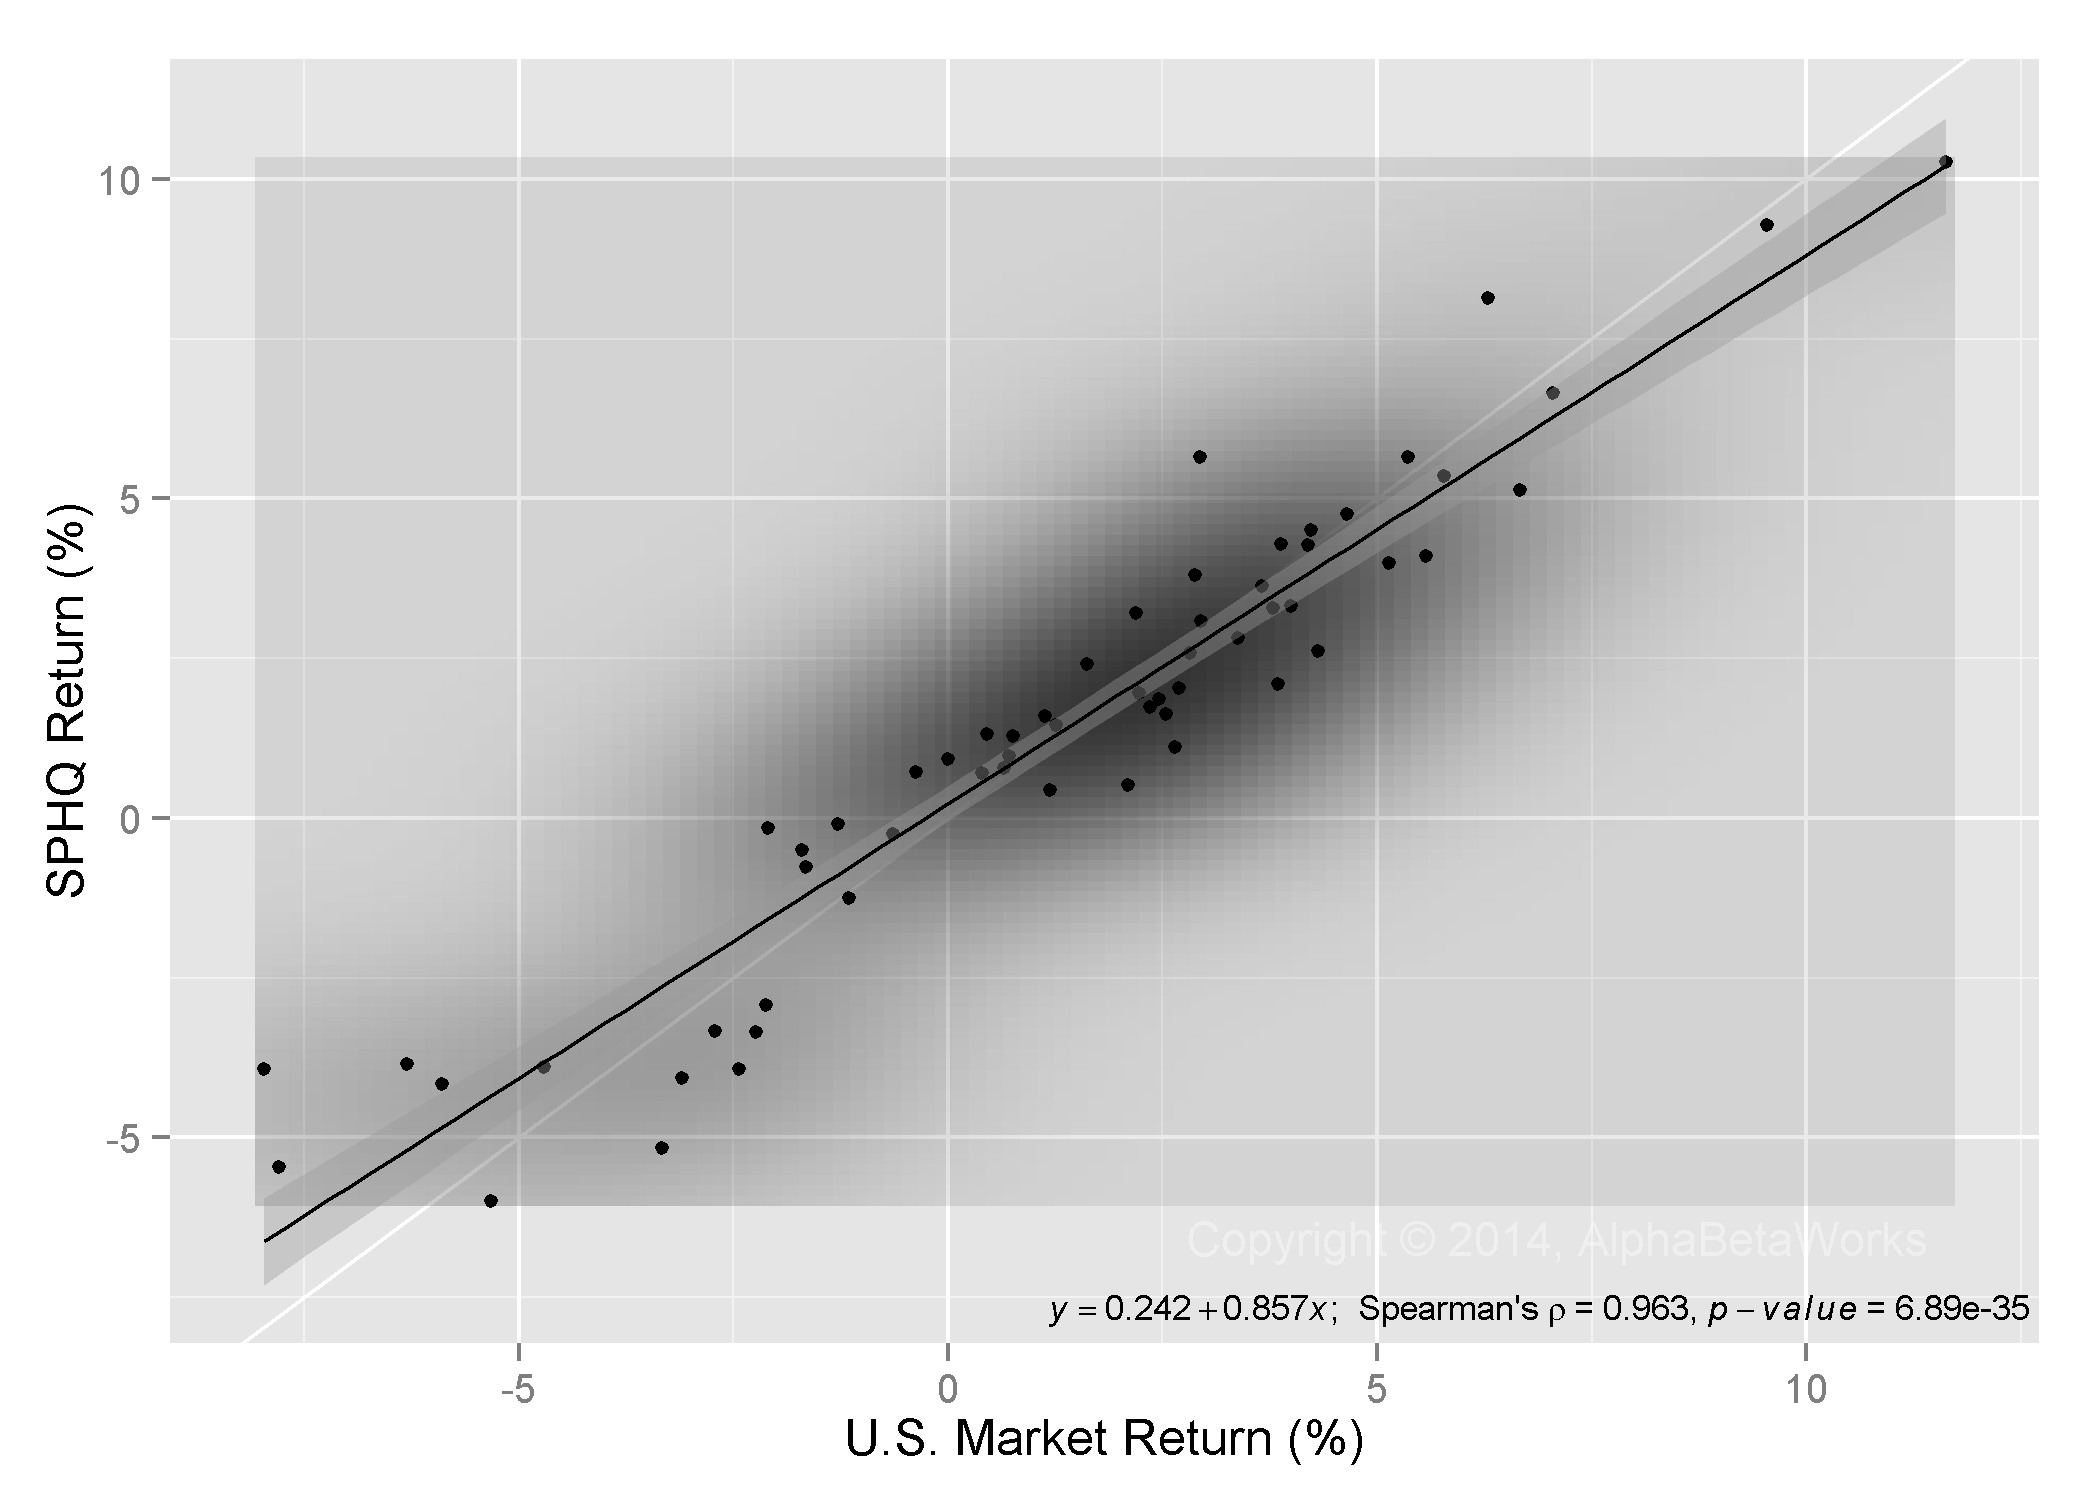
A returns-based analysis of SPHQ estimates historical U.S. market beta around 0.86:

PowerShares S&P 500 High Quality Portfolio ETF (SPHQ) – Historical Returns vs. the Market
Given the large variation in SPHQ’s risk over time, this 0.86 beta estimate understates the average historical beta but slightly overstates the current one. While the current risk estimate is close, RBSA fails for historical risk estimation and performance attribution.
Conclusions
- Low volatility indexing, fundamental indexing, and quality indexing smart beta strategies vary market and other factor exposures (systematic risk) over time.
- Due to exposure variations over time, returns-based style analysis and similar methods tend to fail for smart beta strategies:
- Funds’ historical systematic risk estimates are flawed.
- Funds’ current systematic risk estimates are flawed.
- Performance attribution and risk-adjusted performance estimates are flawed.
- Analysis and aggregation of factor exposures of individual holdings throughout a portfolio’s history with a capable multi-factor risk model produces superior risk estimates and performance attribution.
The information herein is not represented or warranted to be accurate, correct, complete or timely.
Past performance is no guarantee of future results.
Copyright © 2012-2015, AlphaBetaWorks, a division of Alpha Beta Analytics, LLC. All rights reserved.
Content may not be republished without express written consent.