
This article is part of an ongoing series exploring flaws in popular investment risk and skill evaluation techniques. We focus on the most common pitfalls that have been particularly costly for asset managers and fund investors.
Investment risk and skill evaluation frequently relies on returns-based style analysis, and returns-based performance attribution. These techniques perform regressions to compute portfolio betas (exposures to systematic risk factors) and alphas (residual returns unexplained by systematic risk factors).
The simplicity of returns-based approach has made it popular. It is often the only practical method for evaluating multi-asset-class portfolios that span commodities, public securities, derivatives, and private investments. However, this simplicity comes at a heavy cost, which we explore in this and upcoming articles.
The Assumption of Stable Exposures
A key assumption of most returns-based analyses is the constancy of factor exposures. This assumption breaks down for active managers.
A good example of this is the Fairholme Fund, ticker FAIRX. The Fairholme Fund has dramatically varied its bets over the past ten years. A simple linear regression of historical fund returns against the US Market is below. It estimates beta at 1.14 and monthly alpha at 0.12%:
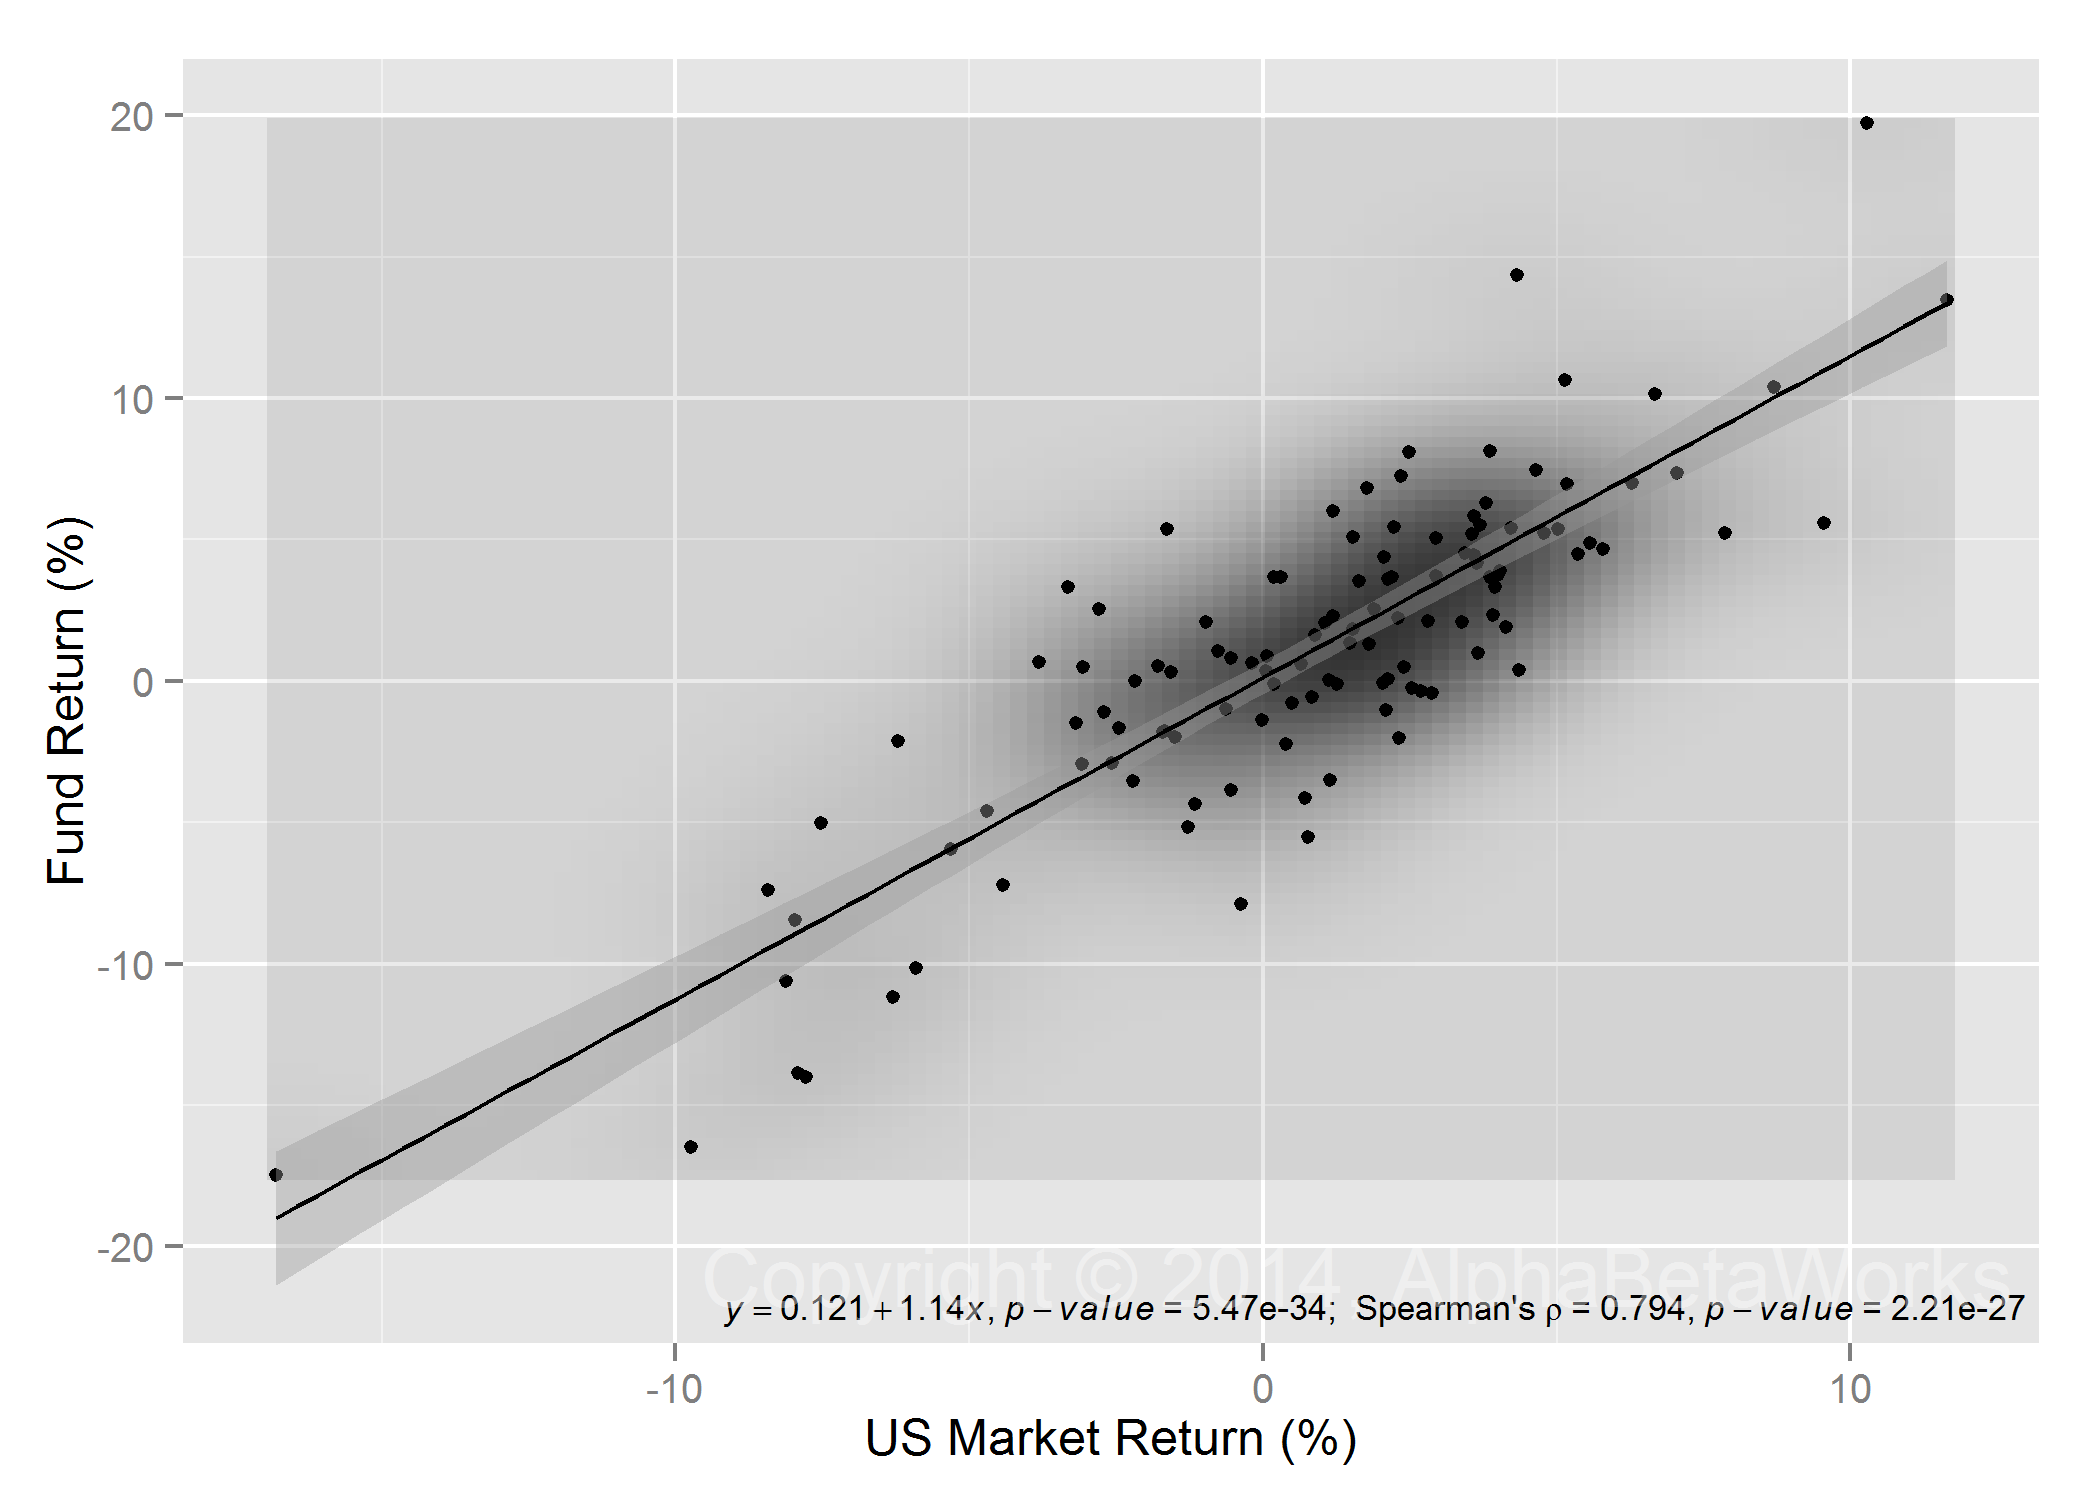
The Fairholme Fund (FAIRX) Returns vs the US Market
This and similar regression approaches form the basis of returns-based analysis. This convenient but overly simplistic analysis does not attempt to estimate market exposure at each point in time. Hence, the beta of 1.14 may not be representative of the current or historical US Market exposures of a fund.
The Variation of Exposure
To test this beta, we estimated monthly US Market exposures of the fund using the AlphaBetaWorks US Equity Risk Model. For each month, we estimated the betas (exposures) of individual positions to the US Market Factor and aggregated these into monthly estimates of aggregate portfolio beta. It turns out that over the past 10 years the Fairholme Fund has varied its US Market Exposure between 50% and 170%:
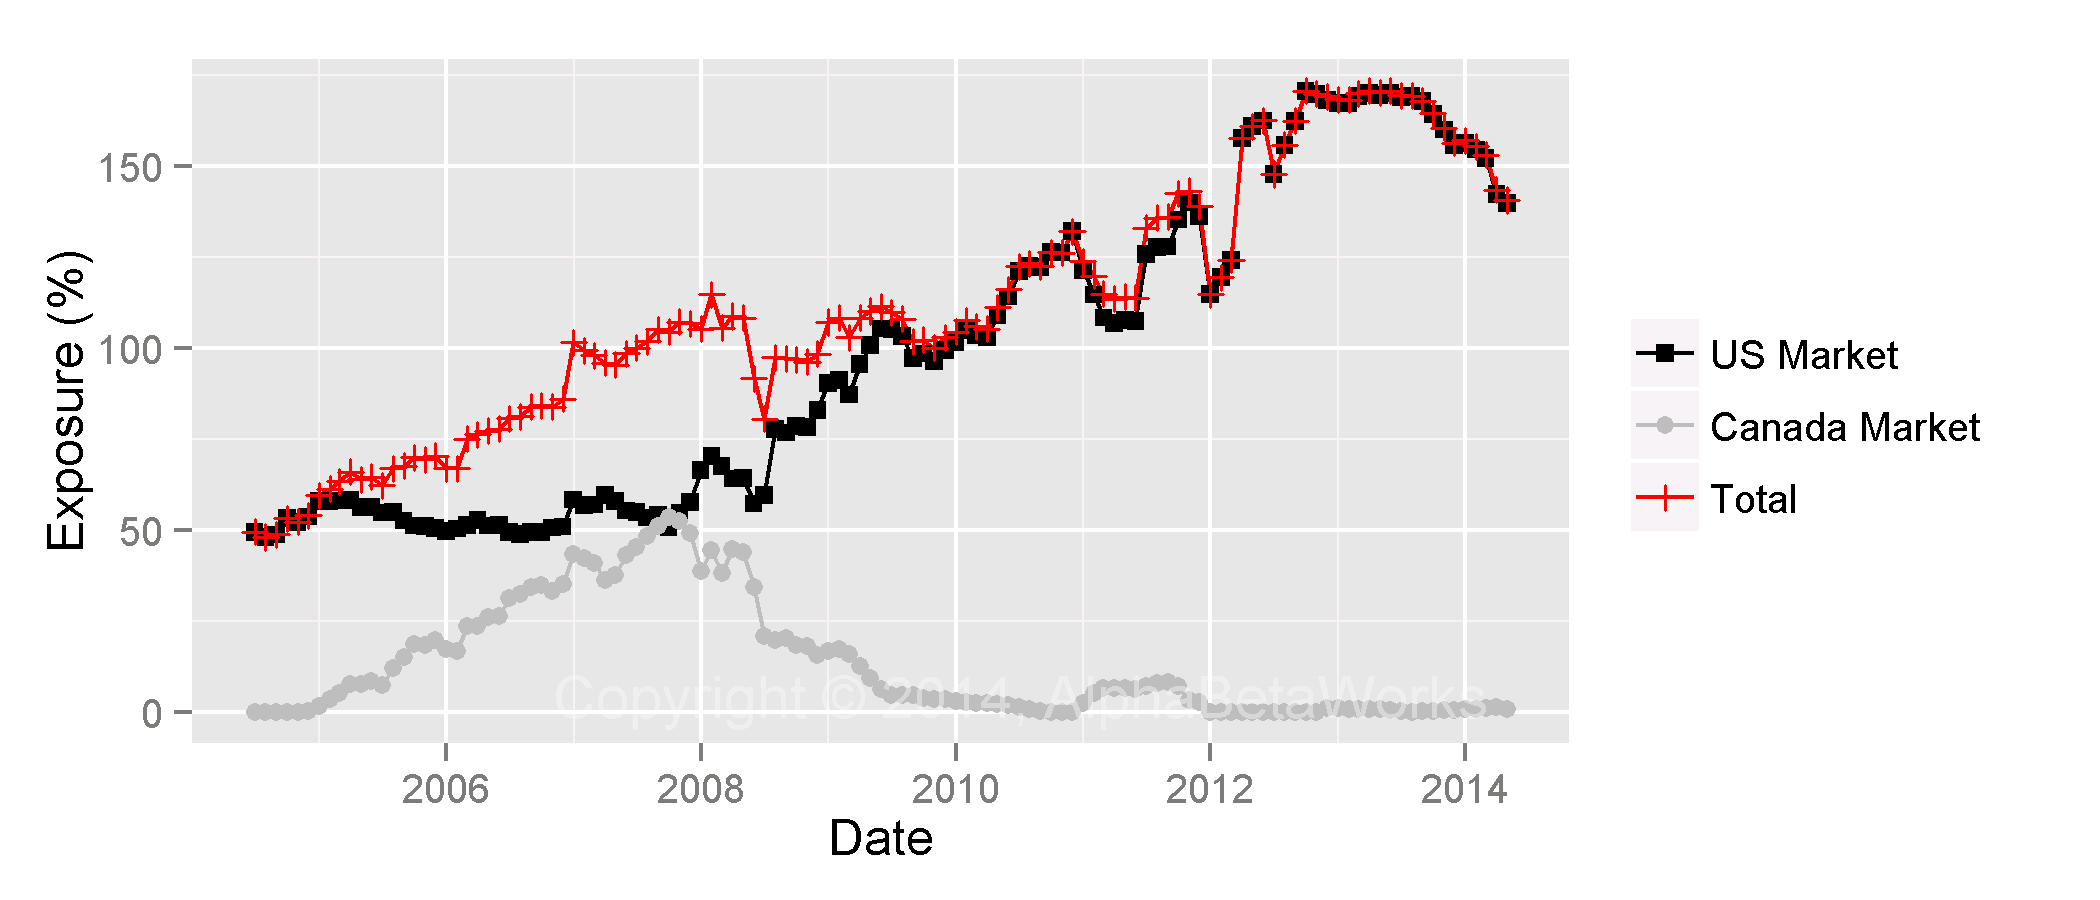
The Fairholme Fund (FAIRX) Market Factor Exposure History
The US Market Exposure ranged from 50% to 170% and was infrequently anywhere near 110%. It turns out, risk estimated using returns-based analysis is inaccurate most of the time. It is also an inaccurate estimate of the true mean exposure:
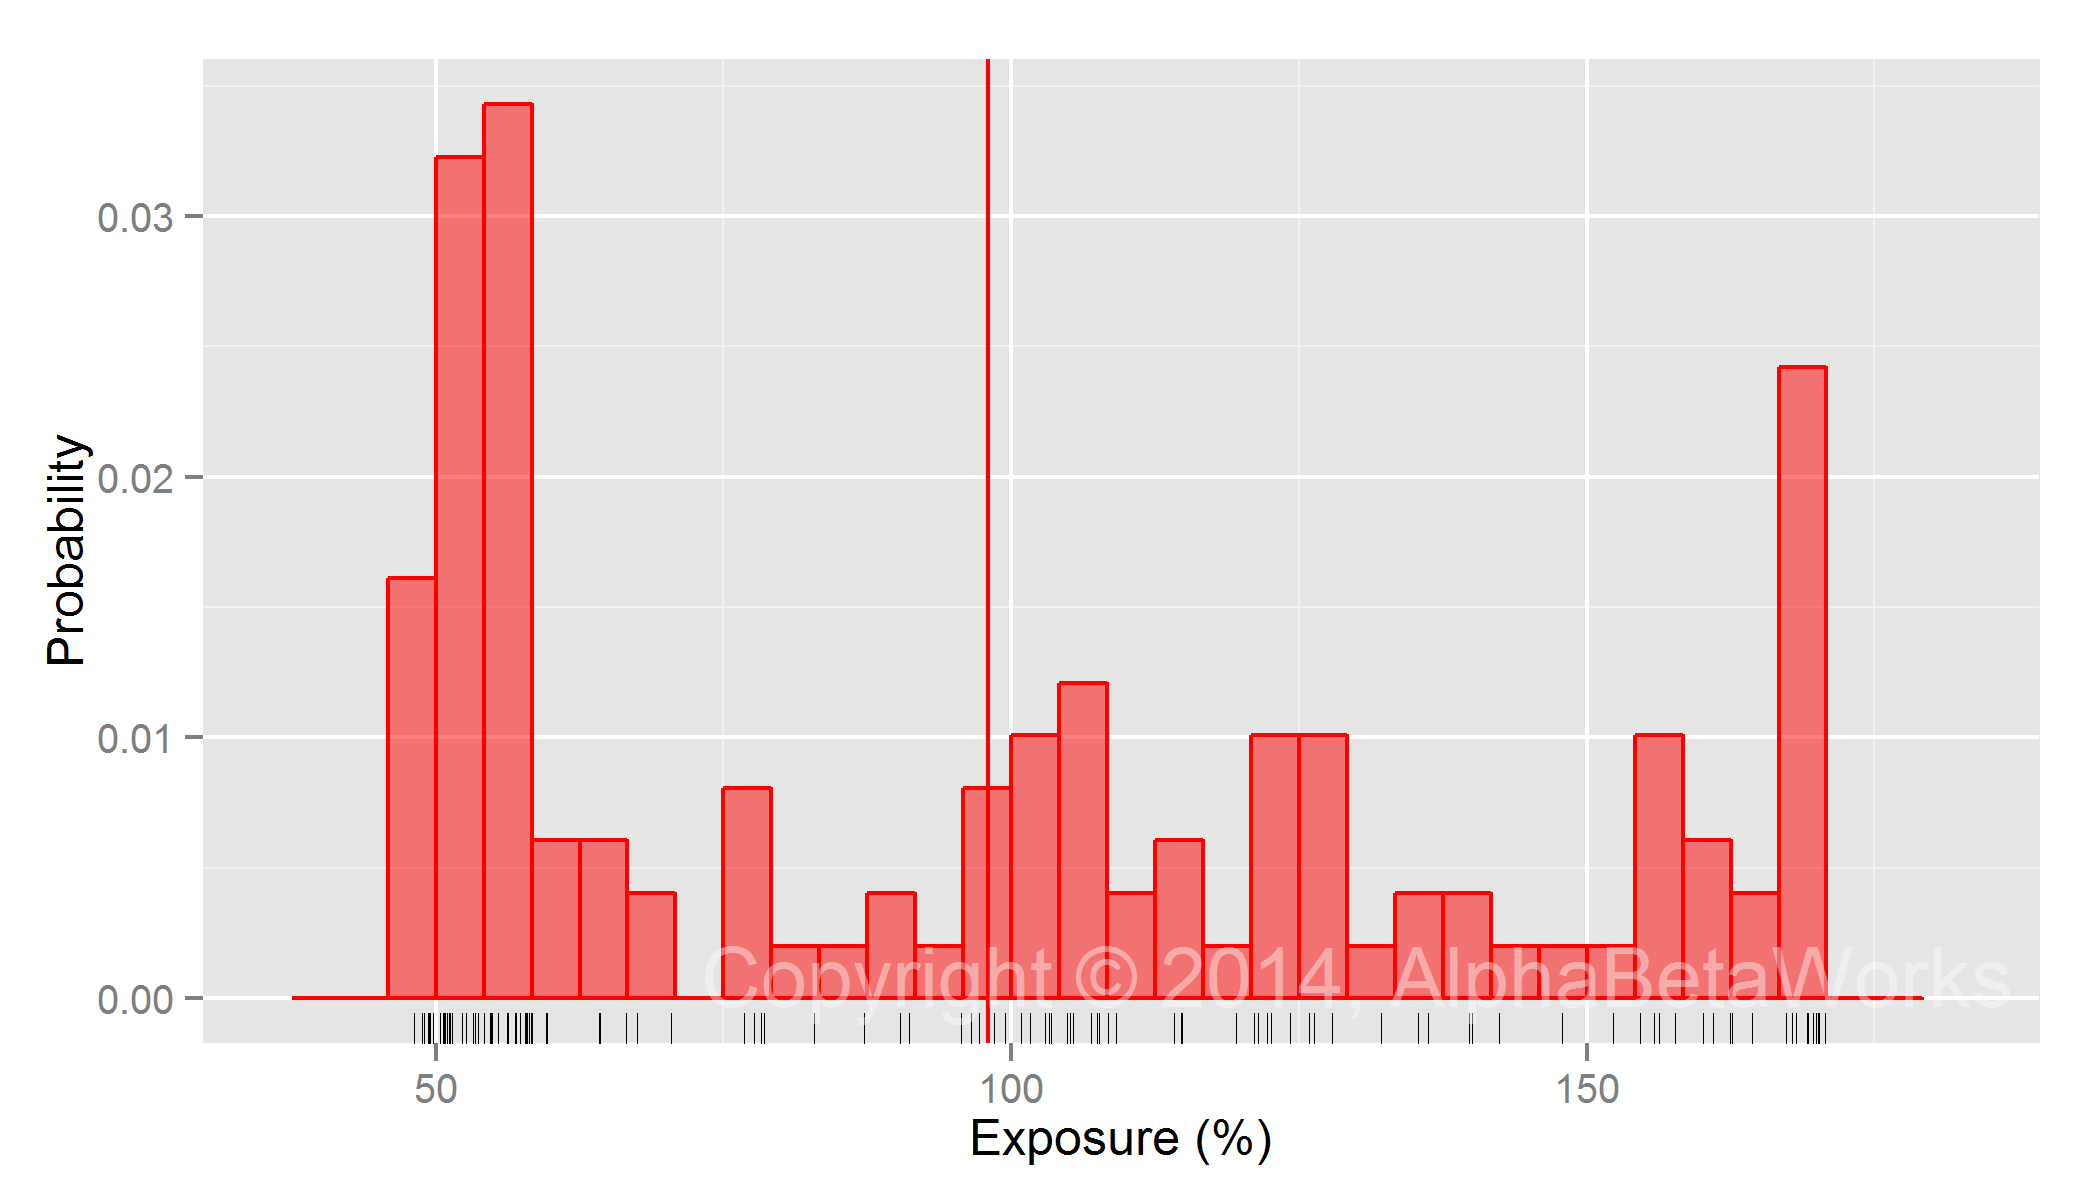
The Fairholme Fund (FAIRX) Historical US Market Exposure Distribution
Consequences of Varied Exposures
Returns-based analysis can produce deeply flawed estimates of the current risk for funds that vary their bets. Even estimates of average risk and style may be inaccurate. In the case of the Fairholme Fund, the returns-based estimate of US Market exposure—around 110%—is well off from the current portfolio exposure—around 140%. To make matters worse, there is a domino effect: Returns-based performance attribution builds upon any errors in returns-based style analysis, compounding them.
Anyone paying for an actively managed investment product must have confidence that expected future active returns exceed fees. Returns-based style analysis and performance attribution are frequently used for this purpose. Can this analysis be trusted?
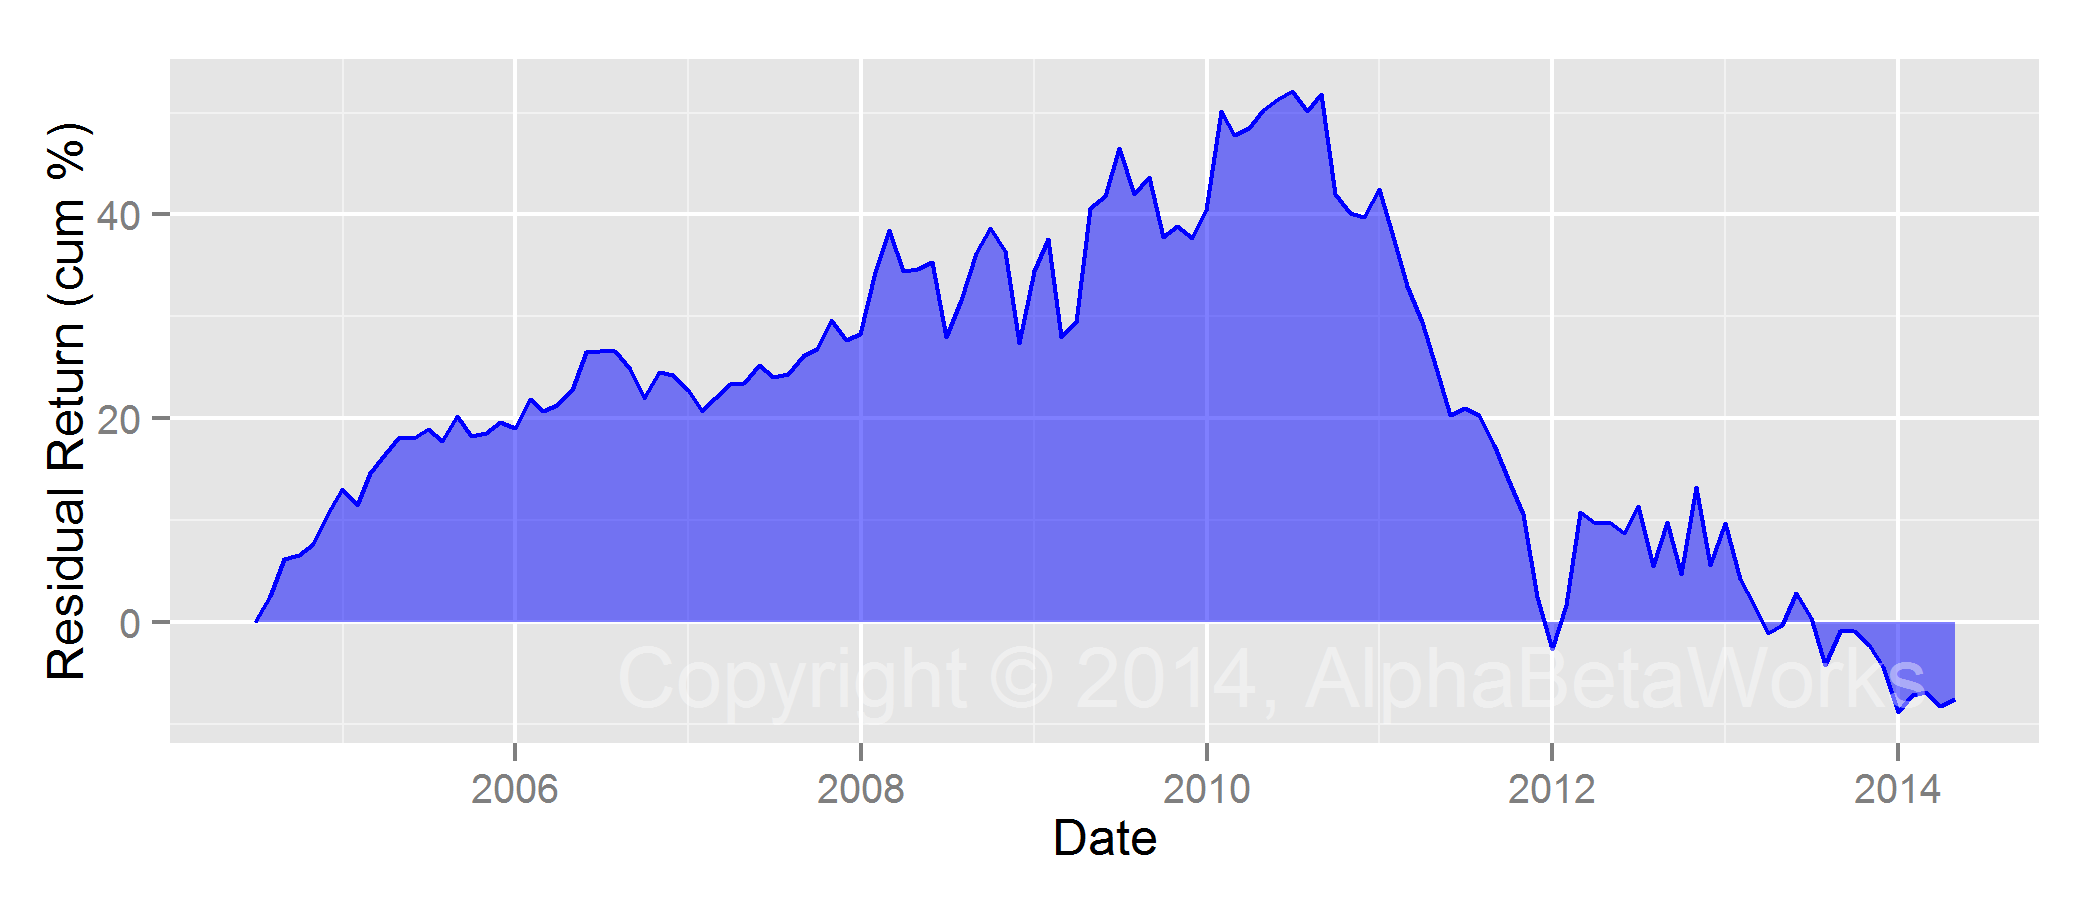
We estimated cumulative alpha, or residual return, for the Fairholme Fund with a single risk factor for the US Market using the returns-based exposure of 110% calculated above:
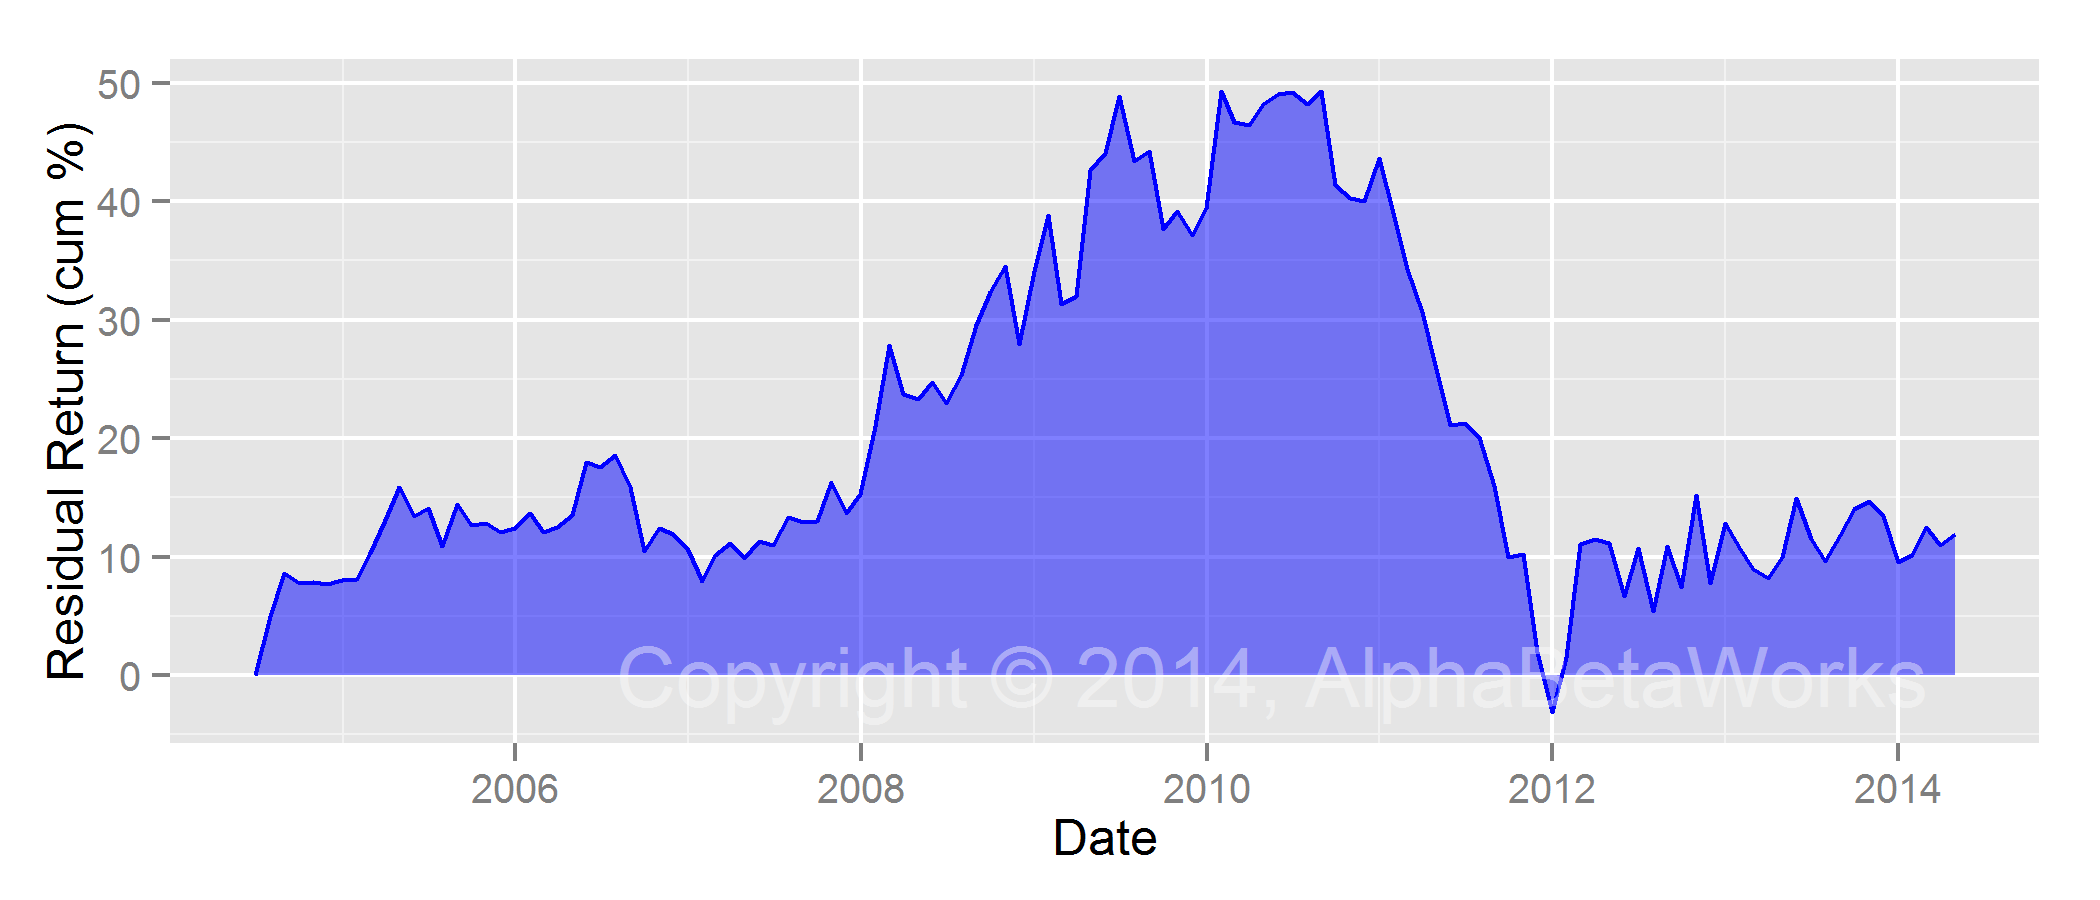
The Fairholme Fund (FAIRX) Cumulative Returns-based Alpha
Unsurprisingly, errors in the beta estimate lead to a flawed picture of a fund’s security-selection performance. The returns-based approach estimates cumulative alpha greater than 10%. AlphaBetaWorks approach, aggregating the betas of the individual portfolio positions throughout the period, produces a negative value:
The Fairholme Fund (FAIRX) Cumulative Single-factor Model Alpha
An investor who used returns-based style analysis and attribution would have estimated significant positive security-selection performance. In reality, an investor would have outperformed by taking the same market risks passively. A capable risk model specifically tuned for skill evaluation and performance prediction, such as the AlphaBetaWorks Statistical Equity Risk Model, averts this and similar pitfalls.
Conclusions
- Returns-based analysis can be effective—but only when a passive manager does not significantly vary exposures to market, sector, and macroeconomic factors.
- When an active manager varies bets, a returns-based analysis typically yields flawed estimates of portfolio risk.
- When a manager varies bets, a returns-based analysis may not even accurately estimate average portfolio risk.
- A returns-based analysis will be the least predictive for active managers. In fact, errors will be most pronounced for the most active funds:
- Estimates of a managers’ historical and current systematic risks may be flawed.
- Skilled funds may be deemed unskilled.
- Unskilled funds may be deemed skilled.
- An analysis and aggregation of factor exposures of individual holdings throughout portfolio history using a capable multi-factor risk model addresses these shortcomings.
More subtle, but no less dangerous, issues with investment risk and skill evaluation using returns-based performance attribution will be discussed in subsequent articles.
AlphaBetaWorks Risk Models and Performance Analytics Platform have been specifically engineered to avoid such issues and refined on thousands of hedge fund and mutual fund portfolios over decades of history. We look forward to sharing more of our insights.
Copyright © 2012-2014, AlphaBetaWorks, a division of Alpha Beta Analytics, LLC. All rights reserved.
Content may not be republished without express written consent.


Hi,
I read your recent article on Seeking Alpha regarding “Are You Paying Active Fees For Passive Management?”, which I really liked the gist of. While reading the article, it reminded me of an article I read some time back about Sharpe’s “Returns Based Style analysis” linked here:
http://web.stanford.edu/~wfsharpe/art/sa/sa.htm
I also clicked on a link in your SA article that brought me to this webpage (above), and I am having a hard time understanding the “flaws” that you point out above with regards to returns-based style analysis and performance attribution and how they relate to Sharpe’s article (above). It appears to me that Sharpe does look at performance as a function of time, while (at least to me) you say that that is not the case with such analyses.
I would appreciate your response to clarify where I might be wrong in my interpretation of either your article (above) and Sharpe’s article.
Thanks!
Ray Pierce
Thank you for referencing Sharpe’s important paper on returns-based style analysis and performance measurement.
This paper describes a method that “uses only realized fund returns to infer the typical exposures of the fund to the asset classes.”
“The goal is to find the “best” set of asset class exposures (bij values) that totals to 100% and conforms with rudimentary information concerning the fund’s policies (typically, no net short positions in any asset class; for funds known to employ short positions, other bounds may be invoked). In this context, the best such set of exposures is the one for which the variance of ei is the least.”
If all the information that is available on an active portfolio is a returns time series, this approach is probably the best one can do. In this case, it is also probably best not to invest. The problem with this approach is that it attempts to estimate “typical” exposures over a period when they may have varied. When variation in exposures is large, this “typical” exposure estimate will be incorrect. Our article illustrated how, for one fund that has dramatically varied exposures over the past 10 years (FAIRX), typical market exposure estimated using the returns-based approach proposed by Sharpe is a poor estimate of the average exposure and leads to a misleading conclusion about excess returns.
One of the common mitigations for the style change problem is to use rolling time windows for the regression, but this and others come with liabilities and tradeoffs of their own. More information on the mitigation techniques is available at: http://en.wikipedia.org/wiki/Returns-based_style_analysis.
Another example may help: Suppose a fund had 50% in bonds and 50% in stocks for years 1-2, switching to 100% stocks at the start of year 3. Depending on the method, returns-based style analysis will conclude that the fund had 50% invested in stocks at the beginning of year 3 and then gradually increases exposure over the year, still below 100% stocks at year-end. Risk estimates and all the derived data will be wrong from the beginning of year 3 on. This example is not theoretical; some mutual funds and many hedge funds routinely vary their market and sector factor bets by 30-50% over a year.
ABWInsights