
We earlier discussed how nominal returns and related investment performance metrics revert: Since portfolio performance primarily comes from systematic (factor) exposures, such simplistic metrics merely promote the high-risk portfolios during the bullish regimes and the low-risk portfolios during the bearish regimes. As regimes change, the leaders flip. We also showed that, when security selection returns are distilled with a robust factor model, performance persists within all U.S. equity Style Boxes. Prompted by reader interest, we now investigate performance persistence within International Style Boxes.
Measuring the Persistence of International Portfolio Returns
As in our earlier work on return persistence, we examine all Form 13F filings for the past 10 years. This survivorship-free portfolio database covers all institutions that exercised investment discretion over at least $100 million and yields approximately 3,600 international portfolios with sufficiently long histories, low turnover, and broad positions to be suitable for the study.
We split the 10 years of history into two random 5-year samples and compared performance metrics of each portfolio over these two periods. The correlation between metrics over the sample periods measures the metrics’ persistence.
International Portfolios’ Performance Persistence
The Reversion of International Portfolios’ Nominal Returns
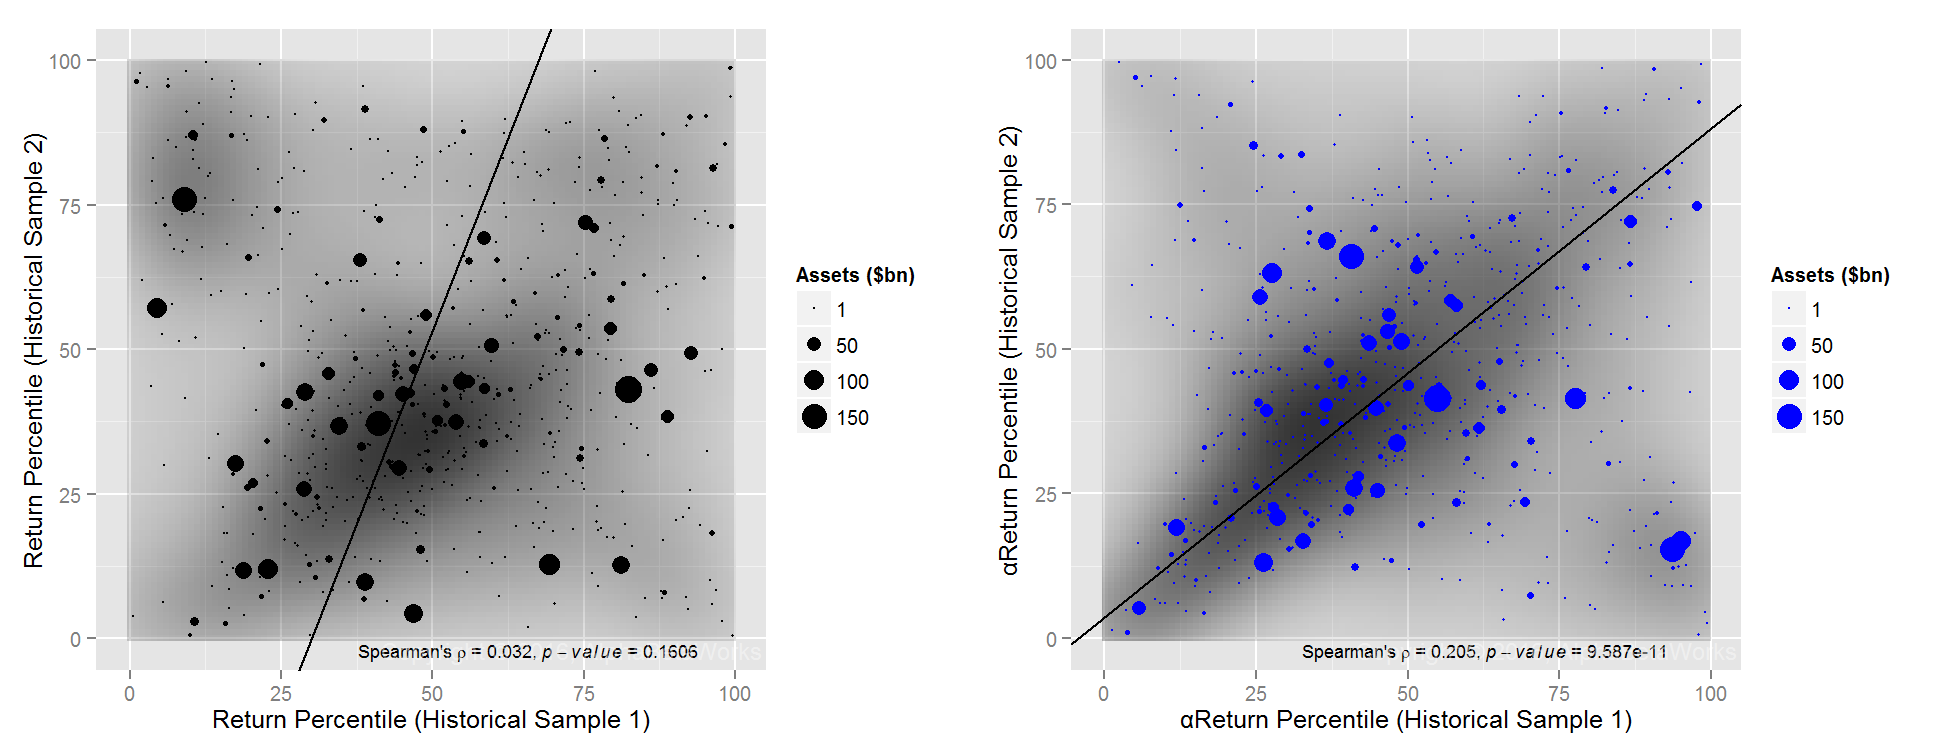
The following chart plots the rankings of each portfolio’s nominal returns during the two sample periods. The x-axis plots return percentile, or ranking, in the first sample period. The y-axis plots return percentile, or ranking, in the second sample period. The best-performing international portfolios of the first period have x-values near 100; the best-performing portfolios of the second period have y-values near 100:
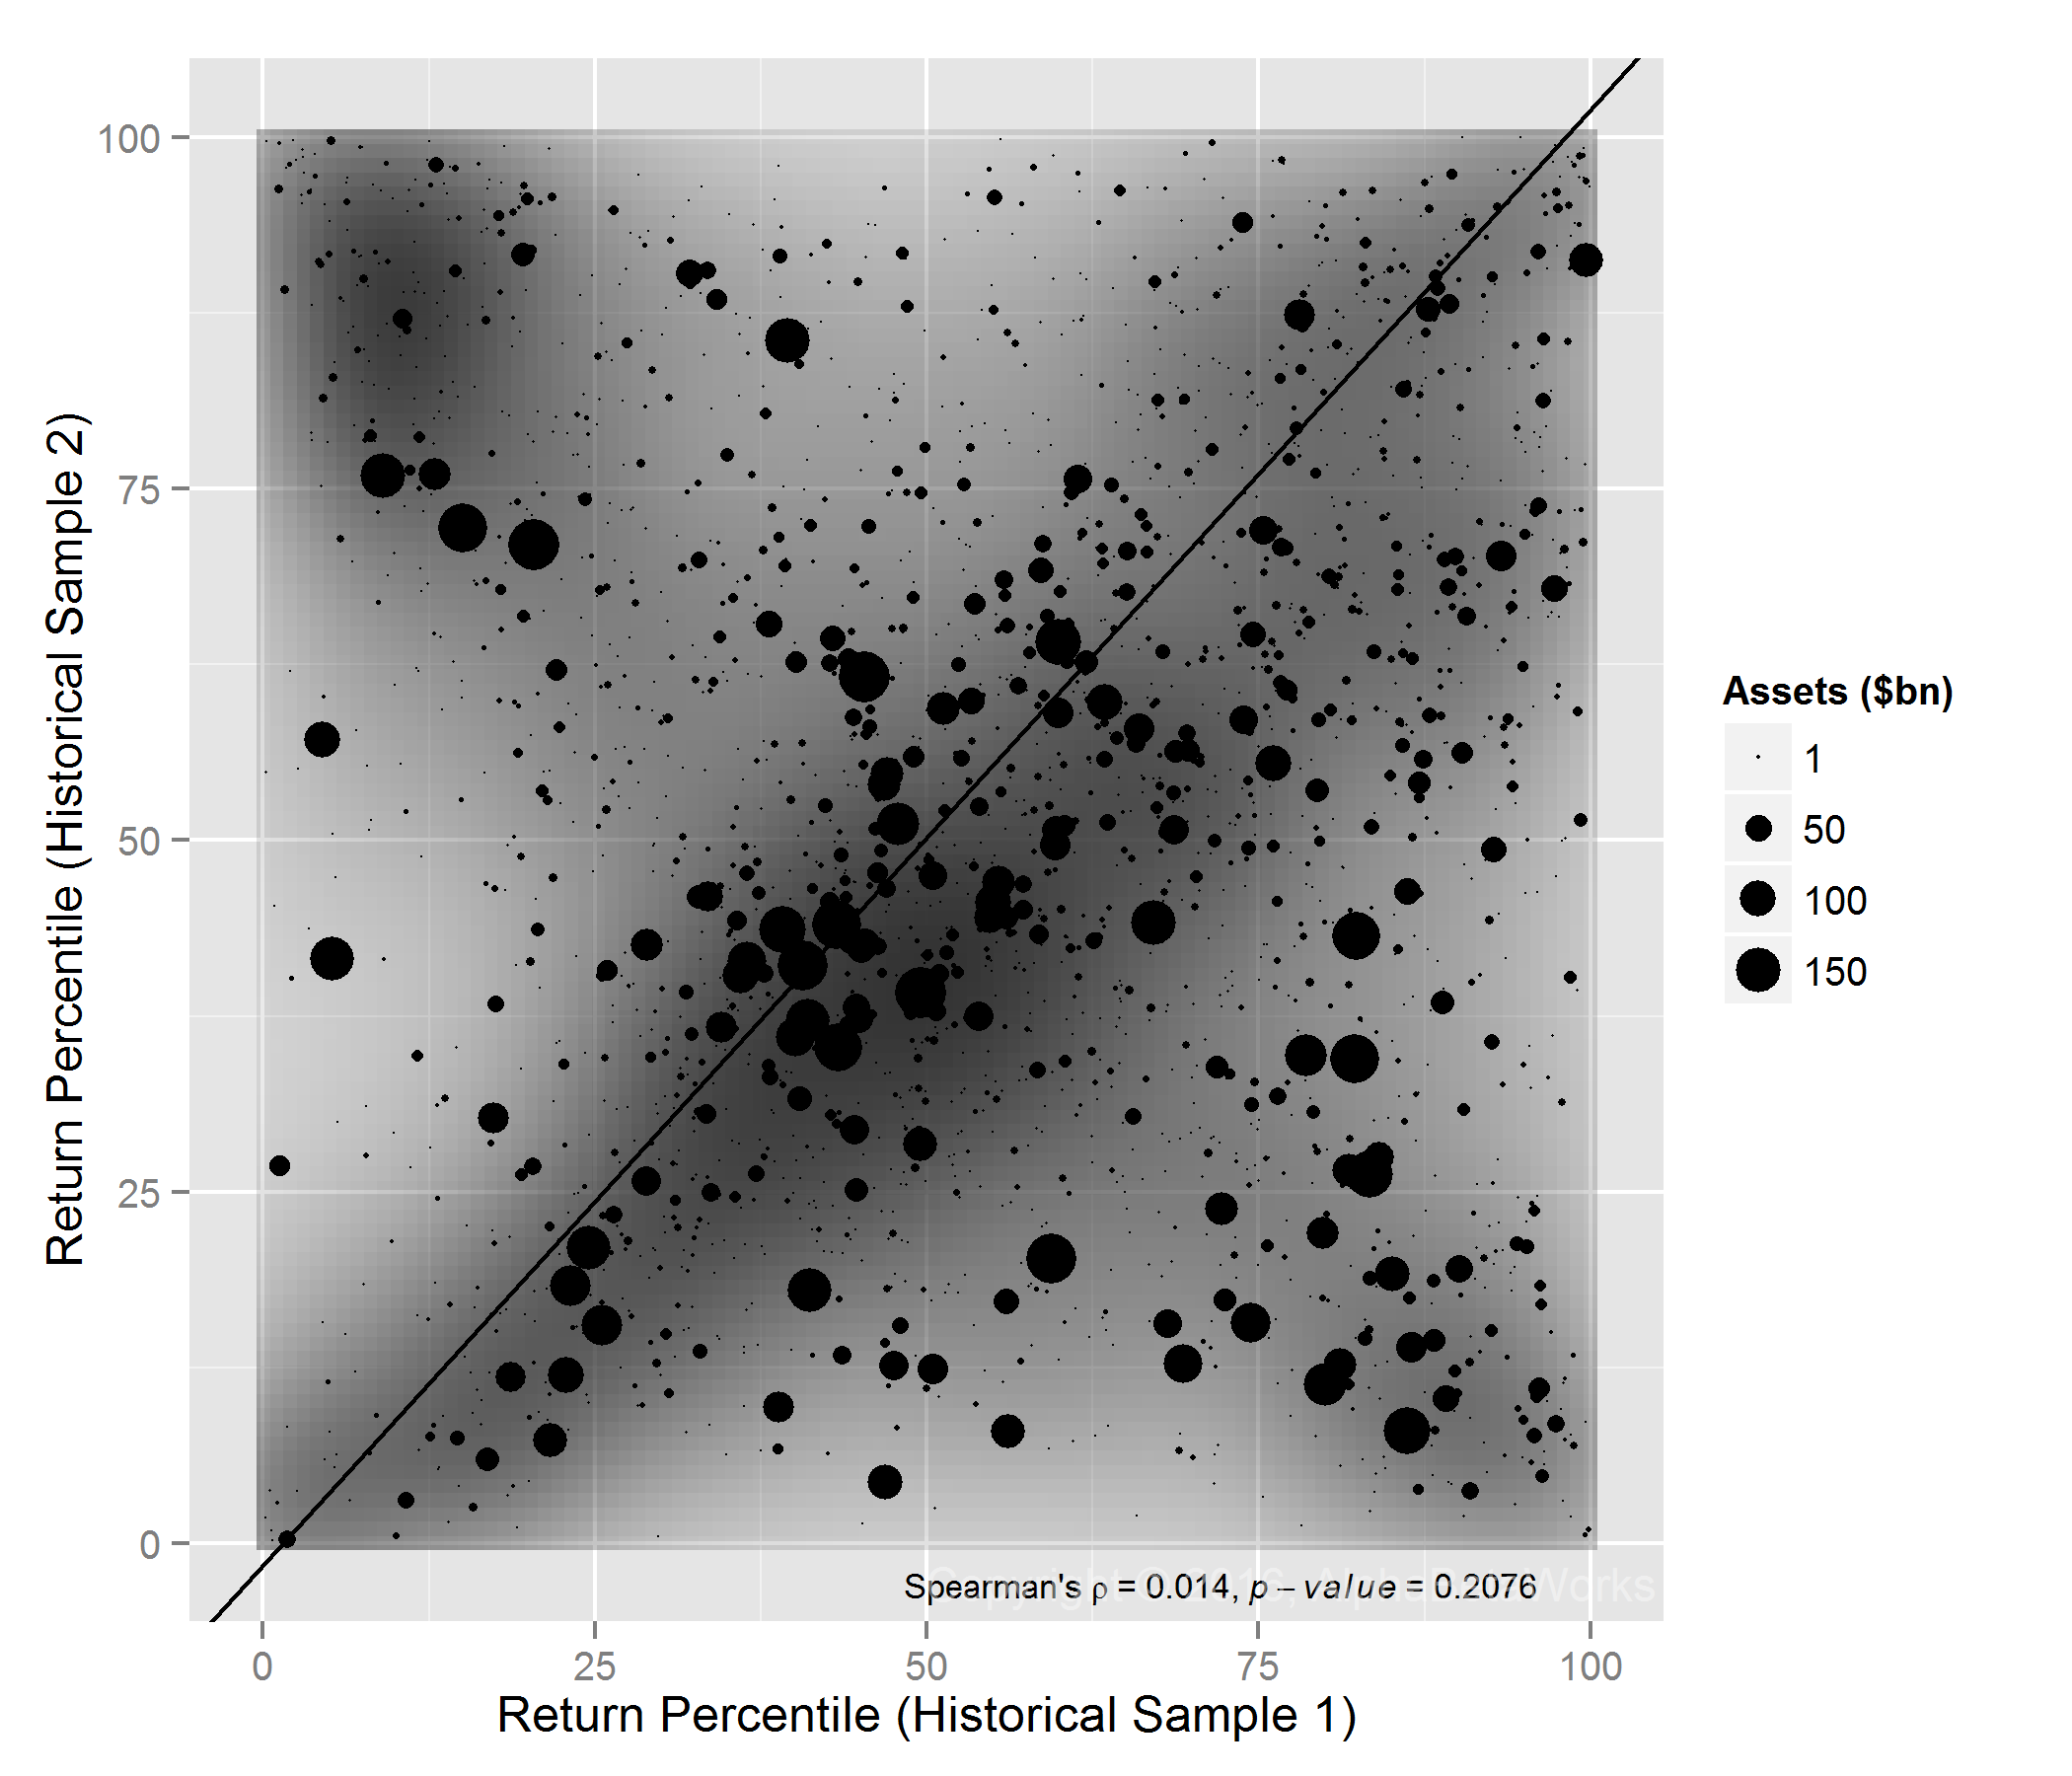
13F Portfolios, International Positions: Correlation between the rankings of nominal returns for two historical samples
Whereas past performance of U.S. equity portfolios was a (negative) predictor of future results, there is no significant correlation between the two for international portfolios – best- and worst-performers tend to become average.
The Persistence of International Portfolios’ Security Selection Returns
Due to the domineering effects of Market and other systematic factors, top-performing managers during the bullish regimes are those that take the most risk, and top-performing managers during the bearish regimes are those that take the least risk. Since Market returns are approximately random, nominal returns do not persist. To eliminate this noise, the AlphaBetaWorks Performance Analytics Platform calculates each portfolio’s return from security selection net of factor effects. αReturn is the return a manager would have generated if all factor returns had been flat.
International portfolios with above-average αReturns in one period are likely to maintain them in the other. In the following chart, this relationship is represented by the concentration of portfolios in the bottom left (laggards that remained laggards) and top right (leaders that remained leaders):
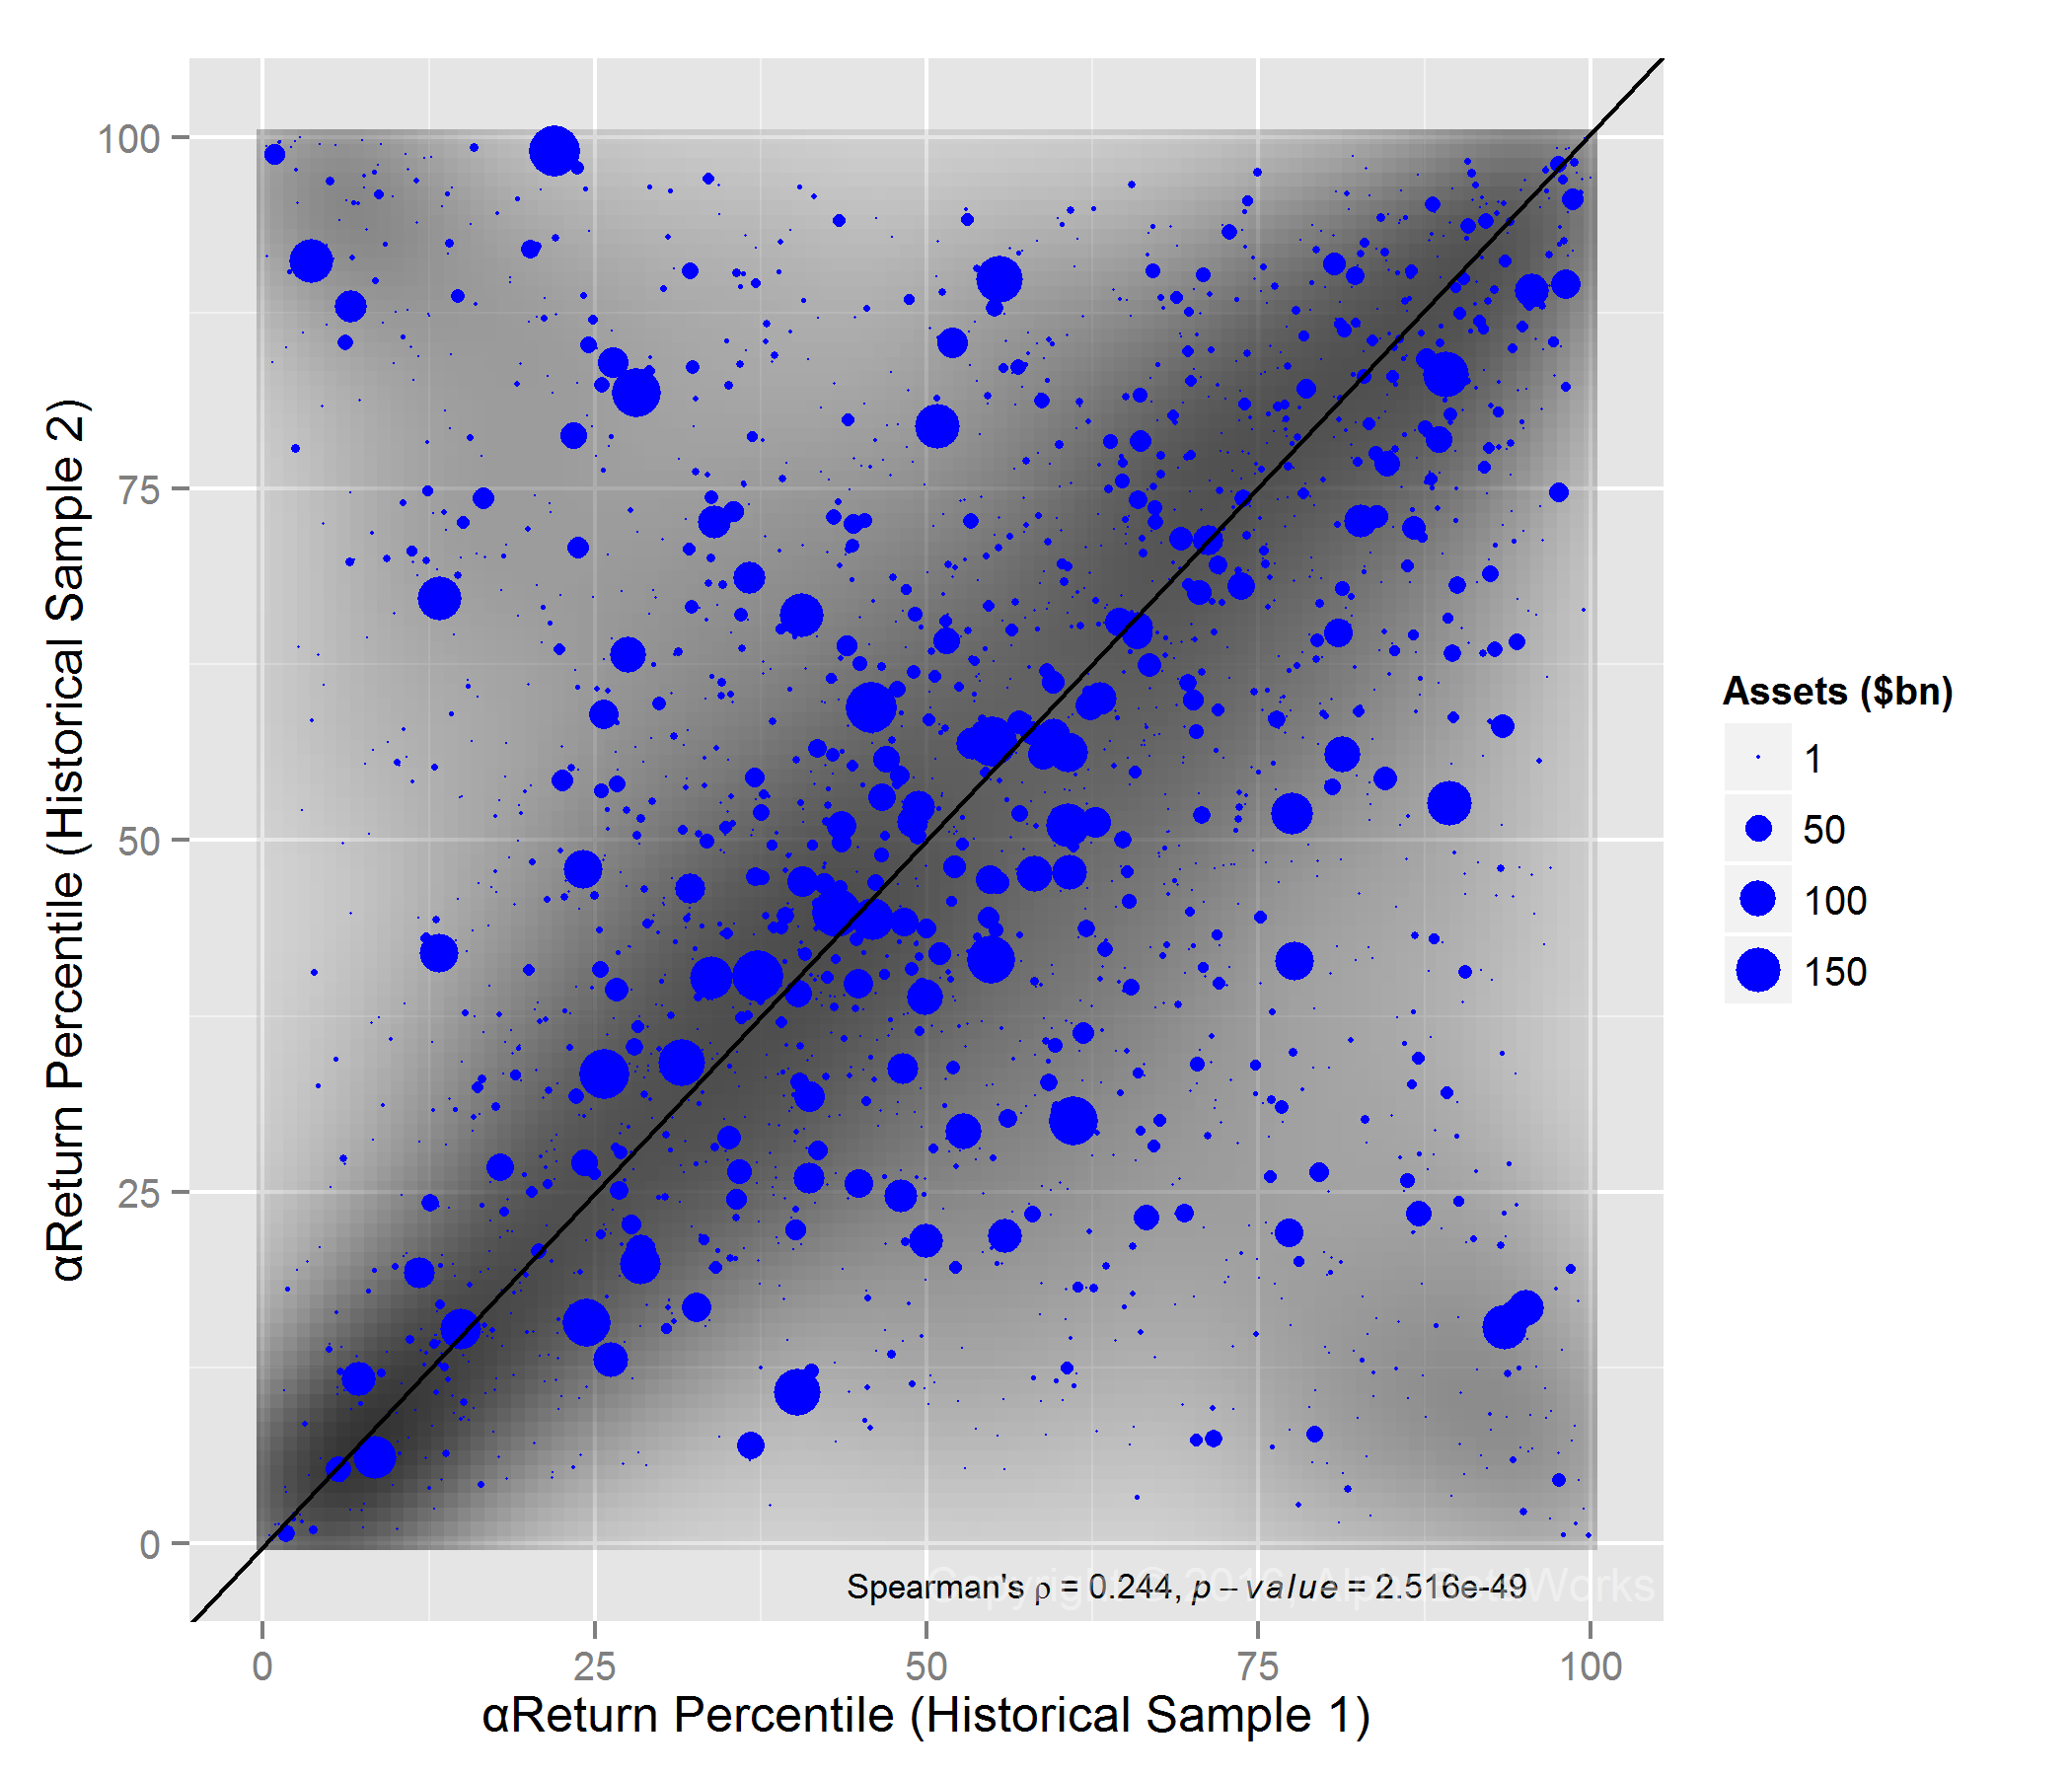
13F Portfolios, International Positions: Correlation between the rankings of αReturns for two historical samples
This test of persistence across two arbitrary 5-year samples is strict. Persistence of security selection skill is even higher over shorter periods.
Performance Persistence within International Style Boxes
Measures of investment style such as Size (portfolio market capitalization) and Value/Growth (portfolio valuation) are common approaches to grouping portfolios. Readers frequently ask whether the reversion of nominal returns and related metrics can be explained by Style Box membership. Perhaps we merely observed reversion in leadership that is eliminated by controlling for Style?
To test this, we compared performance persistence within each of the four popular Style Boxes.
International Large-Cap Value Portfolios’ Performance Persistence
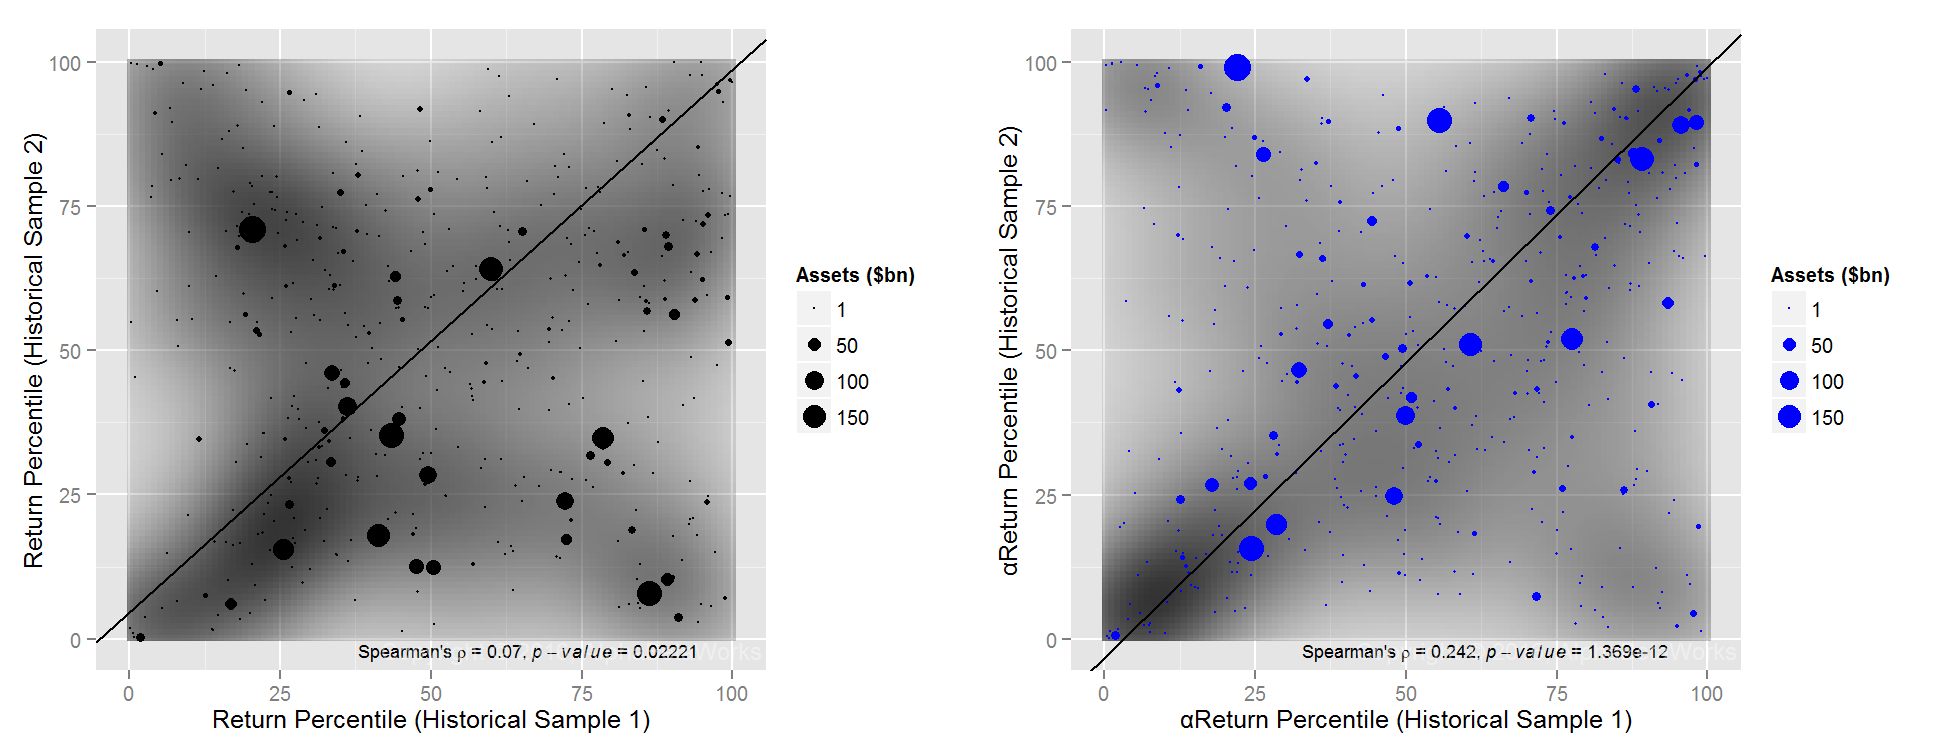
The International Large-cap Value Style Box shows the highest persistence of long-term stock picking results, yet the relationship between nominal returns within it is still nearly random. Powerful performance analytics provide the biggest edge for this International Style Box:
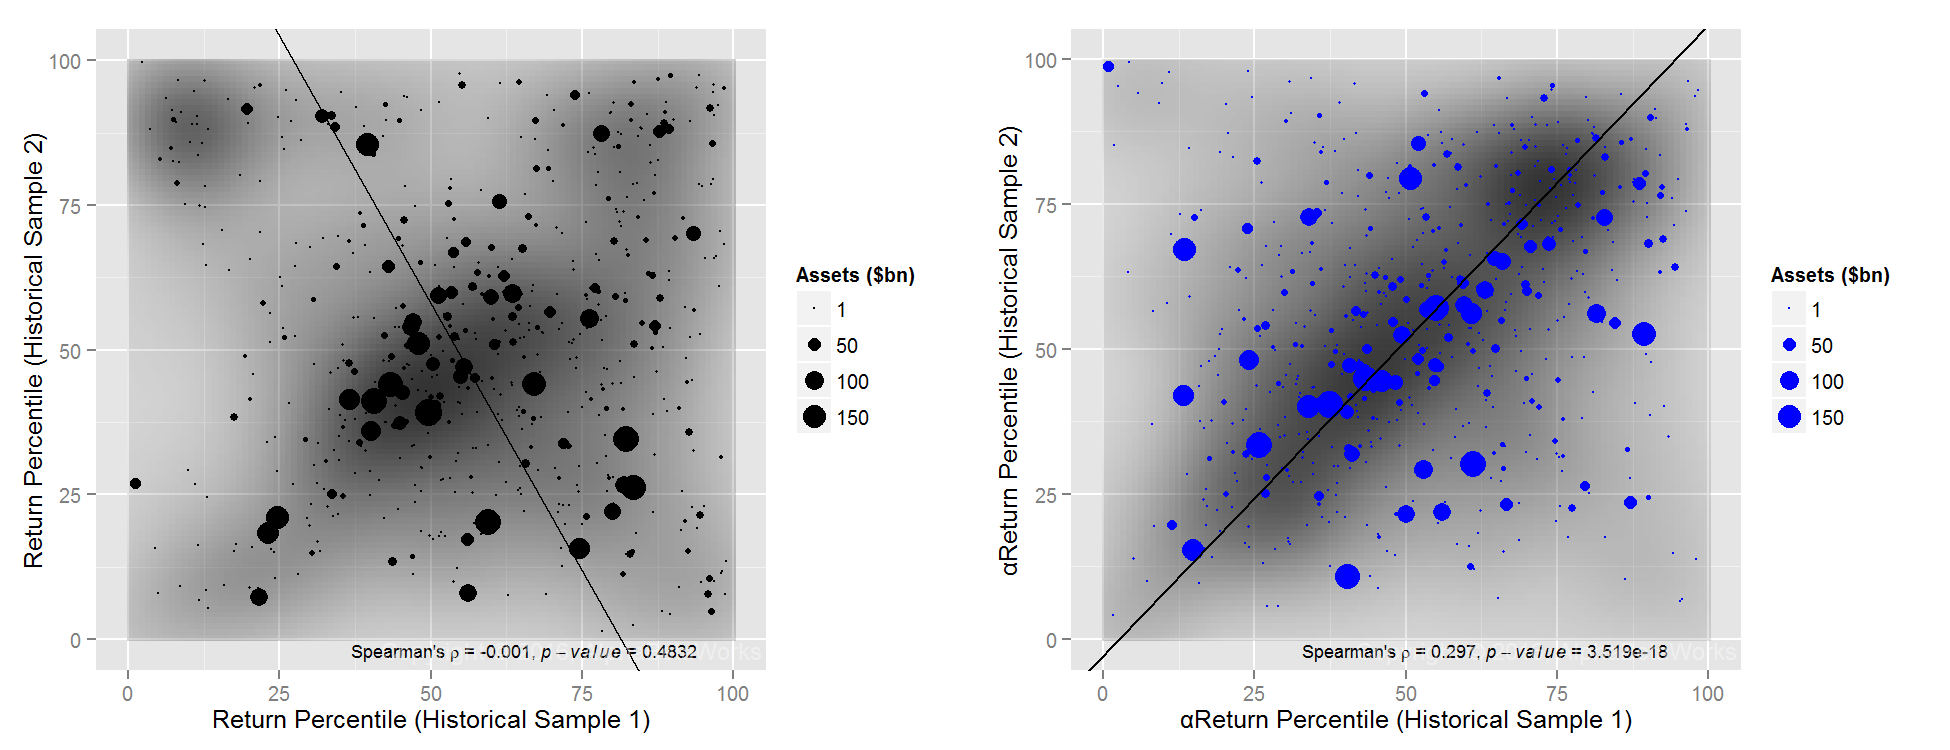
Large-Cap Value 13F Portfolios, International Positions: Correlation between the rankings of nominal returns αReturns for two historical samples
International equity portfolios differ from U.S. equity portfolios, where security selection persistence was highest for the Small-cap Value Style Box.
International Large-Cap Growth Portfolios’ Performance Persistence
International portfolios in the Large-cap Growth Style Box also show a nearly random relationship between the two periods’ returns. However, their αReturns persist strongly. Whereas large-cap growth stock picking is treacherous for U.S. equity portfolios, it is more rewarding internationally:
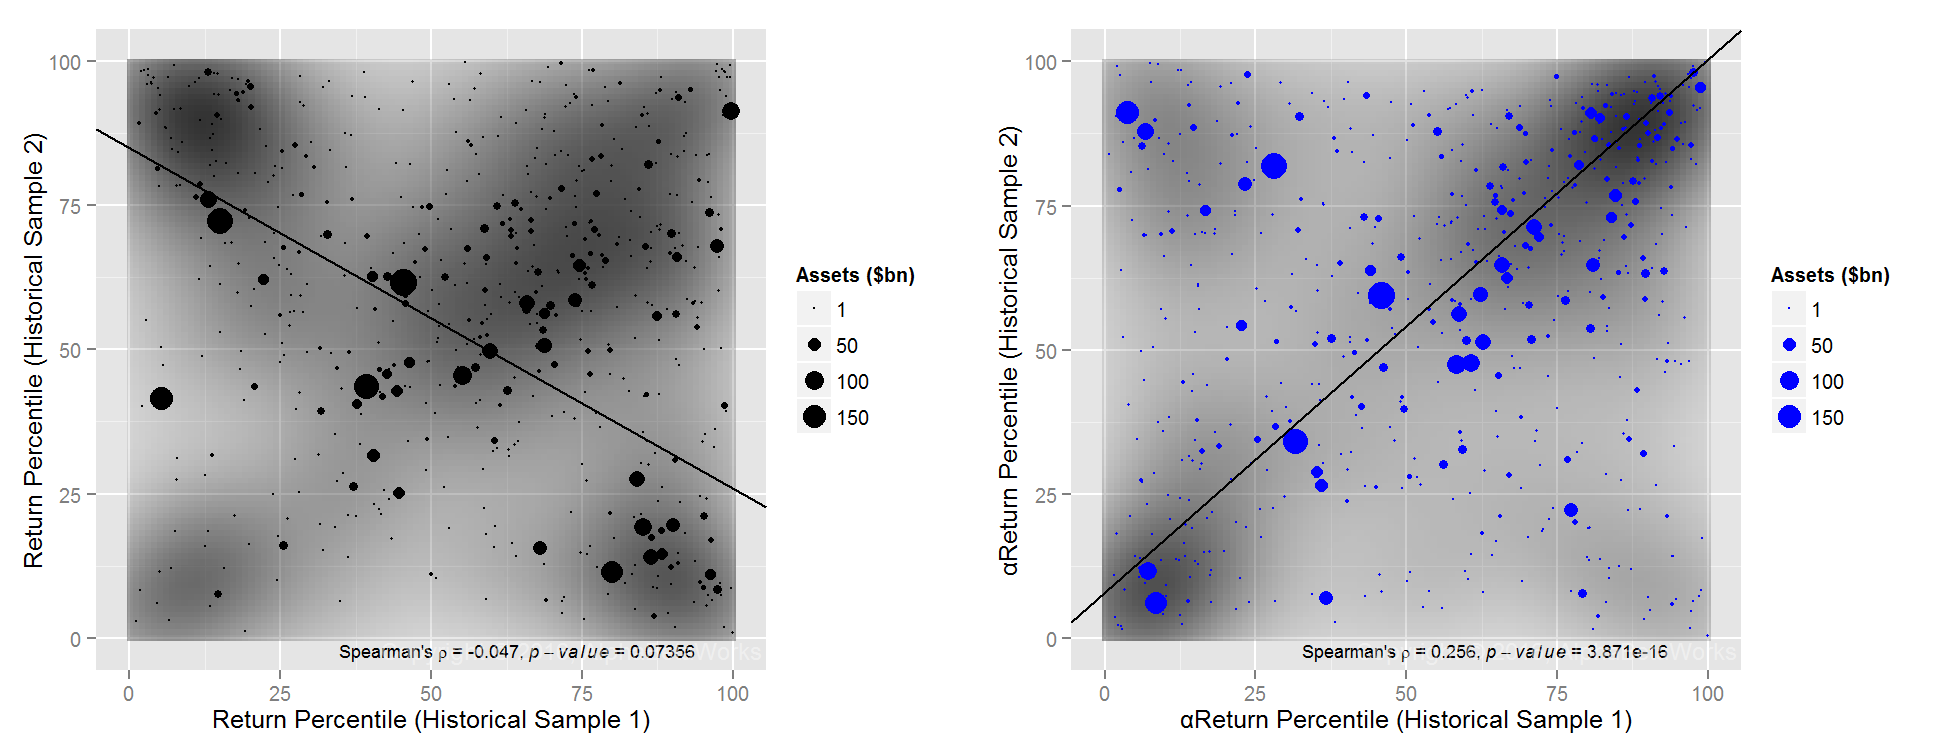
Large-Cap Growth 13F Portfolios, International Positions: Correlation between the rankings of nominal returns αReturns for two historical samples
International Small-Cap Value Portfolios’ Performance Persistence
International portfolios in the Small-cap Value Style Box have the least persistent αReturns, in contrast to the U.S. portfolios:
Small-Cap Value 13F Portfolios, International Positions: Correlation between the rankings of nominal returns αReturns for two historical samples
International Small-Cap Growth Portfolios’ Performance Persistence
αReturns within the International Small-cap Growth Style Box persist almost as strongly as within the International Large-cap Style Boxes:
Small-Cap Growth 13F Portfolios, International Positions: Correlation between the rankings of nominal returns αReturns for two historical samples
Summary
- Whereas nominal returns and related simplistic metrics of investment skill revert, security selection performance – once properly distilled with a capable factor model – persists.
- The randomness and reversion of nominal returns and the persistence of security selection skill hold across all International Style Boxes.
- Security selection performance persists most strongly for International Large-cap portfolios.


