And What Did They Own at Year-end?
Contrary to popular wisdom, 2015 was a good year for stock picking. The problem is that few know who the good stock pickers are. Further, good stock pickers may be poor risk managers. In this article we use a robust risk model to track the top U.S. stock pickers and to distill their skill.
Since genuine investment skill persists, top U.S. stock pickers tend to generate persistently positive returns from security selection. Consequently, a hedged (market-neutral) portfolio of their net consensus longs (relative overweights) tends to generate positive returns, independent of the Market. Below we illustrate this portfolio’s performance and reveal its top positions.
Identifying the Top U.S. Stock Pickers
This study covers portfolios of all institutions that have filed Form 13F. This is the broadest and most representative survivorship-free portfolio database comprising thousands of firms: hedge funds, mutual fund companies, investment advisors, and all other institutions with over $100 million in U.S. long assets. Approximately 5,000 firms had sufficiently long histories, low turnover, and broad portfolios suitable for skill evaluation.
Nominal returns and related simplistic metrics of investment skill (Sharpe Ratio, Win/Loss Ratio, etc.) are dominated by Market and other systematic factors and hence revert. As market regimes change, top performers tend to become bottom performers. To eliminate these systematic effects and estimate residual performance due to stock picking skill, the AlphaBetaWorks Performance Analytics Platform calculates each portfolio’s return from security selection – αReturn. αReturn is the performance a portfolio would have generated if all factor returns had been flat.
Each month we identify the five percent of 13F-filers with the most consistently positive αReturns over the prior 36 months. This expert panel of the top stock pickers typically includes 100-150 firms. Since manager fame and firm size are poor proxies for skill, the panel is an eclectic bunch. It currently includes some hedge funds (Lumina Fund Management, Palo Alto Investors, and Chilton Investment Company), though few of the famed gurus. Many of the top long stock pickers are investment management firms (Eaton Vance Management, Fiduciary Management Inc., and Aristotle Capital Management), as well as banks, endowments, and trust companies.
Performance of the Top U.S. Stock Pickers
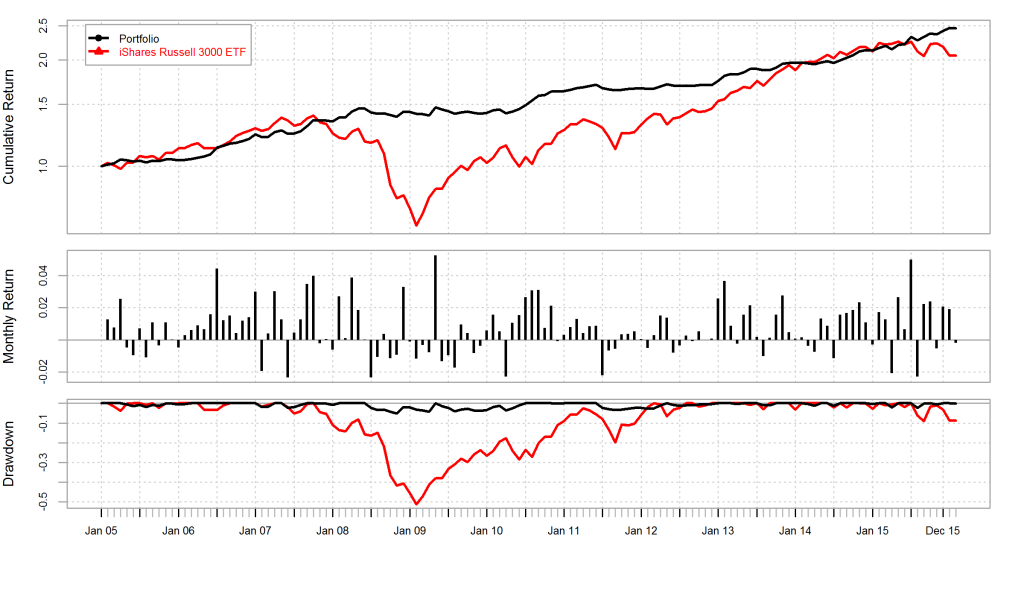
Since security selection skill persists, managers with above-average αReturns in the past are likely to maintain them in the future. Therefore, a hedged portfolio that combines the top U.S. stock pickers’ net consensus longs (relative overweights), lagged 2 months to account for filing delay (the ABW Expert Aggregate), delivers consistent positive returns as illustrated below:
| 2005 | 2006 | 2007 | 2008 | 2009 | 2010 | 2011 | 2012 | 2013 | 2014 | 2015 | 2016 | |
| ABW Expert Aggregate | 4.56 | 14.43 | 12.74 | 5.95 | -1.25 | 15.35 | 2.20 | 2.24 | 15.47 | 8.81 | 13.16 | 1.70 |
| iShares Russell 3000 ETF | 9.04 | 15.65 | 4.57 | -37.16 | 28.21 | 16.81 | 0.78 | 16.43 | 32.97 | 12.41 | 0.34 | -5.72 |
ABW Expert Aggregate achieved higher returns than those of the broad market with less than half of its volatility:
| ABW Expert Aggregate | iShares Russell 3000 ETF | |
| Annualized Return | 8.36 | 6.40 |
| Annualized Standard Deviation | 5.25 | 15.50 |
| Annualized Sharpe Ratio (Rf=0%) | 1.59 | 0.41 |
The consistency of top stock pickers’ αReturns manifests itself as low downside volatility and low losses of the ABW Expert Aggregate:
| ABW Expert Aggregate | iShares Russell 3000 ETF | |
| Semi Deviation | 1.00 | 3.33 |
| Gain Deviation | 1.19 | 2.40 |
| Loss Deviation | 0.70 | 3.45 |
| Downside Deviation (MAR=10%) | 1.09 | 3.43 |
| Downside Deviation (Rf=0%) | 0.64 | 3.04 |
| Downside Deviation (0%) | 0.64 | 3.04 |
| Maximum Drawdown | 5.06 | 51.24 |
| Historical VaR (95%) | -1.81 | -7.58 |
| Historical ES (95%) | -2.21 | -9.96 |
One often reads commentary on the challenges stock pickers faced in 2015. This analysis typically fails to identify skill and merely reveals the obvious: average managers do poorly in a low-return environment. In fact, 2015 was one of the strongest years for top stock pickers. It is the indiscriminate rallies such as that of 2009 that prove challenging.
Unfortunately, some skilled managers suffered from underdeveloped risk systems, and losses from hidden systematic risks concealed their stock-picking results. For instance, some highly skilled stock pickers with unintended small-cap (short Size) exposure experienced 5-10% systematic headwinds in 2015. A robust risk management program would have partially or wholly mitigated these.
Top U.S. Stock Pickers’ Consensus Positions
Since the top stock pickers are rarely the most celebrated firms, their top consensus longs are rarely the hottest stocks. Below are the top 10 holdings of the ABW Expert Aggregate at year-end 2015:
| Symbol | Name | Exposure (%) |
| EA | Electronic Arts Inc. | 2.29 |
| V | Visa Inc. Class A | 1.26 |
| XOM | Exxon Mobil Corporation | 0.66 |
| GTE | Gran Tierra Energy Inc. | 0.65 |
| DIS | Walt Disney Company | 0.58 |
| PEP | PepsiCo, Inc. | 0.57 |
| MNST | Monster Beverage Corporation | 0.57 |
| ORLY | O’Reilly Automotive, Inc. | 0.56 |
| JKHY | Jack Henry & Associates, Inc. | 0.51 |
| TTGT | TechTarget, Inc. | 0.50 |
Top Stock Pickers’ Exposure to Electronic Arts (EA)
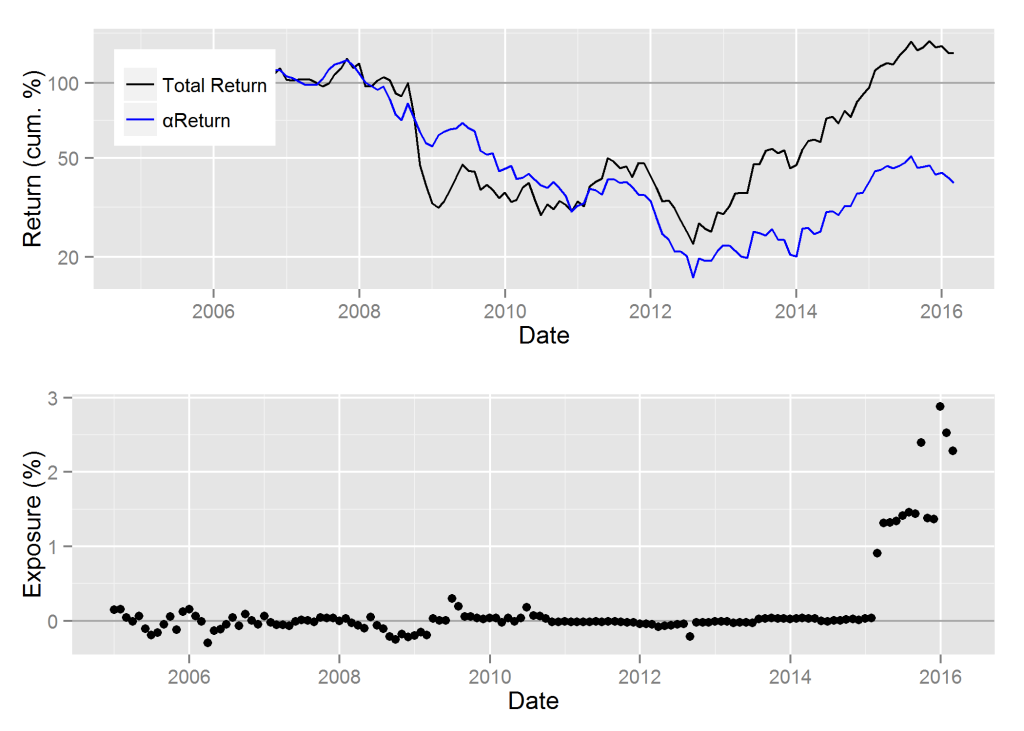
Top stock pickers had negligible exposure to EA until 2015. In early-2015 EA became one of the largest exposures within our Expert Aggregate.
The top panel on the following chart shows cumulative nominal returns in black and cumulative residual returns (αReturns) in blue. Residual return or αReturn is the performance net of the systematic factors defined by the AlphaBetaWorks Statistical Equity Risk Model – the performance EA would have generated if systematic return had been flat. The bottom panel shows exposure to EA within the ABW Expert Aggregate:

Cumulative αReturns of EA and Exposure to EA within the Hedged Portfolio of the Top U.S. Stock Pickers’ Net Consensus Longs
Top Stock Pickers’ Exposure to Visa Inc (V)
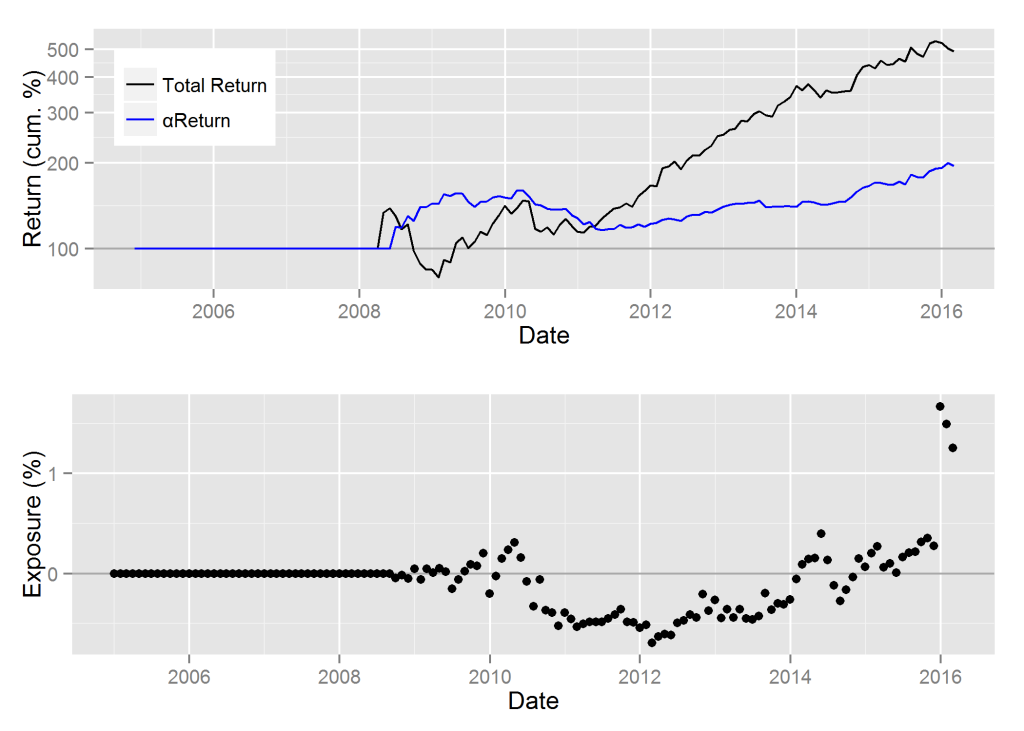
Our Expert Aggregate was underweight (short) V between 2011 and 2014 – a period of flat-to-negative αReturn when V lagged a passive portfolio with matching risk. V became an ABW Expert Aggregate consensus long by early 2014 – the start of a strong positive αReturn period:

Cumulative αReturns of V and Exposure to V within the Hedged Portfolio of the Top U.S. Stock Pickers’ Net Consensus Longs
Top Stock Pickers’ Exposure to Exxon Mobil (XOM)
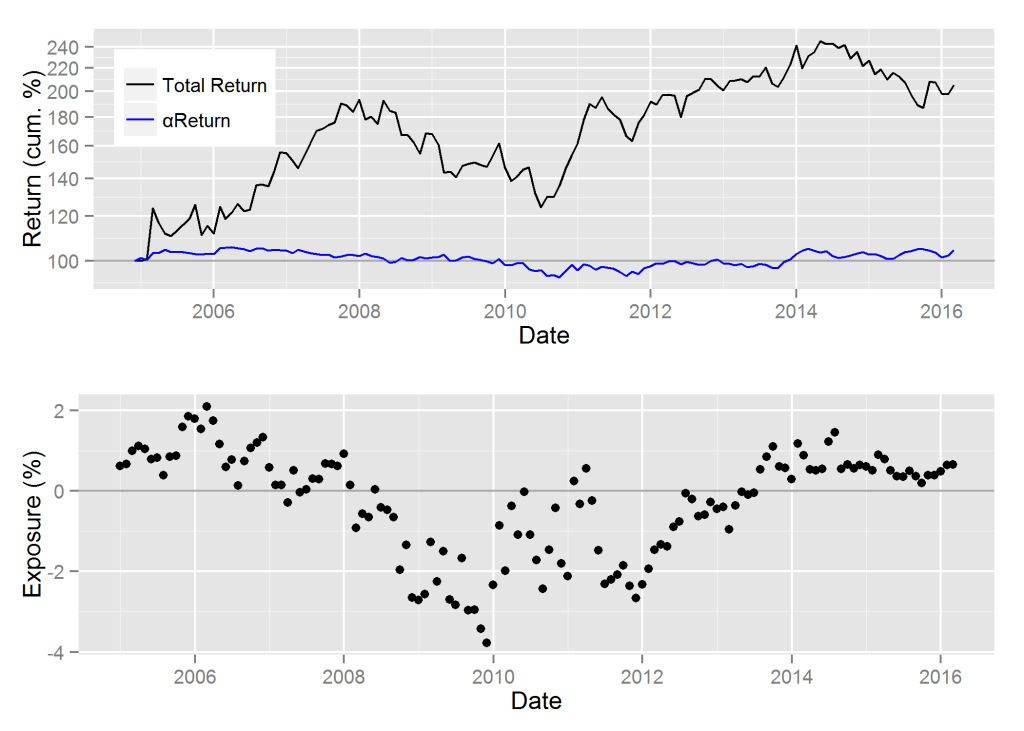
The Expert Aggregate was mostly underweight (short) XOM between 2008 and 2013, but grew exposure from 2012. By 2014 XOM was a top bet. This proved profitable during the 2014-2015 energy rout when XOM remained an island of stability, delivering positive αReturn:

Cumulative αReturns of XOM and Exposure to XOM within the Hedged Portfolio of the Top U.S. Stock Pickers’ Net Consensus Longs
Conclusions
- Robust analytics built on predictive risk models identify the top stock pickers in the sea of mediocrity.
- Top stock pickers’ portfolios deliver consistently positive αReturns (residual returns), independent of the Market.
- Top stock pickers’ net consensus longs (relative overweights) tend to generate positive future αReturns and net consensus shorts (relative underweights) tend to generate negative future αReturns .
- Top stock pickers are rarely the most celebrated firms and their consensus longs are rarely the most celebrated stocks.
- The most celebrated stocks frequently appear as top stock pickers’ consensus shorts.


