Due to the congestion of their investor base, crowded hedge fund stocks are volatile and vulnerable to mass selling. The risk-adjusted performance of consensus bets tends to disappoint. In two past pieces we illustrated the toll of crowding on exploration and production as well as internet companies. We also reviewed two specific crowded bets: SanDisk and
While crowded hedge fund ideas do poorly most of the time, they don’t always. Market efficiency varies across sectors, and some industries are more analytically tractable than others. In this article we survey the sectors with the best and worst hedge fund performance records. We will illustrate when investors should stay clear of crowded ideas and when they can embrace them.
Analyzing Hedge Fund Performance and Crowding
To explore performance and crowding we analyze hedge fund sector holdings (HF Sector Aggregate) relative to the Sector Market Portfolio (Sector Aggregate). HF Sector Aggregate is position-weighted, and Sector Aggregate is capitalization-weighted. This follows the approach of our earlier articles on aggregate and sector-specific hedge fund crowding.
Hedge Funds’ Worst Sector: Miscellaneous Metals and Mining
Historical Hedge Fund Performance: Miscellaneous Metals and Mining
Hedge funds’ worst security selection performance for the past ten years has been in the Miscellaneous Metals and Mining sector. The figure below plots historical HF Miscellaneous Metals and Mining Aggregate’s return. Factor return is due to systematic (market) risk. It is the return of a portfolio that replicates HF Sector Aggregate’s market risk. The blue area represents positive and the gray area represents negative risk-adjusted returns from security selection (αReturn).
Even without adjusting for risk, crowded bets have done poorly. They consistently underperformed the factor portfolio, missing out on over 300% in gains.
The HF Sector Aggregate’s risk-adjusted return from security selection (αReturn) is the return it would have generated if markets were flat – all market effects on performance have been eliminated. This idiosyncratic performance of the crowded portfolio is a decline of 87%. Crowded bets in this sector are especially dangerous, given their persistently poor performance:

Hedge Fund Miscellaneous Metals and Mining Sector Aggregate Historical Security Selection Performance
In this sector, hedge funds lost $900 million to other market participants. In commodity industries, the recipients of this value transfer are usually private investors and insiders.
Current Hedge Fund Bets: Miscellaneous Metals and Mining
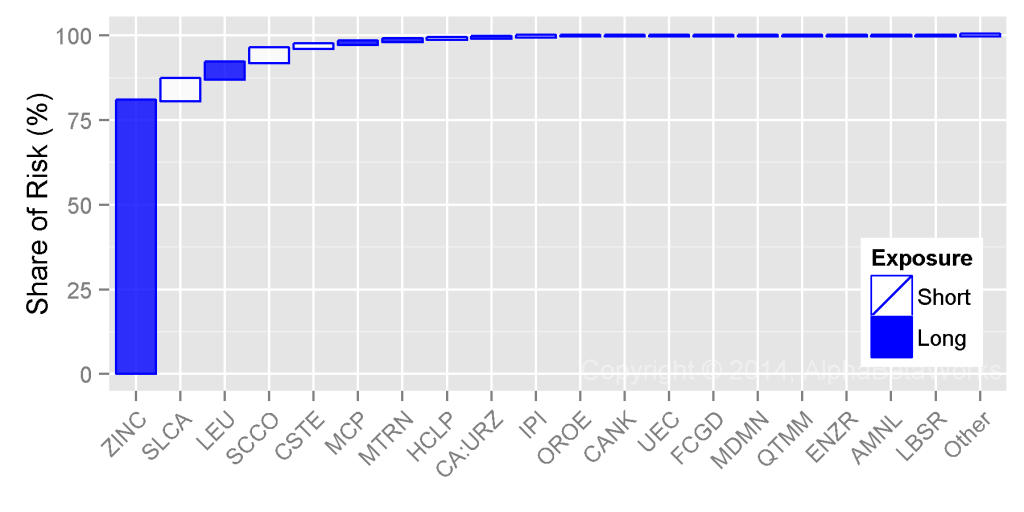
The following stocks contributed most to the relative residual (security-specific) risk of the HF Miscellaneous Metals and Mining Sector Aggregate as of Q3 2014. Blue bars represent long (overweight) exposures relative to the Sector Aggregate. White bars represent short (underweight) exposures. Bar height represents contribution to relative stock-specific risk:
The following table contains detailed data on these crowded bets. Large and illiquid long (overweight) bets are most at risk of volatility, mass liquidation, and underperformance:
| Exposure (%) | Net Exposure | Share of Risk (%) | |||||
| HF Sector Aggr. | Sector Aggr. | % | $mil | Days of Trading | |||
| ZINC | Horsehead Holding Corp. | 72.74 | 2.41 | 70.33 | 148.5 | 15.6 | 80.55 |
| SLCA | U.S. Silica Holdings, Inc. | 0.30 | 9.68 | -9.39 | -19.8 | -0.2 | 6.45 |
| LEU | Centrus Energy Corp. Class A | 4.54 | 0.22 | 4.32 | 9.1 | 17.2 | 4.85 |
| SCCO | Southern Copper Corporation | 7.69 | 70.19 | -62.51 | -132.0 | -2.3 | 4.18 |
| CSTE | CaesarStone Sdot-Yam Ltd. | 0.00 | 5.18 | -5.18 | -10.9 | -0.8 | 1.14 |
| MCP | Molycorp, Inc. | 3.84 | 0.84 | 3.01 | 6.3 | 1.7 | 0.92 |
| MTRN | Materion Corporation | 7.15 | 1.82 | 5.33 | 11.3 | 2.1 | 0.69 |
| HCLP | Hi-Crush Partners LP | 0.49 | 2.90 | -2.41 | -5.1 | -0.2 | 0.35 |
| CA:URZ | Uranerz Energy Corporation | 2.00 | 0.27 | 1.72 | 3.6 | 11.7 | 0.29 |
| IPI | Intrepid Potash, Inc. | 0.36 | 3.38 | -3.02 | -6.4 | -0.5 | 0.22 |
| OROE | Oro East Mining, Inc. | 0.00 | 0.52 | -0.52 | -1.1 | -39.9 | 0.05 |
| CANK | Cannabis Kinetics Corp. | 0.00 | 0.10 | -0.10 | -0.2 | -2.7 | 0.05 |
| UEC | Uranium Energy Corp. | 0.00 | 0.33 | -0.33 | -0.7 | -0.4 | 0.02 |
| FCGD | First Colombia Gold Corp. | 0.00 | 0.09 | -0.09 | -0.2 | -19.0 | 0.02 |
| MDMN | Medinah Minerals, Inc. | 0.00 | 0.16 | -0.16 | -0.3 | -4.8 | 0.01 |
| QTMM | Quantum Materials Corp. | 0.00 | 0.13 | -0.13 | -0.3 | -6.3 | 0.00 |
| ENZR | Energizer Resources Inc. | 0.00 | 0.12 | -0.12 | -0.3 | -11.7 | 0.00 |
| AMNL | Applied Minerals, Inc. | 0.00 | 0.20 | -0.20 | -0.4 | -18.5 | 0.00 |
| LBSR | Liberty Star Uranium and Metals Corp. | 0.00 | 0.03 | -0.03 | -0.1 | -4.9 | 0.00 |
| … | Other Positions | 0.61 | 0.21 | ||||
| Total | 100.00 | ||||||
Hedge Funds’ Best Sector: Real Estate Development
Historical Hedge Fund Performance: Real Estate Development
Hedge funds’ best security selection performance has been in the Real Estate Development Sector. The figure below plots the historical return of HF Real Estate Development Aggregate. Factor return and αReturn are defined as above:
Since 2004, the HF Sector Aggregate outperformed the portfolio with equivalent market risk by approximately 200%. In a flat market, HF Sector Aggregate would have gained approximately 180%:
In this sector, hedge funds gained $1 billion at the expense of other market participants. The Real Estate Development Sector appears less efficient but tractable, providing hedge funds with consistent stock picking gains.
Current Hedge Fund Real Estate Development Bets
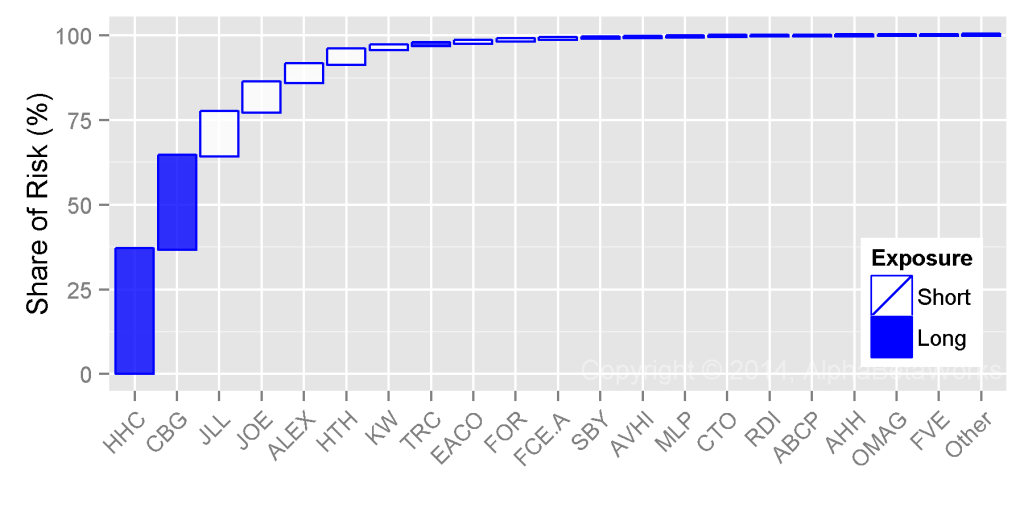
The following stocks contributed most to the relative residual (security-specific) risk of the HF Real Estate Development Sector Aggregate as of Q3 2014:
The following table contains detailed data on these crowded bets. Since in this sector hedge funds are “smart money,” large long (overweight) bets are most likely to outperform and large short (underweight) bets at most likely to do poorly:
| Exposure (%) | Net Exposure | Share of Risk (%) | |||||
| HF Sector Aggr. | Sector Aggr. | % | $mil | Days of Trading | |||
| HHC | Howard Hughes Corporation | 28.47 | 15.98 | 12.49 | 326.5 | 17.5 | 36.73 |
| CBG | CBRE Group, Inc. Class A | 52.28 | 26.54 | 25.74 | 672.7 | 10.8 | 27.58 |
| JLL | Jones Lang LaSalle Incorporated | 0.14 | 15.21 | -15.07 | -393.9 | -8.5 | 12.86 |
| JOE | St. Joe Company | 0.04 | 4.94 | -4.91 | -128.2 | -13.5 | 8.82 |
| ALEX | Alexander & Baldwin, Inc. | 0.00 | 4.71 | -4.71 | -123.2 | -13.5 | 5.38 |
| HTH | Hilltop Holdings Inc. | 1.35 | 4.86 | -3.51 | -91.8 | -18.3 | 4.29 |
| KW | Kennedy-Wilson Holdings, Inc. | 3.60 | 6.11 | -2.51 | -65.6 | -7.6 | 1.19 |
| TRC | Tejon Ranch Co. | 3.36 | 1.55 | 1.81 | 47.2 | 37.9 | 0.77 |
| EACO | EACO Corporation | 0.00 | 0.22 | -0.22 | -5.7 | -436.1 | 0.65 |
| FOR | Forestar Group Inc. | 0.62 | 1.66 | -1.05 | -27.3 | -5.3 | 0.42 |
| FCE.A | Forest City Enterprises, Inc. Class A | 8.78 | 10.56 | -1.78 | -46.5 | -1.9 | 0.35 |
| SBY | Silver Bay Realty Trust Corp. | 0.07 | 1.68 | -1.61 | -42.0 | -8.4 | 0.23 |
| AVHI | A V Homes Inc | 0.26 | 0.87 | -0.61 | -15.8 | -28.7 | 0.20 |
| MLP | Maui Land & Pineapple Company, Inc. | 0.00 | 0.29 | -0.29 | -7.5 | -132.0 | 0.10 |
| CTO | Consolidated-Tomoka Land Co. | 0.16 | 0.77 | -0.61 | -15.9 | -24.5 | 0.09 |
| RDI | Reading International, Inc. Class A | 0.02 | 0.54 | -0.52 | -13.7 | -14.2 | 0.08 |
| ABCP | AmBase Corporation | 0.00 | 0.15 | -0.15 | -3.8 | -130.1 | 0.06 |
| AHH | Armada Hoffler Properties, Inc. | 0.00 | 0.59 | -0.59 | -15.5 | -9.4 | 0.06 |
| OMAG | Omagine, Inc. | 0.00 | 0.07 | -0.07 | -1.9 | -24.7 | 0.05 |
| FVE | Five Star Quality Care, Inc. | 0.26 | 0.49 | -0.23 | -6.1 | -5.1 | 0.04 |
| … | Other Positions | 0.01 | 0.07 | ||||
| Total | 100.00 | ||||||
Real Estate Development is not the only sector where hedge funds excel. Crowded Coal, Hotels, and Forest Product sector ideas have also done well. Skills vary within each sector: The most skilled funds persistently generate returns in excess of the crowd, while the least skilled funds persistently fall short. Performance analytics built on robust risk models help investors and allocators reliably identify each.
Conclusions
- With proper data, attention to hedge fund crowding prevents “unexpected” volatility and losses.
- Market efficiency and tractability vary across sectors – crowded hedge fund bets do poorly in most sectors, but do well in some.
- Investors should avoid crowded ideas in sectors of persistent hedge fund underperformance, such as Miscellaneous Metals and Mining.
- Investors can embrace crowded ideas in sectors of persistent hedge fund outperformance, such as Real Estate Development.
- Funds with significant and persistent stock picking skills exist in most sectors, even those with generally poor hedge fund performance. AlphaBetaWorks’ Skill Analytics identify best overall and sector-specific stock pickers.


