Tag Archives: mutual fund

Are Momentum ETFs Delivering Momentum Returns?

There is a large difference between momentum strategies in theory and in practice. Given that much of its model performance derives from illiquid securities and high turnover, the academic momentum factor is a theoretical ideal that is not directly investable. Consequently, real-world momentum products, such as momentum ETFs, are restricted to investable liquid securities and usually reduce the approximately 200% annual turnover of theoretical momentum portfolios. After these modifications, their idiosyncratic momentum returns mostly vanish.

We consider a popular momentum ETF and illustrate that its historical performance is almost entirely attributable to passive exposures to simple non-momentum factors, such as Market and Sectors. Investors may thus be able to achieve and even surpass the performance of popular momentum ETFs with transparent, passive, and potentially lower-cost portfolios of simpler funds.

Attributing the Performance of Momentum ETFs to Simpler Factors

We analyzed iShares MSCI USA Momentum Factor ETF (MTUM) using the AlphaBetaWorks Statistical Equity Risk Model – a proven tool for forecasting portfolio risk and performance. We estimated monthly positions from regulatory filings, retrieved positions’ factor (systematic) exposures, and aggregated these. This produced a series of monthly portfolio exposures to simple investable risk factors such as Market, Sector, and Size. The factor exposures at the end of Month 1 and factor returns during Month 2 are used to calculate factor returns during Month 2 and any residual (security-selection, idiosyncratic, stock-specific) returns un-attributable to factors.

There are only two ways for a fund to deviate from a passive portfolio: residual returns un-attributable to factors and factor timing returns due to variation in factor exposures over time. We define and measure both components below.

iShares MSCI USA Momentum Factor (MTUM): Performance Attribution

We used iShares MSCI USA Momentum Factor (MTUM) as an example of a practical implementation of a theoretical momentum portfolio. MTUM is a $1.1bil ETF that seeks to track an index of U.S. large- and mid-cap stocks with high momentum. The fund’s turnover, around 100% annually, is about half that of the theoretical momentum factor.

iShares MSCI USA Momentum Factor (MTUM): Factor Exposures

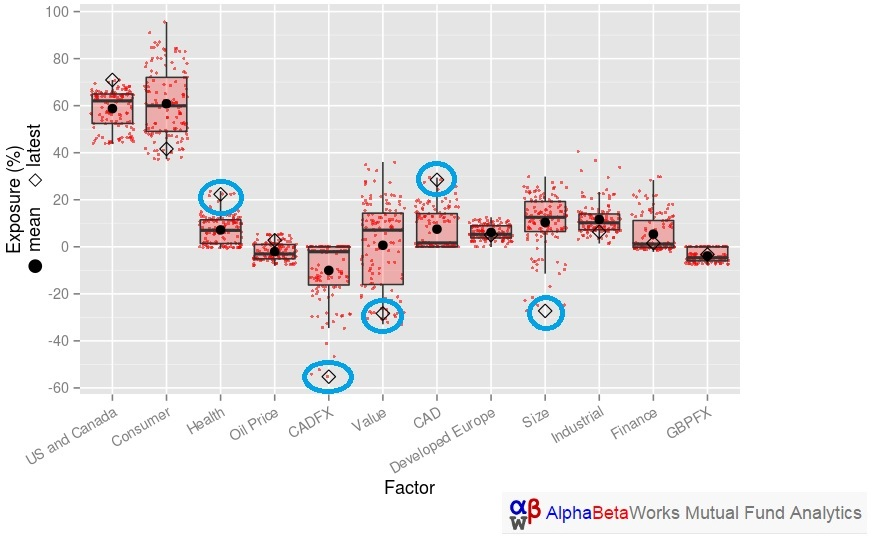
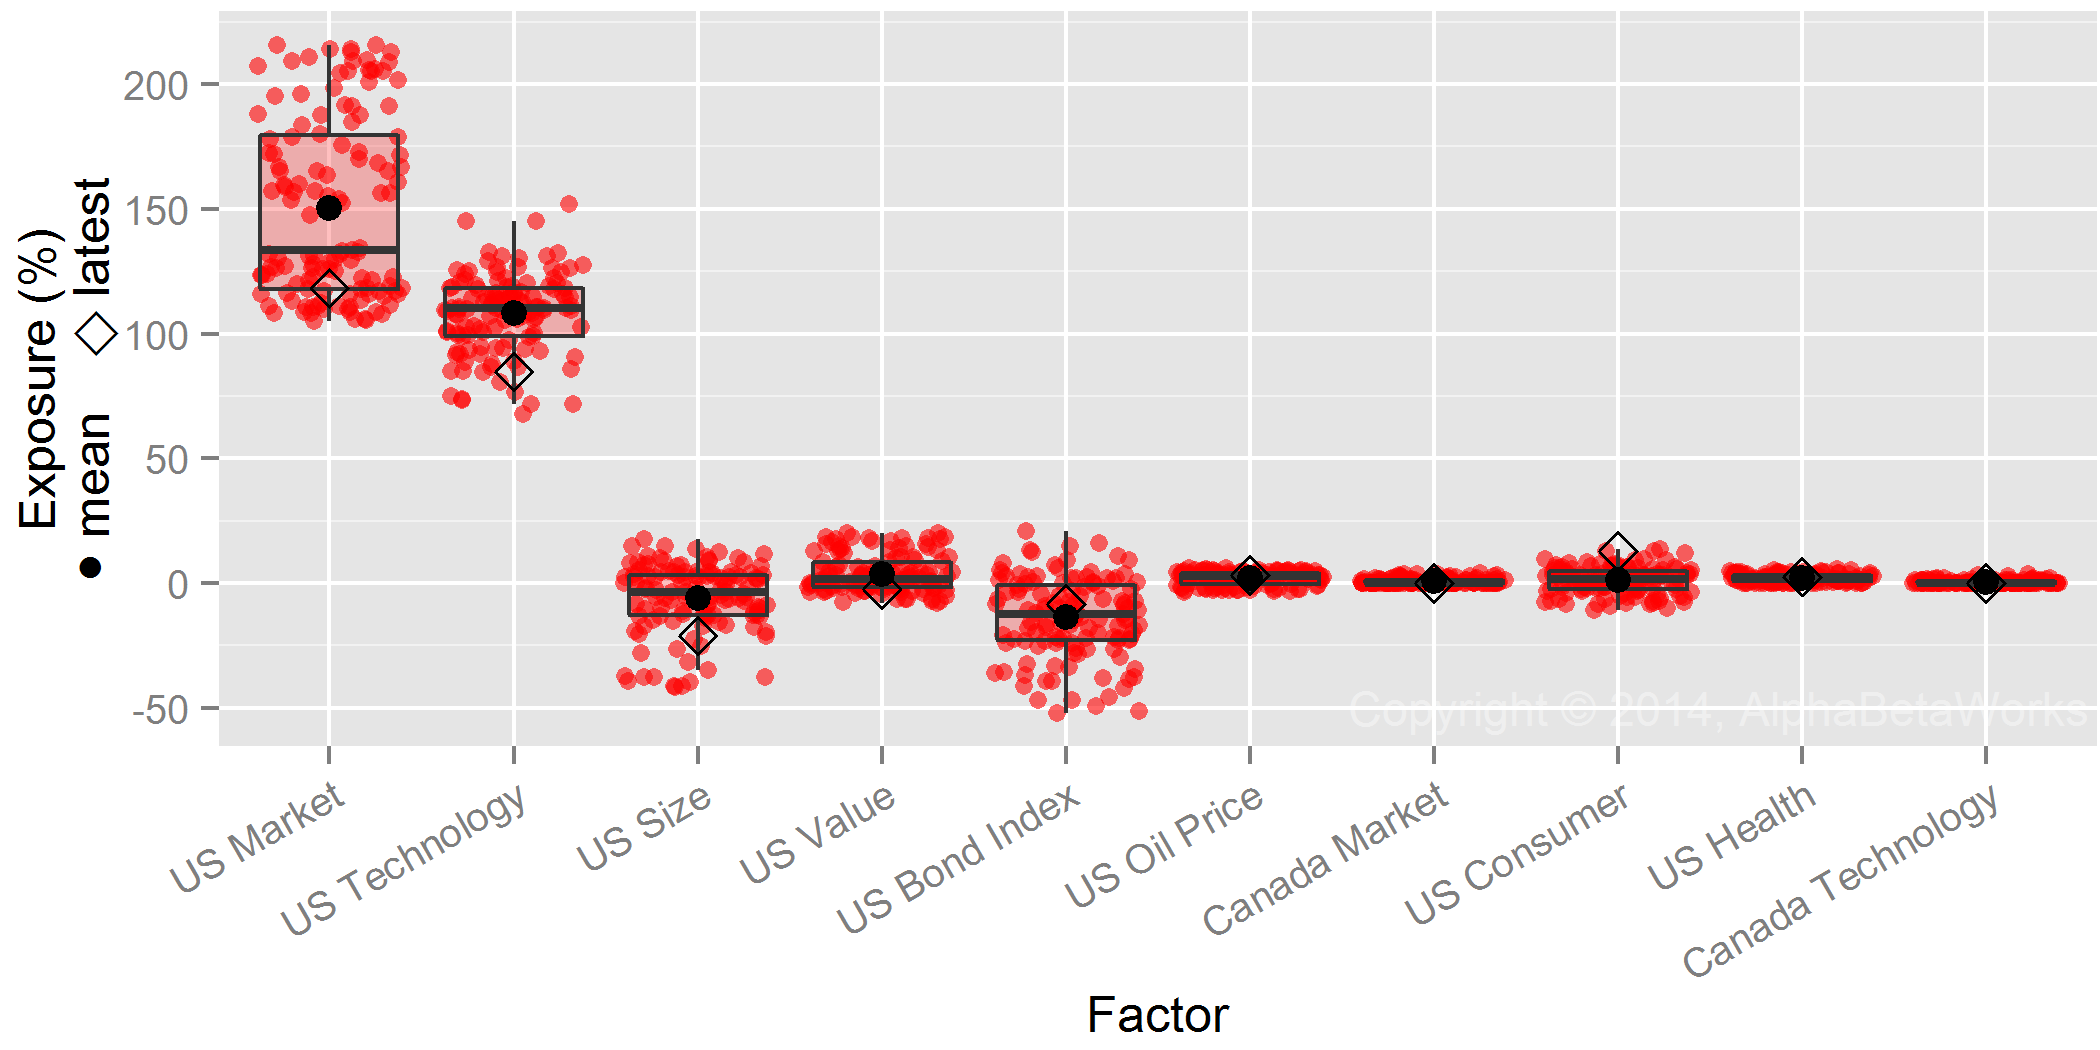
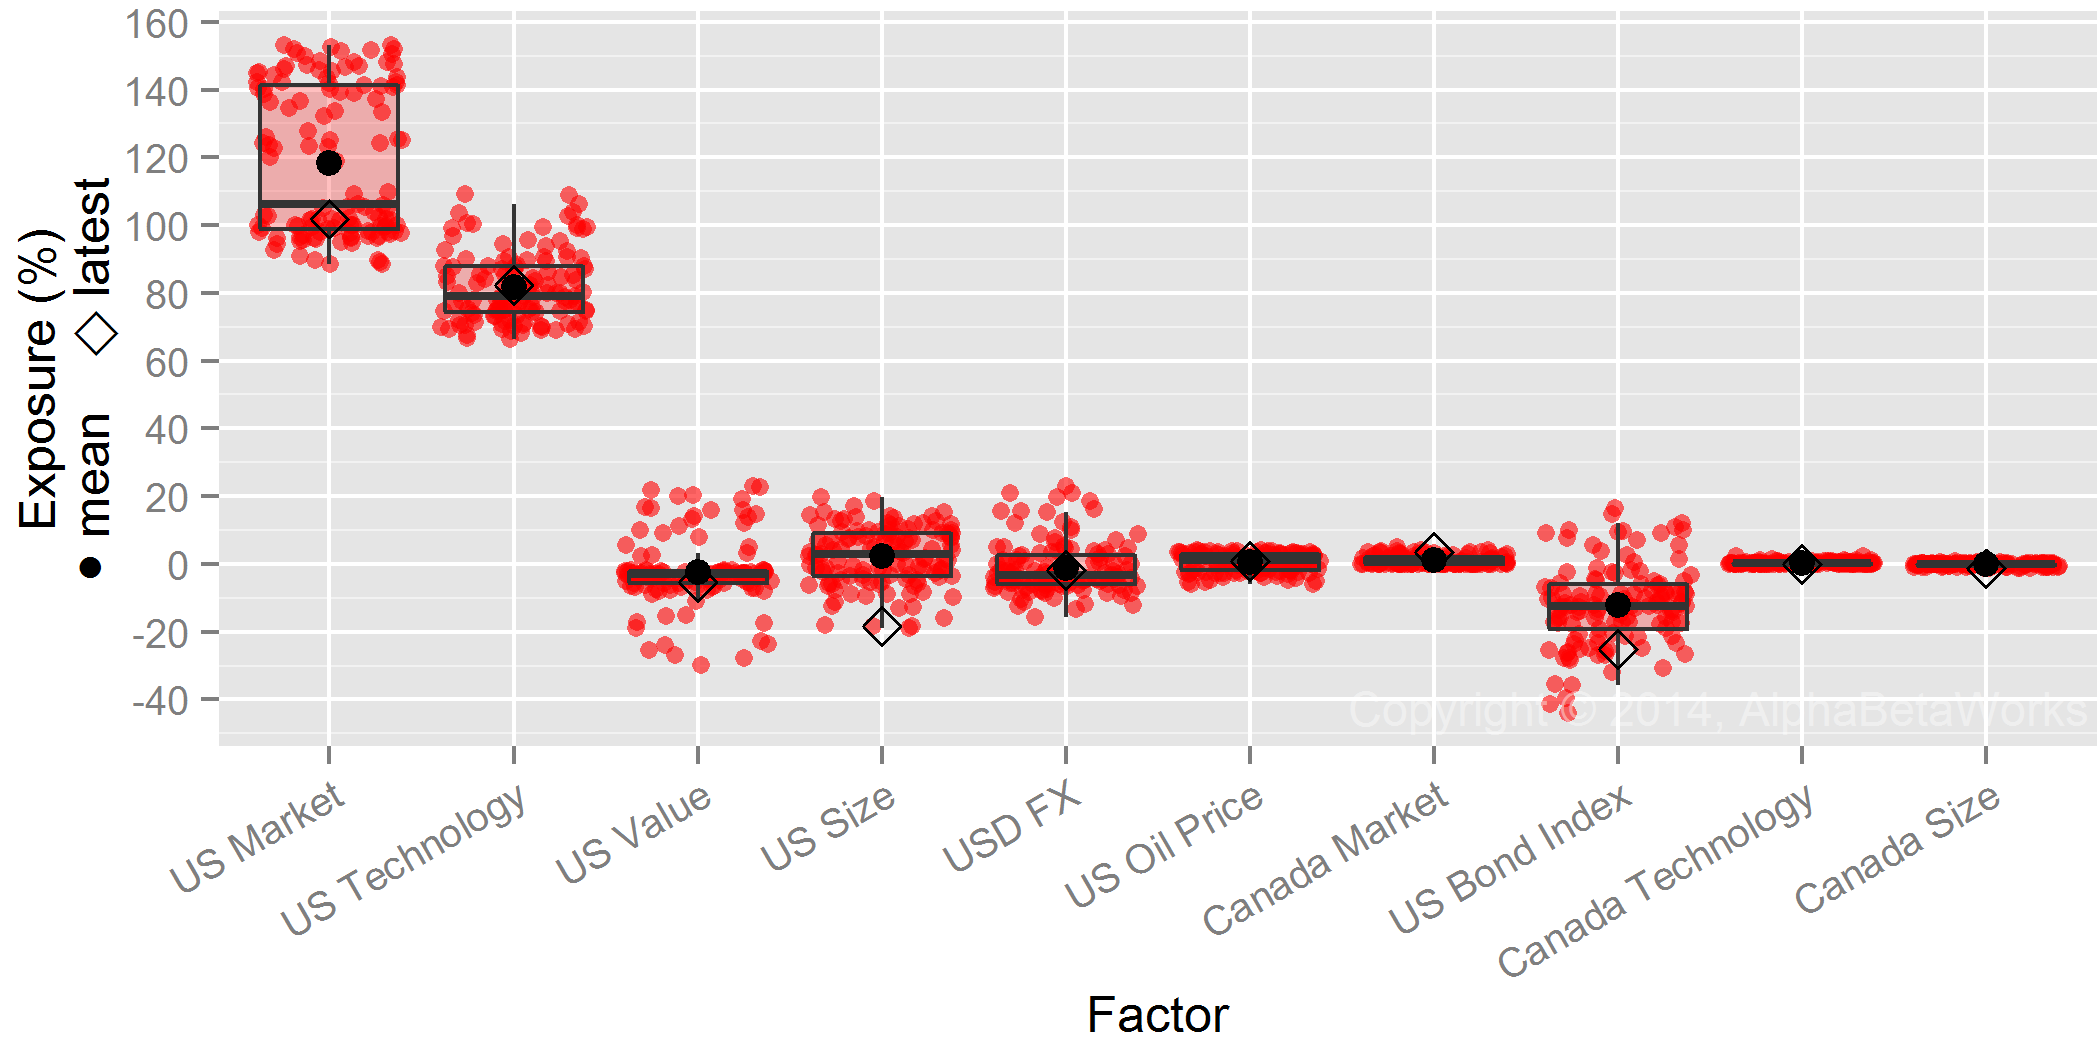
The following factors are responsible for most of the historical returns and variance of MTUM:

Chart of exposures to the risk factors contributing most to the historical performance of MSCI USA Momentum Factor (MTUM)

MSCI USA Momentum Factor (MTUM): Significant Historical Factor Exposures

Latest Mean Min. Max.
Market 88.44 84.12 65.46 96.03
Health 23.73 30.28 23.73 34.94
Consumer 74.02 32.53 13.10 74.06
Industrial 1.69 9.71 1.13 24.51
Size -10.47 -1.04 -11.09 7.67
Oil Price -2.90 -2.45 -4.94 -0.04
Technology 17.72 16.56 1.50 32.29
Value -4.86 -2.13 -8.00 5.20
Energy 0.00 1.86 0.00 4.12
Bond Index 6.51 1.08 -22.90 23.64

iShares MSCI USA Momentum Factor (MTUM): Active Return

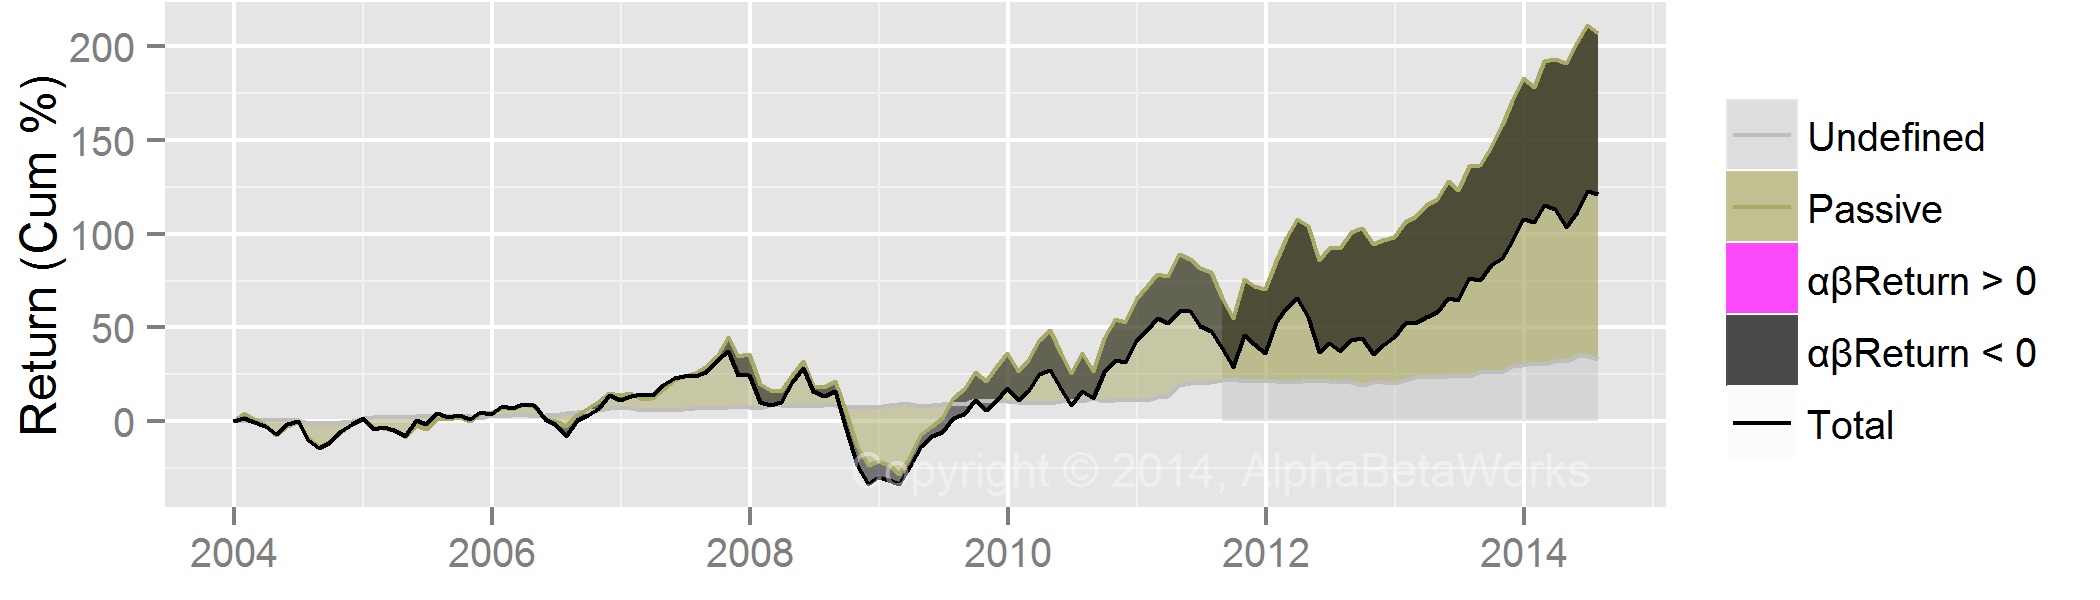
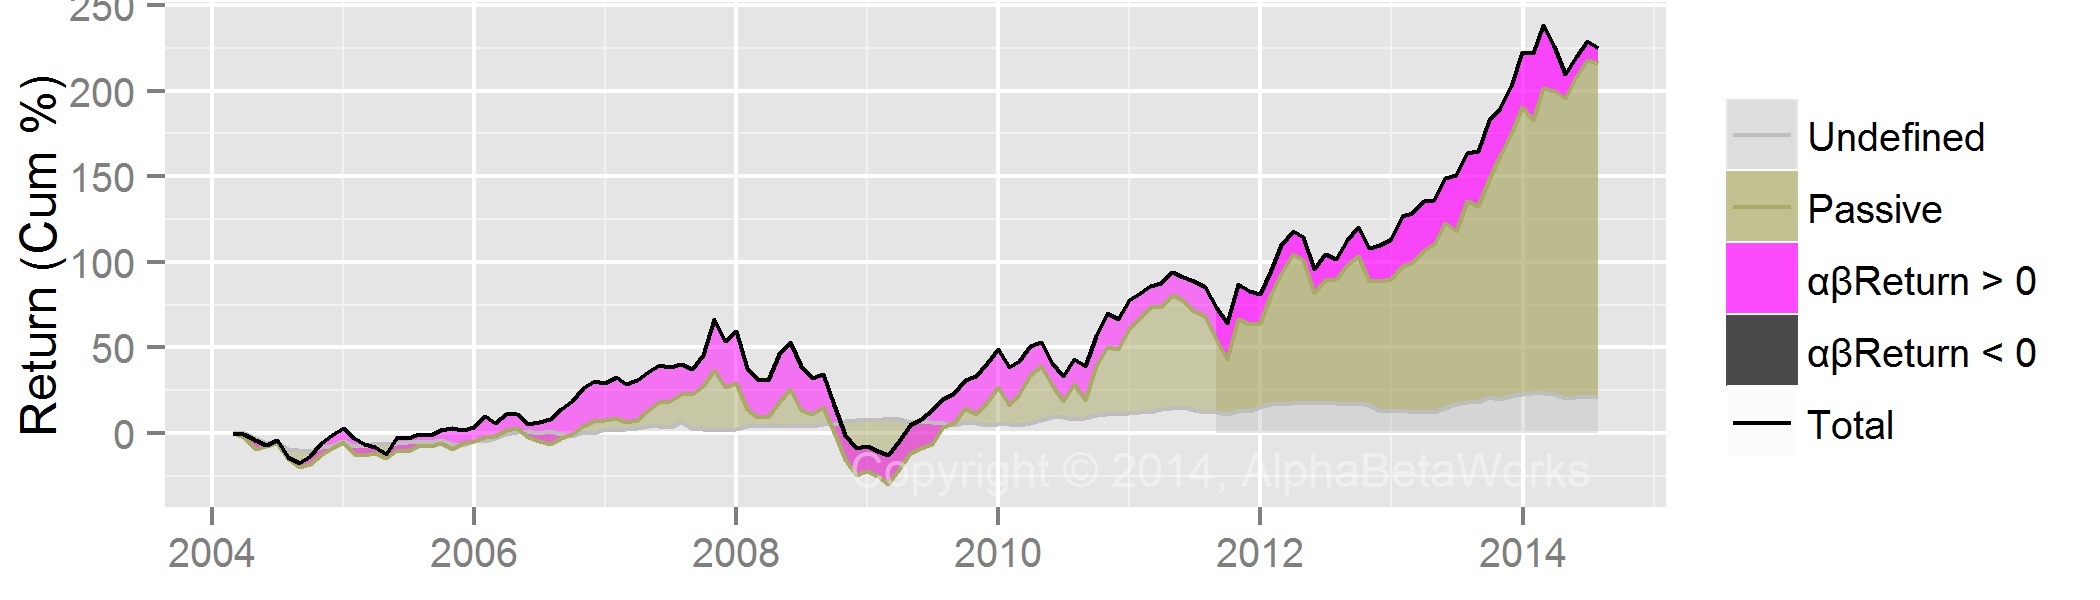
To replicate MTUM with simple non-momentum factors, one can use a passive portfolio of these simple non-momentum factors with MTUM’s mean exposures as weights. This portfolio defined the Passive Return in the following chart. Active return, or αβReturn, is the performance in excess of this passive replicating portfolio. It is the active return due to residual stock performance and factor timing:

Chart of the cumulative historical active return from security selection and factor timing of MSCI USA Momentum Factor (MTUM)

MSCI USA Momentum Factor (MTUM): Cumulative Passive and Active Returns

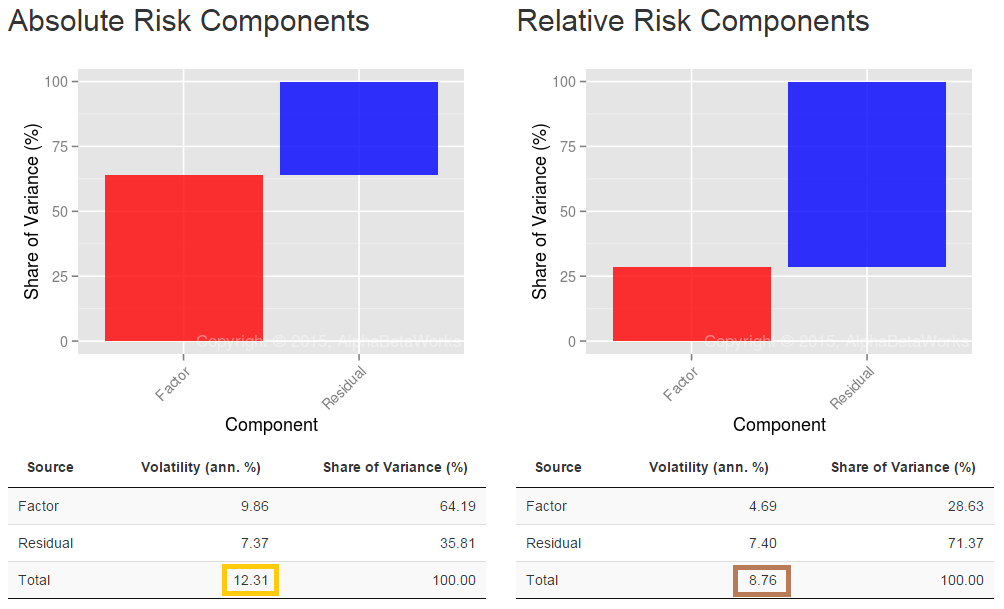
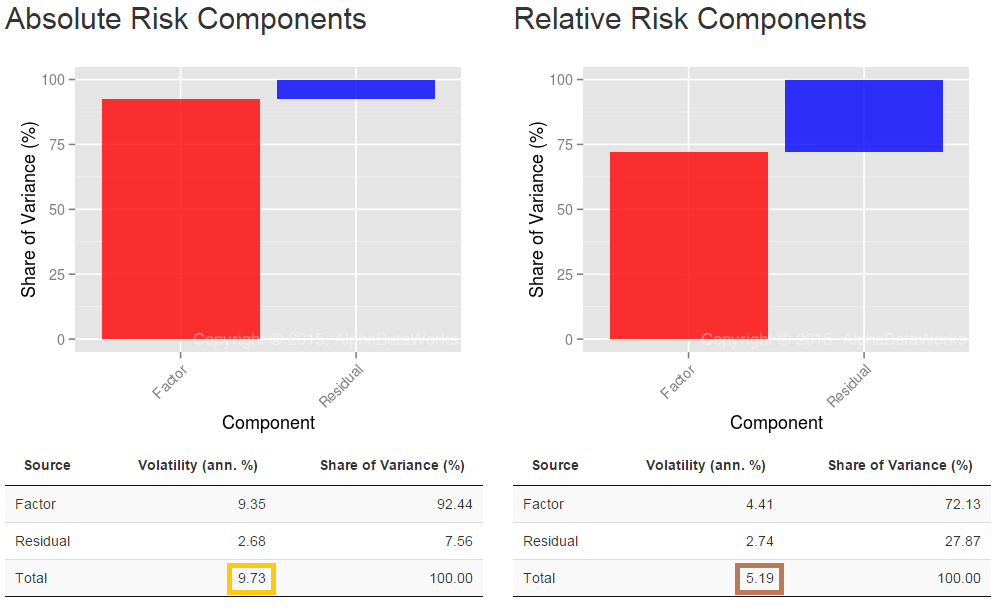
MTUM’s performance closely tracks the passive replicating portfolio. Pearson’s correlation between Total Return and Passive Return is 0.96. Consequently, 93% of the variance of monthly returns is attributable to passive factor exposures, primarily to Market and Sector factors.

Once passive exposures to simpler factors have been removed, MTUM’s active return is negligible. Since MTUM’s launch, the cumulative return difference from such passive replicating portfolio has been approximately 1%:

2013 2014 2015 Total
Total Return 16.73 14.62 8.50 45.18
  Passive Return 16.06 16.48 4.55 41.34
  αβReturn 1.11 -2.46 2.54 1.12
    αReturn 3.91 0.05 0.29 4.27
    βReturn -2.71 -2.52 2.23 -3.05

This active return can be further decomposed into security selection (αReturn) and factor timing (βReturn). These active return components generated low volatility, around 1% annually, mostly offsetting each other as illustrated below:

iShares MSCI USA Momentum Factor (MTUM): Active Return from Security Selection

AlphaBetaWorks’ measure of residual security selection performance is αReturn – performance relative to a factor portfolio that matches the funds’ historical factor exposures. αReturn is the return a fund would have generated if markets had been flat. MTUM has generated approximately 4% cumulative αReturn, primarily in 2013, compared to roughly 1.5% decline for the average U.S. equity ETF:

Chart of the cumulative historical active return from security selection of MSCI USA Momentum Factor (MTUM)

MSCI USA Momentum Factor (MTUM): Cumulative Active Return from Security Selection

iShares MSCI USA Momentum Factor (MTUM): Active Return from Factor Timing

AlphaBetaWorks’ measure of factor timing performance is βReturn – performance due to variation in factor exposures. βReturn is the fund’s outperformance relative to a portfolio with the same mean, but constant, factor exposures as the fund. MTUM generates approximately -3% cumulative βReturn, compared to a roughly 1% decline for the average U.S. equity ETF:

Chart of the cumulative historical active return from factor timing of MSCI USA Momentum Factor (MTUM)

MSCI USA Momentum Factor (MTUM): Cumulative Active Return from Factor Timing

These low active returns are consistent with our earlier findings that many “smart beta” funds are merely high-beta and offer no value over portfolios of conventional dumb-beta funds. It is thus vital to test any new resident of the Factor Zoo to determine whether they are merely exotic breeds of its more boring residents.

Conclusion

  • Theoretical, or academic, momentum portfolios are not directly investable.
  • A popular momentum ETF, MSCI USA Momentum Factor (MTUM), did not deviate significantly from a passive portfolio of simpler non-momentum factors.
  • Investors may be able to achieve and surpass the performance of the popular momentum ETFs with transparent, passive, and potentially lower-cost portfolios of simpler index funds and ETFs.
The information herein is not represented or warranted to be accurate, correct, complete or timely.
Past performance is no guarantee of future results.
Copyright © 2012-2016, AlphaBetaWorks, a division of Alpha Beta Analytics, LLC. All rights reserved.
Content may not be republished without express written consent.

The Risk Impact of Valeant on Sequoia Fund

“This is your fund on drugs”

The Sequoia Fund’s (SEQUX) hefty sizing of Valeant Pharmaceuticals (VRX) dramatically changed the fund’s risk profile from historical norms. With the proper tools, allocators would have noticed this style drift back in Q2 2015 when Sequoia’s key factor exposures moved two to three times beyond historical averages. What’s more, allocators would have noticed a predicted volatility increase of 25% and a tracking-error increased 70%. Though this analysis would not have anticipated Valeant’s subsequent decline, it would have warned fund investors that Sequoia’s risk was out of the ordinary. 

Sequoia Fund’s Risk Profile

Below is a chart of Sequoia’s major factor exposures, spanning a ten year history through June 2015:

Chart of the exposures of Sequoia Fund (SEQUX) to the risk factors contributing most to its risk

Sequoia Fund (SEQUX) – Historical Factor Exposures

(Note that this analysis and our model do not include Valeant’s recent heightened volatility: we are using the AlphaBetaWorks Statistical Equity Risk Model as of 8/31/15 and SEQUX’s positions as of 6/30/2015. In short, we are looking at the world prior to Valeant’s subsequent downside volatility.)

Sequoia’s stock selection and allocation decisions result in certain factor bets such as market beta (“US and Canada”, above), other factors (Value, Size), and sectors (Consumer, Health). The red dots above represent factor exposures in a particular month, the red boxes represent two quartile deviations, and the diamonds denote current (i.e. 6/30/15) exposures. Several sectors/factors are circled for emphasis: they are current exposures as well as outliers versus history. More importantly, these outlying factor bets are the direct result of Sequoia’s large percentage ownership of Valeant.

The Impact of Valeant on Sequoia Fund’s Factor Exposures

We examined Sequoia Fund’s factor exposures with and without Valeant. We assumed that the pro forma Sequoia Fund without Valeant would have increased all other positions proportionally to make up for the void.  For example, we increase Sequoia’s next-largest position (TJX) from 7.3% to 10.9%, and so on for all longs for the pro forma non-Valeant Sequoia portfolio.

Below is a chart comparing the most salient factor exposures of Sequoia Fund, with and without Valeant:

Chart of the exposures of Sequoia Fund (SEQUX) to the risk factors contributing most to its risk including and excluding the position in Valeant (VRX)

Sequoia Fund (SEQUX) – Factor Exposures With and Without Valeant (VRX)

Valeant has had a significant impact on Sequoia’s factor exposures. The factors with the highest delta are the same as those highlighted as outliers on the first chart above.

This is significant in several ways. First, the large Valeant holding increases Sequoia Fund’s overall volatility by 25%. Second, Sequoia’s tracking error is increased by its Valeant holding by 70%. Sequoia Fund volatility estimates with and without Valeant are below:

The main components of Sequoia Fund’s (SEQUX’s) absolute and relative volatility and variance including the position in Valeant (VRX)

Sequoia Fund (SEQUX) with Valeant (VRX) – Absolute and Relative (to S&P 500) Estimated Risk

The main components of Sequoia Fund’s (SEQUX’s) absolute and relative volatility and variance excluding the position in Valeant (VRX)

Sequoia Fund (SEQUX) without Valeant (VRX) – Absolute and Relative (to S&P 500) Estimated Risk

Valeant increases Sequoia’s overall predicted volatility (tracking error) by 26% (from 9.73% to 12.31%, annualized – gold boxes). Likewise, Valeant increases Sequoia’s tracking error by 69% (from 5.19% to 8.76% – brown boxes). Increases in both Absolute and Relative volatility are due to the incremental Residual Risk contribution of Sequoia’s large Valeant holding (graphically shown by the larger blue boxes in the “with VRX” charts, in contrast to smaller blue boxes in the “without VRX” charts).

Conclusions

In the end, this analysis is not about Sequoia or VRX. It is a single example of decisions that could have been avoided by a portfolio manager or questions that would have arisen to an allocator with the proper risk toolkit. Sequoia’s decision to make Valeant an outsized position did not go unnoticed from a risk standpoint. Increases in factor exposures of two to three times outside historical bounds were an early warning. The impact of this was increased predicted volatility – both on an absolute basis and relative to the S&P 500. A framework that warns of a fund taking large factor and idiosyncratic bets aids greatly in avoiding negative surprises.

The information herein is not represented or warranted to be accurate, correct, complete or timely.
Past performance is no guarantee of future results.
Copyright © 2012-2015, AlphaBetaWorks, a division of Alpha Beta Analytics, LLC. All rights reserved.
Content may not be republished without express written consent.

Upgrading Fund Active Returns

And Not Missing Out

Maybe your fund took extra risk to keep up with its benchmark. Maybe your fund should have made more – much more – given the risks it took. By the time market volatility reveals underlying exposures, it may be too late to avoid severe losses. There is a better way: Investors can continuously monitor a fund’s risk, the returns it should be generating, and the value it creates. This value should matter most to investors and allocators. Regrettably, most fund analysis tools and services pay no attention to it.

To illustrate, we analyze two funds: one that did much worse than it should have, and one that did better.

PRSCX – Negative Active Returns

The T. Rowe Price Science & Technology Fund (PRSCX) manages approximately $3 billion. This fund generally tracks its benchmark and it gets 3 star rating from a popular service. Notwithstanding this, PRSCX has produced persistently negative active returns. Given its historical risk, PRSCX should have made investors far more money: Over the past ten years, an investor would have made 50-80% more owning a passive portfolio with PRSCX’s risk profile.

Chart of the historical cumulative passive and active returns of T. Rowe Price Science & Technology Fund (PRSCX)

T. Rowe Price Science & Technology Fund (PRSCX) – Passive and Active Return History

While we seem to bolster arguments for passive investing, reality is more complex: Active returns (both positive and negative) persist over time. Thus, upgrading from PRSCX to a fund with persistently positive active returns is a superior move. We will provide one candidate.

PRSCX – Historical Risk

The chart below shows PRSCX’s historical risk (exposures to significant risk factors). The red dots indicate monthly exposures (as a percentage of assets) over the past 10 years; the black diamonds indicate latest exposures:

Chart of the historical exposures of T. Rowe Price Science & Technology Fund (PRSCX) to significant risk factors

T. Rowe Price Science & Technology Fund (PRSCX) – Exposure to Significant Risk Factors

PRSCX varied its exposures over time. U.S. Market is the most important exposure, reaching 200% (market beta of 2) at times. As expected for a technology fund, its U.S. Technology exposure has been near 100%. Also note PRSCX’s occasional short bond exposure. Many equity funds carry large hidden bond bets due to the risk profile of their equity holdings. Most investors and portfolio managers are not aware of these bets. Yet for these funds, bond risk is a key driver of portfolio returns and volatility.

PRSCX – Historical Active Returns

The above exposures define a passive replicating portfolio matching PRSCX’s risk. The fund manager’s job is to outperform this passive alternative by generating active returns.

To isolate active returns, we quantify passive factor exposures, estimate the passive return, and then calculate the remaining active return – αβReturn. We further break down αβReturn into risk-adjusted return from security selection, or stock picking (αReturn), and market timing (βReturn):

Component 2004 2005 2006 2007 2008 2009 2010 2011 2012 2013 2014
Total 1.6 2.46 7.1 11.88 -43.8 67.83 21.25 -4.51 6.25 43.7 9.39
Passive -0.69 1.4 5.45 19.26 -46.13 77.52 23.21 -3.42 20.36 51.54 13.61
αβReturn 0.98 -0.69 -2.2 -7.45 2.71 -11.61 -2.22 -8.24 -13.76 -14.14 -5.84
αReturn -1.95 -3.29 -6.45 -2.79 7.92 0.78 4.17 -12.31 -11.47 -4.54 1.11
βReturn 2.94 2.6 4.25 -4.66 -5.2 -12.39 -6.39 4.07 -2.29 -9.6 -6.95
Undefined 1.3 1.75 3.85 0.07 -0.38 1.92 0.26 7.15 -0.35 6.3 1.61

Note that we are unable to account for trades behind some of the returns – the “Undefined” component. It may be due to private securities or intra-period trading; it may be passive or active. Yet, even if we assume that all undefined returns above are active, PRSCX still delivered persistently negative αβReturn over the past ten years. Furthermore, the compounding of negative αβReturn leaves investors missing out on 50-80% in gains.

FSCSX – An Upgrade Option with Similar Historical Risk

While a passive portfolio would have been superior to PRSCX, it is not the best upgrade. Allocators and investors can do better owning a fund with consistently positive αβReturns, since αβReturns persist. One candidate is Fidelity Select Software & Computer Services Portfolio (FSCSX):

Chart of the historical exposures of Fidelity Select Software & Computer Services Portfolio (FSCSX) to significant risk factors

Fidelity Select Software & Computer Services Portfolio (FSCSX) – Exposure to Significant Risk Factors

Currently, FSCSX and PRCSX have similar exposures. AlphaBetaWorks’ risk analytics estimate the current annualized tracking error between the two funds at a 5.29% (about the same volatility as bonds, and less than one half of market volatility).

FSCSX – Historical Active Returns

FSCSX’s 3-year trailing average annual return of 23% is slightly ahead of PRSCX’s 20%. But most importantly, given its lower historical risk, FSCSX has delivered positive αβReturns versus PRSCX’s significantly negative ones. The chart below shows FSCSX’s ten-year performance. The purple area is the positive αβReturn. The gray area is FSCSX’s passive return:

Chart of the historical cumulative passive and active returns of Fidelity Select Software & Computer Services Portfolio (FSCSX)

Fidelity Select Software & Computer Services Portfolio (FSCSX) – Passive and Active Return History

FSCSX is superior to a passive portfolio with similar risk and to PRSCX. Mind you, this is not a sales pitch for FSCSX but merely a consequence of its positive αβReturn and αβReturn persistence.

Few fund investors and allocators possess the tools to quantify active returns. Yet, this knowledge is an essential competitive advantage, leading to improved client returns, client retention, and asset growth. Unfortunately, many are content to pick funds based on past nominal returns and to suffer the consequences: picking yesterday’s winners tends to pick tomorrow’s losers. AlphaBetaWorks spares clients from the data processing headaches, financial modeling, and statistical analysis of thousands of portfolios, delivering predictive risk and skill analytics on thousands of funds.

Conclusions

  • Analyzing a fund’s performance relative to a benchmark ignores the most important question: What should you have made given its risk?
  • Some mutual funds produce persistently negative active returns; others produce persistently positive active returns.
  • Upgrading from a fund with persistently negative active return (αβReturn) to a replicating passive portfolio tends to improve performance.
  • Upgrading from a passive portfolio to a fund with persistently positive αβReturn also tends to improve performance.
  • Tools that accurately estimate fund risk and active returns provide enduring competitive advantages for investors and professional allocators, leading to improved client returns, client retention, and asset growth.
The information herein is not represented or warranted to be accurate, correct, complete or timely.
Past performance is no guarantee of future results.
Copyright © 2012-2014, 
AlphaBetaWorks, a division of Alpha Beta Analytics, LLC. All rights reserved.
Content may not be republished without express written consent.