Our earlier articles explored hedge fund survivor (survivorship) bias and large fund survivor bias. These artifacts can nearly double nominal returns and overstate security selection (stock picking) performance by 80%. Due to these biases, future performance of the largest funds disappoints. The survivors and the largest funds have excellent past nominal performance, yet it is not predictive of their future returns due to hedge fund mean reversion, a special case of reversion toward the mean. Here we explore this phenomenon and its mitigation.
We follow the approach of our earlier pieces that analyzed hedge funds’ long U.S. equity portfolios (HF Aggregate). This dataset spans the long portfolios of all U.S. hedge funds active over the past 15 years that are tractable using 13F filings.
Mean Reversion of Nominal Hedge Fund Returns
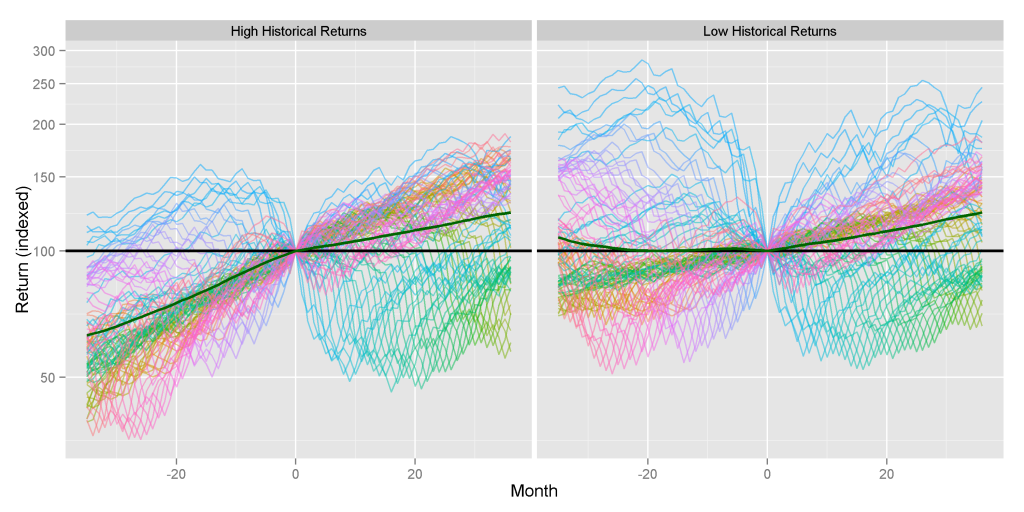
To illustrate the mean reversion of nominal hedge fund returns, we have assembled hedge fund portfolios with the highest and lowest trailing 36-month performance and track these groups over the subsequent 36 months. This covers the past 15 years and considers approximately 100 such group pairs.
If strong historical performance is predictive, we should see future (ex-post, realized) outperformance of the best historical performers relative to the worst. This would support the wisdom of chasing the largest funds or the top-performing gurus.
The following chart tracks past and future performance of each group. The average subsequent performance of the historically best- and worst-performing long U.S. equity hedge fund portfolios is practically identical and similar to the market return. There is some difference in the distributions, however: highest performers’ subsequent returns are skewed to the downside; lowest performers’ subsequent returns are skewed to the upside:
|
Prior 36 Months Return (%) |
Subsequent 36 Months Return (%) |
|
| High Historical Returns |
52.84 |
28.17 |
| Low Historical Returns |
-11.43 |
28.33 |
Thus, nominal historical returns are not predictive of future performance. We will try a few simple metrics of risk-adjusted performance next to see if they prove more effective.
Sharpe Ratio and Mean Reversion of Returns
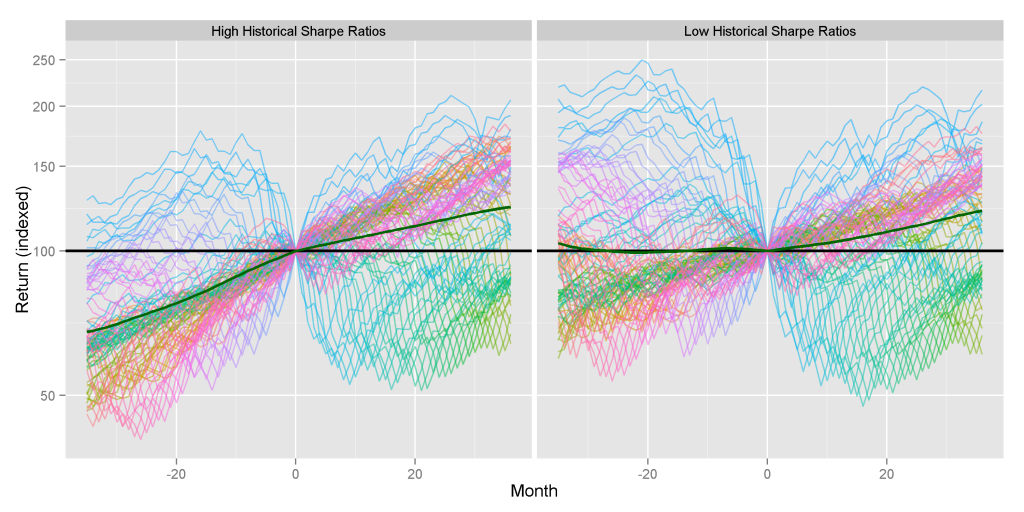
Sharpe ratio is a popular measure of risk-adjusted performance that attempts to account for risk using return volatility. The following chart tracks past and future performance of portfolios with the highest and lowest historical Sharpe ratios. The average future performance of the best- and worst-performing portfolios begins to diverge, though we have not tested this difference for statistical significance:
|
Prior 36 Months Return (%) |
Subsequent 36 Months Return (%) |
|
| High Historical Sharpe Ratios |
43.65 |
28.38 |
| Low Historical Sharpe Ratios |
-8.34 |
25.66 |
Note that portfolios with the highest historical Sharpe ratios perform similarly to the best and worst nominal performers in the first chart. However, portfolios with the lowest historical Sharpe ratios underperform by 2.5%. Sharpe ratio does not appear to predict high future performance, yet it may help guard against poor results.
Win/Loss Ratio and Mean Reversion of Returns
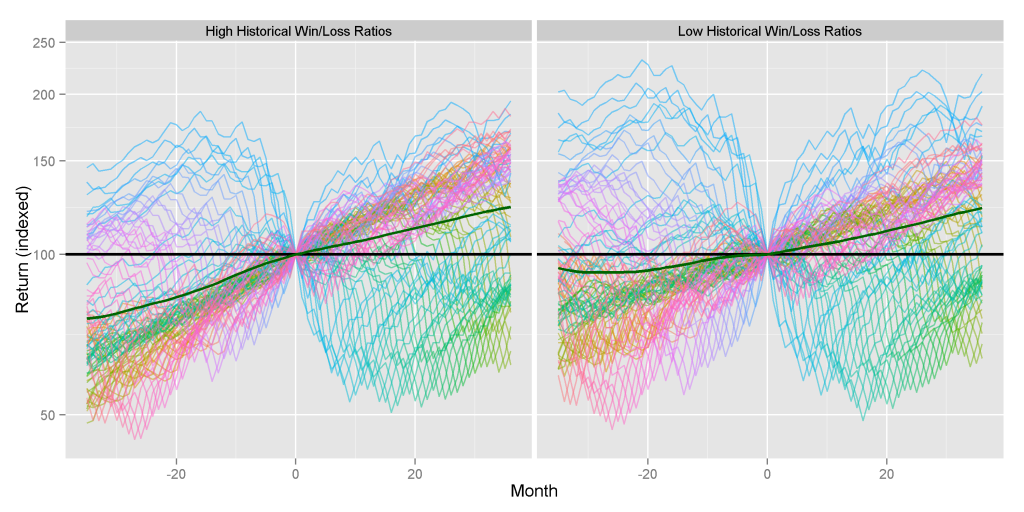
Sharpe ratio and similar parametric approaches make strong assumptions, including normality of returns. We try a potentially more robust non-parametric measure of performance free of these assumptions – the win/loss ratio, closely related to the batting average. The following chart tracks past and future performance of portfolios with the highest and lowest historical win/loss ratios. The relative future performance of the two groups is similar:
|
Prior 36 Months Return (%) |
Subsequent 36 Months Return (%) |
|
| High Historical Win/Loss Ratios |
26.93 |
27.59 |
| Low Historical Win/Loss Ratios |
1.70 |
26.53 |
Win/loss ratio does not appear to improve on the predictive ability of Sharpe ratio. In fact, both groups slightly underperform the low performers from the first chart above.
Persistence of Hedge Fund Security Selection Returns
Nominal returns and simple metrics that rely on nominal returns both suffer from mean reversion, since systematic (factor) returns responsible for the bulk of portfolio volatility are themselves mean reverting. Proper risk adjustment with a robust risk model that eliminates systematic risk factors and purifies residuals addresses this problem.
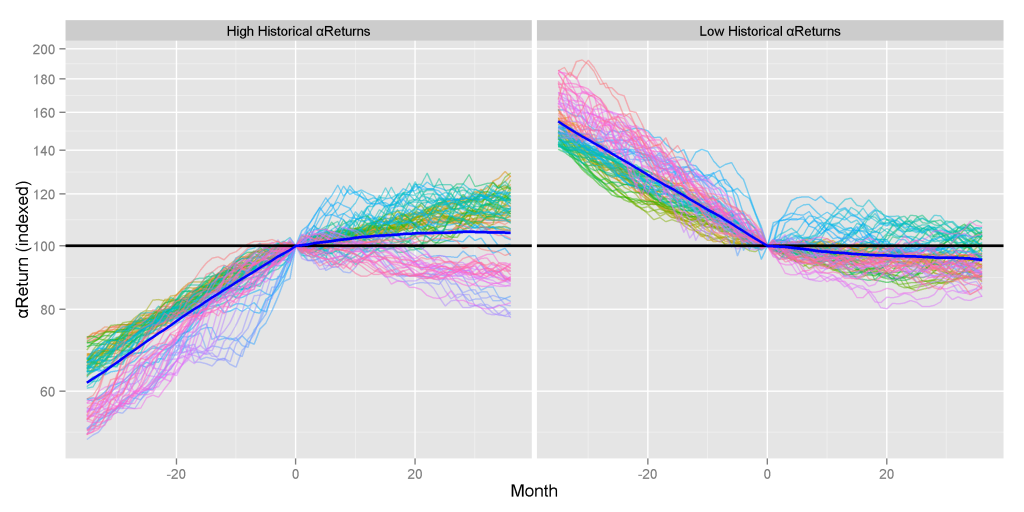
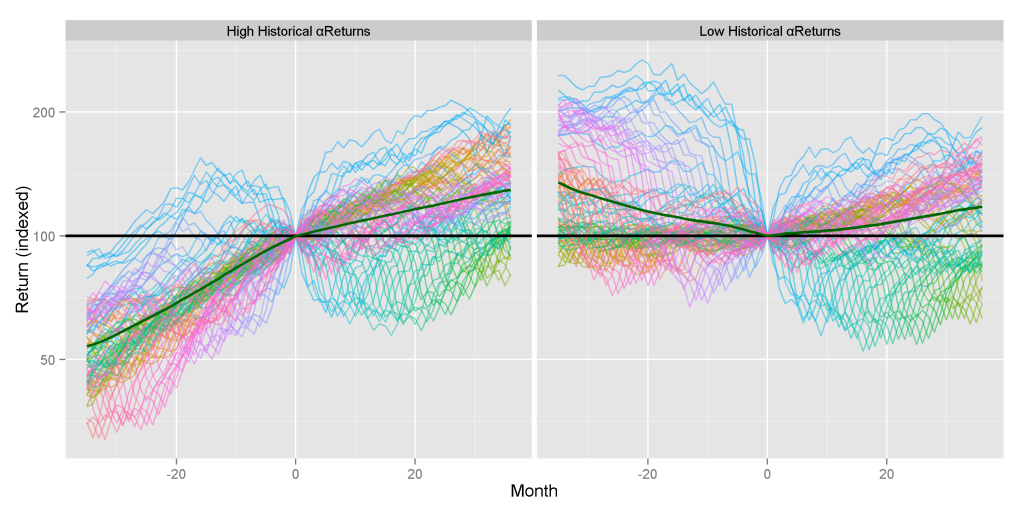
AlphaBetaWorks’ measure of this residual security selection performance is αReturn – outperformance relative to a replicating factor portfolio. αReturn is also the return a portfolio would have generated if markets had been flat. The following chart tracks past and future security selection performance of portfolios with the highest and lowest historical αReturns. The future security selection performance of the best and worst stock pickers diverges by over 10%:
|
Prior 36 Months αReturn (%) |
Subsequent 36 Months αReturn (%) |
|
| High Historical αReturns |
60.90 |
5.65 |
| Low Historical αReturns |
-35.66 |
-4.58 |
Security Selection and Persistent Nominal Outperformance
Strong security selection performance and strong αReturns can always be turned into nominal outperformance. In fact, a portfolio with positive αReturns can be hedged to outperform any broad benchmark. Nominal outperformance is convenient and easy to understand. These are the returns that investors “can eat.”
The following chart tracks past and future nominal performance of portfolios with the highest and lowest historical αReturns, hedged to match U.S. Equity Market’s risk (factor exposures). Hedging preserved security selection returns and compounded them with market performance: future performance of the two groups diverges by over 11%:
|
Prior 36 Months Return (%) |
Subsequent 36 Months Return (%) |
|
| High Historical αReturns |
81.70 |
32.50 |
| Low Historical αReturns |
-28.93 |
21.41 |
Note that, similarly to Sharpe ratio, αReturn is most effective in identifying future under-performers.
Thus, with predictive analytics and a robust model, investors can not only identify persistently strong stock pickets but also construct portfolios with predictably strong nominal performance.
Conclusions
- Due to hedge fund mean reversion, future performance of the best and worst nominal performers of the past is similar.
- Re-processing nominal returns does not eliminate mean reversion. However, Sharpe ratio begins to identify future under-performers.
- Risk-adjusted returns from security selection (stock picking) persist. A robust risk model can isolate these returns and identify strong future stock pickers.
- Hedging can turn persistent security selection returns into outperformance relative to any benchmark:
- A hedged portfolio of the best stock pickers persistently outperforms.
- A hedged portfolio of the worst stock pickers persistently underperforms.

