Category Archives: Skill

Best and Worst Hedge Fund Long Stock Pickers

Who’s Been Naughty or Nice

The five top hedge fund long stock pickers with long U.S. equity AUM over $3 billion produced 10.7% average annual alpha in the past three years (through October 2015).  The five bottom hedge fund long U.S. equity stock pickers had negative alpha averaging -6.5% during the same period. Both lists contain well-known and well-followed managers with a combined long U.S. equity AUM over $100 billion. These rankings overcome the flaws of simplistic performance measures by using a persistent and hence predictive metric of alpha.

Ranking Hedge Fund Long Stock Pickers

Fund rankings usually focus on absolute or relative nominal returns. Reliance on such simplistic measures, frequently mislabeled as “alpha,” is hazardous for allocators and consultants and typically leads to picking yesterday’s winners, who tend to become tomorrow’s losers: high-beta funds in bull markets and low-beta funds in bear markets.  To overcome these flaws, AlphaBetaWorks calculates returns independent of risks taken – αReturn – the performance a fund would have generated if markets had been flat. A true measure of security selection skill, αReturn is strongly predictive of future stock picking performance.

To the extent a fund derives significant returns from long equity holdings, our approach helps allocators and consultants avoid losses and unhappy clients. Furthermore, absent this approach, mindless followers of famous funds are headed for disappointment.

Top and Bottom Five Hedge Funds by Stock Picking Return

A comparison of nominal long hedge fund portfolio performance to market indices is misleading, since a portfolio may be taking dramatically different risks. It follows that equating outperformance relative to S&P500 with alpha is wrong. Under this simplistic approach, leveraged market ETFs generate positive alpha in up years and negative alpha in down years – a flawed result and a dangerous criterion for investment decisions.

Adjusting returns for the factor (systematic) risks taken to generate them is required to identify stock picking return and, correspondingly, stock picking skill.

Below we list the top and bottom long U.S. equity stock pickers among the hedge funds that can be analyzed using regulatory filings:

Name αβReturn αβScore αReturn αScore βReturn βScore
Harbinger Capital Partners LLC 15.45 95.04 15.38 95.4 -0.01 49.92
Icahn Associates Holdings LLC 9.09 80.19 11.11 85.92 -2.01 23
PAR Capital Management, Inc. 8.32 95.56 10.93 98.85 -2.69 12.48
Longview Asset Management LLC 14.09 97.02 9.40 87.53 4.49 98.83
ValueAct Capital Management LP 3.29 74.01 6.73 90.06 -3.52 3.9

Hedge Funds with the Highest Long U.S. Equity Stock Picking Returns and > $3B AUM, 3-yr CAGR

Name αβReturn αβScore αReturn αScore βReturn βScore
Bridgewater Associates LP -9.05 1.86 -8.15 4.28 -0.99 28.03
Omega Advisors, Inc. -8.29 0.22 -7.19 1.25 -1.14 16.06
Pershing Square Capital Management LP -5.36 25.15 -5.83 25.01 0.28 56.73
Axiom International Investors LLC -2.62 16.93 -5.83 0.71 3.17 94.05
Paulson & Co., Inc. -5.05 14.65 -5.63 10.72 0.57 61.94

Hedge Funds with the Lowest Long U.S. Equity Stock Picking Returns and > $3B AUM, 3-yr CAGR

There are familiar fund names on both lists, with a combined $112 billion in long AUM.  While these funds’ reported returns will differ from those above due principally to factor (systematic) sources (market / sector betas, et cetera), international holdings, fixed income positions, derivatives, and shorts, αReturn is a clear and predictive measure of stock picking skill reflecting returns in excess of passive risks taken. Unlike nominal returns, Sharpe Ratios, and other returns-based measures (which revert), αReturn reflects what investors pay fees for: performance independent of risks taken. What’s more, both positive and negative αReturns tend to persist.

The tables above also show several related skill metrics. For example, βReturn is return from market timing, and αβReturn is total active return combining security selection and market timing. The Scores above, such as αScore, quantify return consistency using a scale of 0 to 100: 0 corresponds to consistently negative returns; 100 to consistently positive.

The following charts show cumulative αReturns of the best and worst 3-year long U.S. equity stock pickers from the above group. Portfolio αReturns in blue compare to the peer group of all hedge funds’ long U.S. equity portfolio in gray:

Chart of the historical cumulative return from security selection (stock picking) of the long U.S. equity portfolio of Harbinger Capital Partners LLC

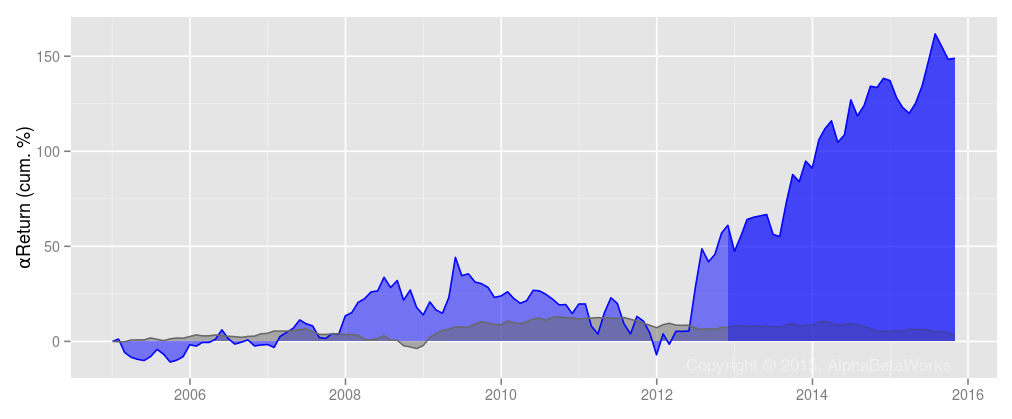
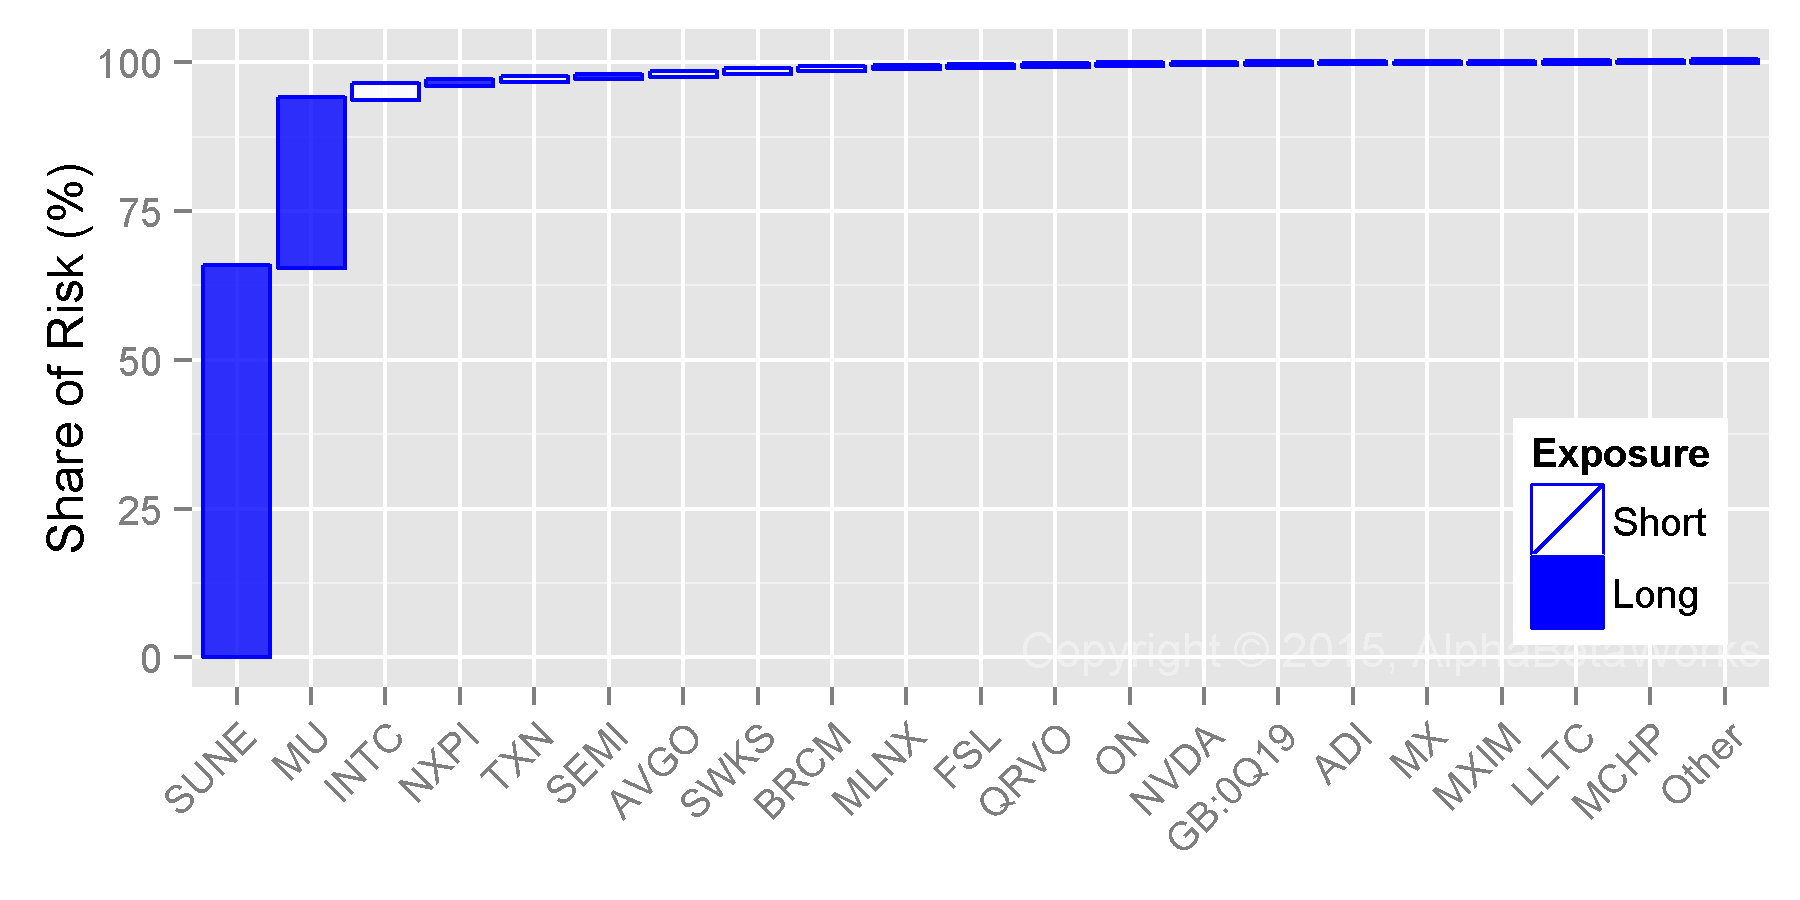
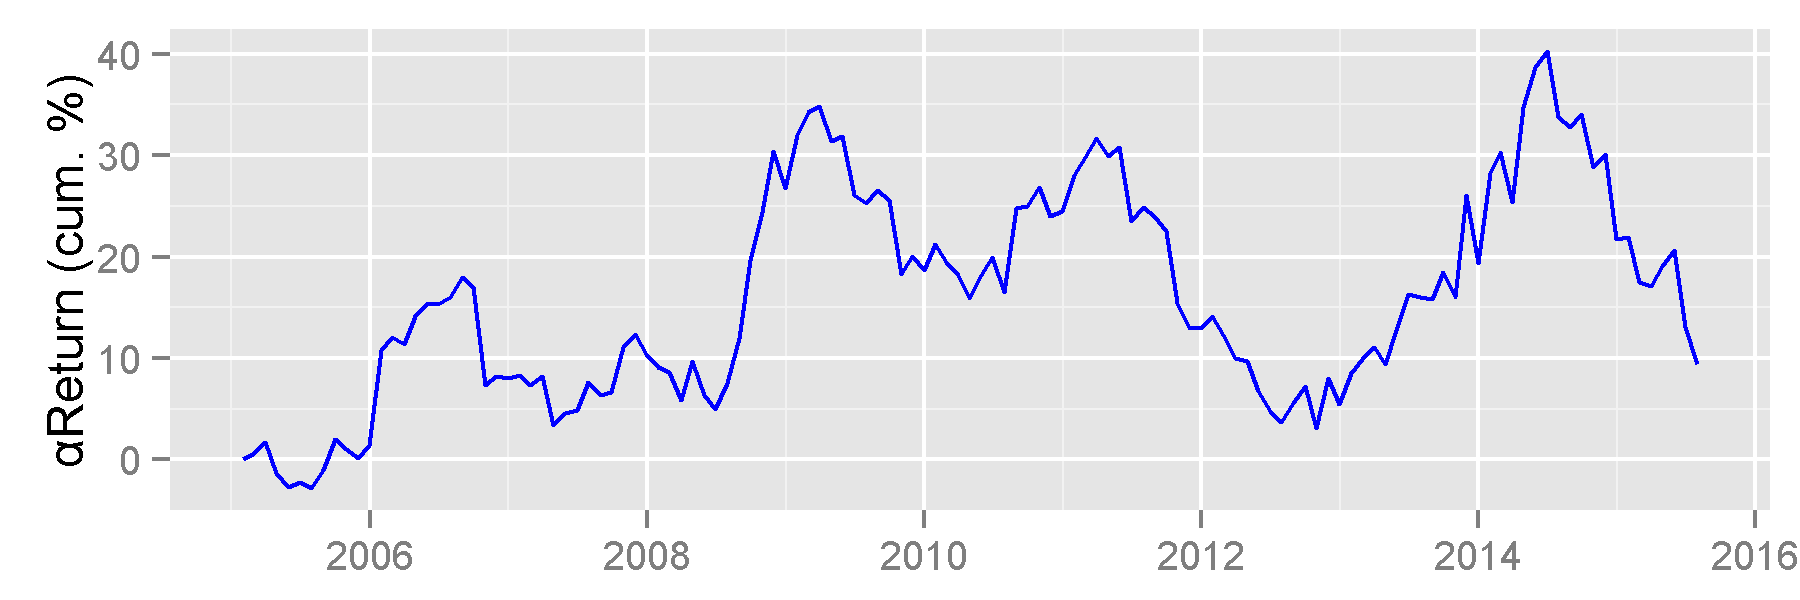
Harbinger Capital Partners LLC: Risk-adjusted Return from Security Selection (αReturn), Long U.S. Equity Portfolio

Chart of the historical cumulative return from security selection (stock picking) of the long U.S. equity portfolio of Bridgewater Associates LP

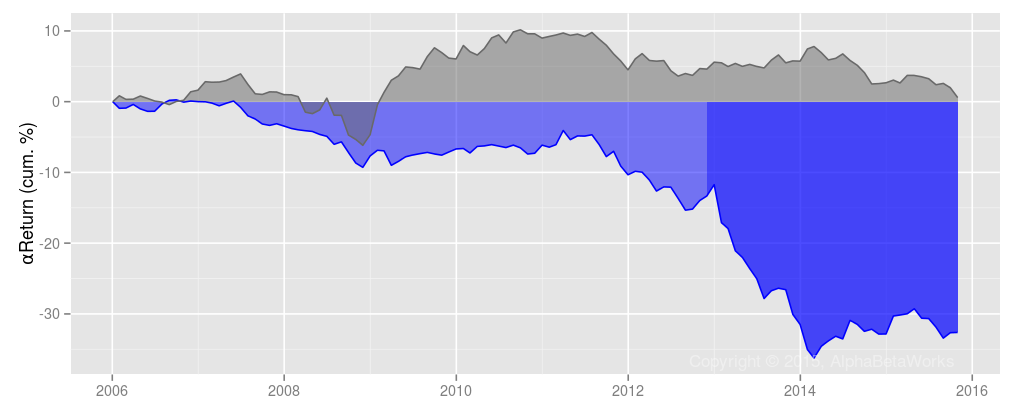
Bridgewater Associates LP: Risk-adjusted Return from Security Selection (αReturn), Long U.S. Equity Portfolio

Conclusions

A comparison of nominal long hedge fund portfolio performance to market indices is misleading and can lead to allocators selecting high-return funds that are, in truth, merely high risk. Since systematic fund risk varies, the assumption that outperformance relative to S&P500 is alpha is wrong. In a rising market, allocators and consultants who make these mistakes are likely to allocate to the most aggressive managers, rather than the most skilled. In a flat or declining market, these mistakes are revealed, leading to losses, pain, and embarrassment.

The solution is using skill analytics that discriminate among the different levels of systematic risk, like AlphaBetaWorks’ αReturn (among others), which reveals managers with investment skill likely to generate future alpha.

The information herein is not represented or warranted to be accurate, correct, complete or timely.
Past performance is no guarantee of future results.
Copyright © 2012-2015, AlphaBetaWorks, a division of Alpha Beta Analytics, LLC. All rights reserved.
Content may not be republished without express written consent.
U.S. Patents Pending.

Asset Flows and Hedge Fund Crowding

The Virtuous and Vicious Cycles of Crowding

Hedge Fund Crowding has cost investors $12 billion in the first 10 months of 2015, and $9 billion in the August-October 2015 rout. That is to say, tractable hedge funds’ long U.S. equity portfolios have suffered severely negative active return from security selection (alpha, or αReturn) this year, and the liquidation has accelerated. Even ignoring fees, had hedge fund investors taken the same risks passively, they would have made $20 billion more since the winds turned in late 2014.

Crowding can be either a good thing or a bad thing: Net flows into crowded names can create positive alpha, typically gradually.  However, liquidation of crowded longs is often rapid and painful.  Indeed, the latter has been the case since 2014. In the face of these outflows, identifying and avoiding crowded bets is more vital than ever for fund managers, and choosing differentiated managers is more vital than ever for allocators.

Hedge Fund Alpha from Crowding

Below is a chart of the cumulative risk-adjusted return from security selection (alpha, or αReturn) of the AlphaBetaWorks’ Hedge Fund Aggregate, or HF Aggregate (a detailed discussion of crowding and our methodology is at the end of this piece):

Chart of the historical risk-adjusted return from security selection of the Hedge Fund Aggregate Portfolio

Cumulative Return from Security Selection of U.S. Hedge Fund Aggregate

Note the three distinct states of alpha generation for HF Aggregate: positive alpha from 2005 through late 2010, zero alpha (flat) from 2011 to mid-2014, and severely negative alpha from mid-2014 through late-2015. The decline from the 2009-2014 plateau is nearly $23 billion, which makes recent losses nearly 1.5 times greater than gains from the prior nine years.

Several more observations from the chart above are worth discussing:

First, HF Aggregate did not record severe negative alpha in 2008. Not surprisingly, negative nominal hedge fund long returns during this era were systematic, rather than idiosyncratic returns from security selection. However, numerous sectors within HF Aggregate experienced severe liquidations, some of which we have discussed in our prior work.

Second, the severity of the most-recent liquidation of crowded names is stunning. Accumulation is usually gradual. But liquidations tend to gather steam quickly when crowded stocks and hedge funds underperform. The severity of the most recent liquidation of crowded hedge fund names is historically unprecedented.

The key lesson here, for both hedge fund managers and allocators, is to know whether crowding is your friend or enemy.  If crowding is your friend, enjoy the virtuous cycle but be wary.  If it is your enemy, beware of the vicious cycle but be opportunistic. In individual sectors, forced liquidations do tend to end with mean-reversions: the biggest losers can eventually present attractive opportunities.

Hedge Fund Sector Alpha – Top Gains and Losses

Below are the four best-performing sectors within the HF Aggregate, ranked by dollar returns from security selection (alpha) since Q2 2014:

Chart of the historical risk-adjusted return from security selection of the Hedge Fund Aggregate Portfolio for the Top-Return Sectors

Cumulative Dollar Return from Security Selection of U.S. Hedge Fund Sector Aggregates: Top Sectors

The following table lists the top contributors to the above performance from of our database of thousands of positions spanning over 100 sectors:

Sector Symbol Name  αReturn ($ mil.)
Cable and Satellite TV CHTR Charter Communications, Inc. Class A                      324
Packaged Software ORCL Oracle Corporation                      262
Cable and Satellite TV LBTYA Liberty Global Plc Class A                      206
Cable and Satellite TV TWC Time Warner Cable Inc.                      169
Packaged Software ADBE Adobe Systems Incorporated                      159
Casinos and Gaming MGM MGM Resorts International                        98
Packaged Software ADSK Autodesk, Inc.                        70
Casinos and Gaming BYD Boyd Gaming Corporation                        66
Casinos and Gaming LVS Las Vegas Sands Corp.                        57
Cable and Satellite TV CVC Cablevision Systems Corporation Class A                        57

Below are the four worst-performing sectors within the HF Aggregate, ranked by dollar returns from security selection (alpha) since Q2 2014:

Chart of the historical risk-adjusted return from security selection of the Hedge Fund Aggregate Portfolio for the Bottom-Return Sectors

Cumulative Dollar Return from Security Selection of U.S. Hedge Fund Sector Aggregates: Bottom Sectors

The following are the top contributors to the above performance:

Sector Symbol Name  αReturn ($ mil.)
Semiconductors SUNE SunEdison, Inc.                  (2,100)
Chemicals: Specialty GB:PAH Platform Specialty Products Corp.                     (688)
Internet Software and Services GOOGL Alphabet Inc. Class A                     (356)
Chemicals: Specialty LYB LyondellBasell Industries NV                     (227)
Semiconductors NXPI NXP Semiconductors NV                     (191)
Oil and Gas Production WPZ Williams Partners, L.P.                     (176)
Semiconductors INTC Intel Corporation                     (176)
Oil and Gas Production CHK Chesapeake Energy Corporation                     (175)
Oil and Gas Production OXY Occidental Petroleum Corporation                     (132)
Internet Software and Services RAX Rackspace Hosting, Inc.                     (116)

The first chart above shows positive alpha in four sectors of the HF Aggregate: packaged software, regional banks, casinos & gaming, and cable & satellite TV.  This is likely from a combination of manager skill, positive idiosyncratic events, and fund flows.  The second chart shows severe negative alpha in oil & gas production, internet software & sales, specialty chemicals, and semiconductors. This also reflects a combination of poor investment skill, negative events, and liquidations in crowded names.

Identifying and Quantifying Hedge Fund Crowding

This piece follows the approach of our earlier articles on fund crowding: We created a position-weighted portfolio (HF Aggregate) consisting of popular long U.S. equity holdings of all hedge funds with medium to low turnover that are tractable from quarterly position filings. We then analyzed HF Aggregate’s risk relative to the U.S. Market (Russell 3000) using AlphaBetaWorks’ Statistical Equity Risk Model. This proven tool for forecasting portfolio risk and performance identified aggregate and sector αReturn, as well as specific sources of crowding. αReturn is the residual portfolio performance and the return it would have generated if markets had been flat.

Without an effective risk model, simplistic crowding analyses ignore the systematic and idiosyncratic exposures of positions and typically merely identify as crowded companies with the largest market capitalizations. Further, since portfolios with no overlap in holdings can have matching factor exposures and can track each other closely, such simplistic analyses overlook factor (systematic) crowding.

For additional clarification of the benefits of robust crowding analyses, we published an article on crowding in the semiconductor industry in September, which highlighted the crowded state of the sector and profiled two particularly crowded stocks that have experienced severe liquidation – Micron (MU) and SunEdison (SUNE).

Conclusions

Recent risk-adjusted returns of crowded hedge fund bets have been horrific. Investors would be wise to step carefully around any crowded names or any funds that traffic in them. Our methodology provides insights into crowding at aggregate market, sector, and stock levels. The ability to identify the sources of crowding with a robust risk model provides fund managers and allocators with vital tools: managers can identify and avoid crowded situations; allocators can enhance their due-diligence by identifying differentiated managers and avoid, or divest from, the undifferentiated.

The information herein is not represented or warranted to be accurate, correct, complete or timely.
Past performance is no guarantee of future results.
Copyright © 2012-2015, AlphaBetaWorks, a division of Alpha Beta Analytics, LLC. All rights reserved.
Content may not be republished without express written consent.

Hedge Fund Crowding Costs: Q3 2015

Applying a robust risk model to hedge fund holdings data helps avoid losses and yields profitable opportunities. In this article, we highlight the sectors with the largest Hedge Fund losses due to crowding in Q3 2015, which sum to $4 billion. Our methodology provides an early-warning system for losses in crowded names. This analysis also identifies crowded stocks beaten up by hedge fund liquidations, which tend to mean-revert.

Analyzing Hedge Fund Sector Crowding

Our edge comes from a central thesis: the most crowded stocks are those that contribute the most to hedge fund stock-specific volatility (volatility of alpha). Furthermore, the direction of this alpha (positive or negative) is a leading indicator. A robust analysis of the AlphaBetaWorks Statistical Equity Risk Model allows us to identify stocks that are the highest contributors to stock-specific volatility for hedge funds in each sector.  These are the most crowded stocks that stand to benefit the most from accumulation and stand to lose the most from liquidation.

While a static crowding analysis using our risk model provides valuable insights, we go further by identifying Hedge Fund Aggregate Sector Alpha – the alpha (stock-specific performance) of aggregated hedge fund portfolios by sector.  This makes the analysis dynamic: If Hedge Fund Aggregate Sector Alpha is trending up, capital is flowing into crowded stocks. Conversely, if it is trending down, capital is flowing out of crowded stocks – often abruptly. Yes, crowding is good at some times and bad at others.  Further, Hedge Fund Aggregate Sector Alpha trends persist for months and years, providing advanced notice of losses. Importantly, crowded stocks hit hard by liquidations tend to mean-revert: the worst risk-adjusted performers often become attractive long opportunities.

Hedge Fund Sector Aggregates

We create aggregate portfolios of hedge fund positions in each sector. Each such sector portfolio is a Hedge Fund Sector Aggregate within which we identify the highest contributors to security-specific (residual) volatility (the most crowded stocks). This follows the approach of our earlier articles on hedge fund crowding.

The Hedge Fund Sector Aggregate Alpha (αReturn, residual, or security-specific return) measures hedge fund security selection performance in a sector. It is the return HF Sector Aggregate would have generated if markets had been flat. αReturn can indicate accumulations and liquidations.

The AlphaBetaWorks Statistical Equity Risk Model, a proven tool for forecasting portfolio risk and performance, estimated factor exposures and residuals. Without an effective risk model, simplistic crowding analyses ignore the systematic and idiosyncratic exposures of positions and typically merely identify companies with the largest market capitalizations.

Sectors with the Largest Losses from Hedge Fund Crowding

During Q3 2015, hedge funds lost $4 billion to security selection in the five sectors below. Said another way: if hedge funds had simply invested passively with the same risk, their sector long equity portfolios would have made $4 billion more. The monthly losses are listed (in $millions) below:

7/31/2015 8/31/2015 9/30/2015 Total
Other Consumer Services -101.16 -113.93 -312.84 -426.77
Oil and Gas Pipelines 472.21 -465.63 -10.29 -475.93
Specialty Chemicals -155.87 196.41 -730.73 -534.32
Oil Refining and Marketing 262.69 -167.15 -388.52 -555.67
Semiconductors -240.71 -1,422.70 -660.95 -2,083.65

The Semiconductor Sector was particularly painful for hedge funds in Q3 2015, which we examined in a previous article.

Below we provide our data on three of the above sectors: historical Hedge Fund Sector Alpha and the most crowded names.

Specialty Chemicals – Hedge Fund Alpha and Crowding

Hedge Fund Specialty Chemicals Security Selection Performance

Hedge Fund Specialty Chemicals Sector Aggregate Historical Security Selection Performance

Historical Return from Security Selection of Hedge Fund Specialty Chemicals Sector Aggregate

Hedge Fund Specialty Chemicals Crowding

Chart of the stock-specific hedge fund crowding the cumulative contributors to the residual variance of Hedge Fund Specialty Chemicals Sector Aggregate Portfolio relative to Market

Crowded Hedge Fund Specialty Chemicals Sector Bets

The following table contains detailed data on these crowded holdings:

Exposure (%) Net Exposure Share of Risk (%)
HF Sector Aggr. Sector Aggr. % $mil Days of Trading
GB:PAH Platform Specialty Products Corp. 17.59 2.52 15.07 1,351.8 14.3 44.62
APD Air Products and Chemicals, Inc. 47.46 13.89 33.57 3,010.8 13.7 22.09
LYB LyondellBasell Industries NV 3.36 23.03 -19.67 -1,764.2 -5.9 14.04
GRBK Green Brick Partners, Inc. 2.99 0.25 2.74 245.7 79.7 10.58
GRA W. R. Grace \& Co. 11.76 3.45 8.32 745.8 11.0 2.99
PX Praxair, Inc. 0.31 16.29 -15.98 -1,433.5 -5.9 2.21
AXLL Axiall Corporation 2.79 1.20 1.59 142.8 4.5 0.74
TROX Tronox Ltd. 1.80 0.45 1.35 121.2 14.2 0.36
ARG Airgas, Inc. 0.19 3.77 -3.59 -321.8 -4.1 0.33
SIAL Sigma-Aldrich Corporation 3.32 7.88 -4.56 -408.6 -2.3 0.28
NEU NewMarket Corporation 0.23 2.61 -2.38 -213.4 -6.0 0.26
VHI Valhi, Inc. 0.02 0.91 -0.88 -79.2 -240.2 0.26
CYT Cytec Industries Inc. 0.07 2.04 -1.97 -176.5 -2.0 0.18
ASH Ashland Inc. 1.66 3.89 -2.23 -200.0 -2.4 0.18
POL PolyOne Corporation 0.19 1.65 -1.46 -131.2 -4.3 0.10
TANH Tantech Holdings Ltd. 0.00 0.19 -0.19 -17.3 -2.7 0.09
BCPC Balchem Corporation 0.00 0.82 -0.82 -73.4 -8.8 0.07
CBM Cambrex Corporation 0.06 0.65 -0.59 -53.2 -2.1 0.06
CMP Compass Minerals International, Inc. 0.15 1.31 -1.16 -104.0 -4.8 0.06
Other Positions 0.29 0.51
Total 100.00

Oil Refining and Marketing – Hedge Fund Alpha and Crowding

Hedge Fund Oil Refining and Marketing Security Selection Performance

Hedge Fund Oil Refining and Marketing Sector Aggregate Historical Security Selection Performance

Historical Return from Security Selection of Hedge Fund Oil Refining and Marketing Sector Aggregate

Hedge Fund Oil Refining and Marketing Crowding

Chart of the stock-specific hedge fund crowding the cumulative contributors to the residual variance of Hedge Fund Oil Refining and Marketing Sector Aggregate Portfolio relative to Market

Crowded Hedge Fund Oil Refining and Marketing Sector Bets

The following table contains detailed data on these crowded holdings:

Exposure (%) Net Exposure Share of Risk (%)
HF Sector Aggr. Sector Aggr. % $mil Days of Trading
MWE MarkWest Energy Partners, L.P. 18.23 5.31 12.92 848.9 6.1 31.86
VLO Valero Energy Corporation 0.38 16.06 -15.68 -1,030.4 -2.7 23.34
TSO Tesoro Corporation 14.32 5.36 8.96 589.0 1.4 12.74
TRGP Targa Resources Corp. 8.99 2.52 6.47 425.3 8.7 7.76
PSX Phillips 66 9.21 21.86 -12.66 -831.8 -2.8 6.03
PBF PBF Energy, Inc. Class A 6.80 1.23 5.56 365.6 7.8 5.84
NGLS Targa Resources Partners LP 8.74 3.52 5.21 342.7 6.2 2.84
WGP Western Gas Equity Partners LP 3.58 6.63 -3.05 -200.5 -7.4 2.06
MPC Marathon Petroleum Corporation 9.59 14.34 -4.75 -312.0 -1.1 1.81
TLLP Tesoro Logistics LP 5.12 2.33 2.79 183.1 3.5 1.45
HFC HollyFrontier Corporation 1.29 4.22 -2.93 -192.3 -1.4 1.11
WNR Western Refining, Inc. 0.21 2.10 -1.89 -124.5 -1.4 0.61
IOC Interoil Corporation 0.66 1.50 -0.84 -55.3 -6.9 0.49
GEL Genesis Energy, L.P. 4.35 2.20 2.15 141.1 6.2 0.34
ENBL Enable Midstream Partners LP 0.39 1.73 -1.34 -88.2 -31.6 0.33
EMES Emerge Energy Services LP 0.01 0.43 -0.42 -27.6 -6.1 0.29
DK Delek US Holdings, Inc. 0.00 1.07 -1.07 -70.0 -1.2 0.26
WNRL Western Refining Logistics, LP 1.57 0.36 1.21 79.5 15.0 0.24
ALJ Alon USA Energy, Inc. 0.00 0.67 -0.67 -44.1 -2.3 0.18
NS NuStar Energy L.P. 3.50 2.33 1.17 76.9 1.4 0.15
Other Positions 0.07 0.28
Total

Semiconductors – Hedge Fund Alpha and Crowding

Hedge Fund Semiconductor Security Selection Performance

Hedge Fund Semiconductors Sector Aggregate Historical Security Selection Performance

Historical Return from Security Selection of Hedge Fund Semiconductors Sector Aggregate

Given the magnitude of recent semiconductor sector liquidations and the record of mean-reversions, the following crowded hedge fund semiconductor bets may now be especially attractive:

Hedge Fund Semiconductor Crowding

Chart of the stock-specific hedge fund crowding the cumulative contributors to the residual variance of Hedge Fund Semiconductors Sector Aggregate Portfolio relative to Market

Crowded Hedge Fund Semiconductors Sector Bets

The following table contains detailed data on these crowded holdings:

Exposure (%) Net Exposure Share of Risk (%)
HF Sector Aggr. Sector Aggr. % $mil Days of Trading
SUNE SunEdison, Inc. 33.18 1.82 31.36 2,550.9 9.6 86.72
MU Micron Technology, Inc. 18.87 3.95 14.93 1,214.1 2.9 8.85
INTC Intel Corporation 3.72 27.94 -24.22 -1,970.2 -1.6 2.01
SEMI SunEdison Semiconductor, Inc. 3.22 0.14 3.08 250.7 52.5 0.38
SWKS Skyworks Solutions, Inc. 0.04 3.85 -3.82 -310.4 -0.9 0.38
TXN Texas Instruments Incorporated 0.09 10.38 -10.28 -836.6 -1.9 0.32
NXPI NXP Semiconductors NV 7.90 4.41 3.49 283.6 1.0 0.29
AVGO Avago Technologies Limited 3.29 6.69 -3.40 -276.3 -0.5 0.18
FSL Freescale Semiconductor Inc 0.02 2.40 -2.38 -193.5 -5.2 0.17
ON ON Semiconductor Corporation 3.39 0.97 2.42 196.6 4.3 0.08
MLNX Mellanox Technologies, Ltd. 1.89 0.43 1.45 118.3 0.7 0.08
BRCM Broadcom Corporation Class A 7.81 5.51 2.30 187.2 0.5 0.07
MX MagnaChip Semiconductor Corporation 0.92 0.05 0.87 70.9 31.2 0.07
ADI Analog Devices, Inc. 0.05 3.90 -3.85 -312.9 -1.7 0.06
QRVO Qorvo, Inc. 1.13 2.32 -1.19 -96.7 -1.1 0.06
NVDA NVIDIA Corporation 0.58 2.10 -1.51 -123.1 -0.4 0.04
GB:0Q19 CEVA, Inc. 1.25 0.08 1.17 95.5 30.7 0.04
MRVL Marvell Technology Group Ltd. 0.04 1.32 -1.28 -104.4 -0.9 0.03
MXIM Maxim Integrated Products, Inc. 0.34 1.90 -1.56 -126.9 -1.7 0.02
MXL MaxLinear, Inc. Class A 0.74 0.12 0.62 50.6 2.8 0.02
Other Positions 0.36 0.13
Total

Conclusions

  • Data on the crowded names and their alpha can reduce losses and provide profitable investment opportunities.
  • A robust and predictive equity risk model is necessary to accurately identify hedge fund crowding.
  • Allocators aware of crowding can gain new insights into portfolio risk, manager skill, and fund differentiation.
  • Crowded bets tend to mean-revert following liquidation: the worst risk-adjusted performers in a sector become the best.
The information herein is not represented or warranted to be accurate, correct, complete or timely.
Past performance is no guarantee of future results.
Copyright © 2012-2015, AlphaBetaWorks, a division of Alpha Beta Analytics, LLC. All rights reserved.
Content may not be republished without express written consent.

Mutual Fund Closet Indexing: 2015 Update

An index fund aims to track the market or its segment, with low fees. An actively managed fund aims to do better, but with higher fees. So in order to earn its fees, an active mutual fund must take risks. Much of the industry does not even try. Mutual fund closet indexing is the practice of charging active fees for passive management. Over a third of active mutual funds and half of active mutual fund capital appear to be investing passively: Funds tend to become less active as they accumulate assets. Skilled managers who were active in the past may be closet indexing today. Simply by identifying closet indexers, investors can eliminate half of their active management fees, increase allocation to skilled active managers, and improve performance. 

Closet Indexing Defined

A common metric of fund activity is Active Share — the percentage difference between portfolio and benchmark holdings. This measure is flawed: If fund with S&P 500 benchmark buys SPXL (S&P 500 Bull 3x ETF), this passive position increases Active Share. If a fund with S&P 500 benchmark indexes Russell 2000, this passive strategy has 100% Active Share. Indeed, recent findings indicate that high Active Share funds that outperform merely track higher-risk benchmarks.

Factor-based analysis of positions can eliminate the above deficiencies. We applied the AlphaBetaWorks Statistical Equity Risk Model to funds’ holdings over time and estimated each fund’s unique factor benchmark. These passive factor benchmarks captured the representative systematic risks of each fund. We then estimated each fund’s past and future tracking errors relative to their factor benchmarks and identified those funds that are unlikely to earn their fees in the future given their current active risk. We also quantified mutual fund closet indexing costs for a typical investor.

This study covers 10-year portfolio history of approximately three thousand U.S. equity mutual funds that are analyzable from regulatory filings. It updates our earlier studies of mutual fund and closet indexing with 2015 data. Due to the larger fund dataset and higher recent market volatility, the mutual fund industry appears slightly more active now than in the 2014 study.

Information Ratio – the Measure of Fund Activity

The Information Ratio (IR) is the measure of active return a fund generates relative to its active risk, or tracking error. We estimated each fund’s IR relative to its factor benchmark. The top 10% of U.S. equity mutual funds achieved IRs above 0.36:

Chart of the historical information ratio for active returns of U.S. mutual funds’ equity portfolios

U.S. Equity Mutual Funds: Historical Information Ratio Distribution

 Min. 1st Qu.  Median    Mean 3rd Qu.    Max.
-5.34   -0.49   -0.22   -0.23    0.06    3.26

If a fund outperforms 90% of the group and achieves 0.36 IR, then it needs tracking error above 1% / 0.36 = 2.79% to generate active return above 1%. So assuming a typical 1% fee, if a fund were able to consistently achieve IR in the 90th percentile, it would need annual tracking error above 2.79% to generate net active return. As we show, much of the industry is far less active. In fact, half of U.S. “active” equity mutual fund assets do not even appear to be trying to earn a 1% active management fee.

Historical Mutual Fund Closet Indexing

Tracking error comes from active exposures: systematic (factor) and idiosyncratic (stock-specific) bets. The AlphaBetaWorks Statistical Equity Risk Model used to estimate these exposures is highly accurate and predictive for a typical equity mutual fund.

Over 28% (746) of the funds have taken too little risk in the past. Even if they had exceeded the performance of 90% of their peers each year, they would still have failed to earn a typical fee. These funds have not even appeared to try to earn their fees:

Chart of the historical mutual fund closet indexing as measured by the tracking error of active returns of U.S. mutual funds’ equity portfolios

U.S. Equity Mutual Funds: Historical Tracking Error Distribution

Min. 1st Qu.  Median    Mean 3rd Qu.    Max.
0.35    2.63    3.95    4.62    5.90   26.60

Current Mutual Fund Closet Indexing

Funds tend to become less active as they grow. To control for this, we estimated current tracking errors of all funds relative to their factor benchmarks.

Over a third (961) of the funds are taking too little risk currently. Even if they exceed the performance of 90% of their peers each year, they will still fail to merit a typical fee. These funds are not even appearing to try to earn their fees:

Chart of the predicted future mutual fund closet indexing as measured by the tracking error of active returns of U.S. mutual funds’ equity portfolios

U.S. Equity Mutual Funds: Predicted Future Tracking Error Distribution

Min. 1st Qu.  Median    Mean 3rd Qu.    Max.
0.92    2.45    3.20    3.52    4.29   20.90

Capital-Weighted Mutual Fund Closet Indexing

Since funds become less active as they grow, larger mutual funds are more likely to closet index. The 36% of mutual funds that have estimated future tracking errors below 2.79% represent half of the assets ($2.25 trillion out of the $4.57 trillion total in our study). Hence, half of active equity mutual fund capital is unlikely to earn a typical free, even when its managers are highly skilled:

Chart of the capital-weighted predicted future mutual fund closet indexing as measured by the tracking error of active returns of U.S. mutual funds’ equity portfolios

U.S. Equity Mutual Funds: Capital-Weighted Predicted Future Tracking Error Distribution

Min. 1st Qu.  Mean 3rd Qu.    Max.
0.92    2.10  2.79    3.72   20.90

Even the most skilled managers will struggle to generate IRs in the 90th percentile each and every year. Therefore, portfolios of large funds, when built without robust analysis of manager activity, may be doomed to negative net active returns. Plenty of closet indexers charge more than the 1% fee we assume, and plenty of investors will lose even more.

A Map of Mutual Fund Closet Indexing

As a manager accumulates assets, fee harvesting becomes more attractive than risk taking. Managers’ utility curves may thus explain large funds’ passivity. The following map of U.S. mutual fund active management skill (defined by the αβScore of active return consistency) and current activity illustrates that large skilled funds are generally less active. Large skilled funds, represented by large purple circles on the right, cluster towards the bottom area of low tracking error:

Chart of the historical active management skill as represented by the consistency of active returns and predicted future tracking error of active returns of U.S. mutual funds’ equity portfolios

U.S. Equity Mutual Funds: Historical Active Management Skill and Predicted Future Activity

In spite of the widespread mutual fund closet indexing, numerous skilled and active funds remain. Many are young and, with a low asset base, have a long way to grow before fee harvesting becomes seductive for their managers.

Conclusions

  • Over a third of U.S. equity mutual funds are currently so passive that, even if they exceed the information ratios of 90% of their peers, they will still fail to merit a typical fee.
  • Half of U.S. equity mutual fund capital will fail to merit a typical fee, even when its managers are highly skilled.
  • As skilled managers accumulate assets, they are more likely to closet index.
  • A typical investor can re-allocate half of their active equity mutual fund capital to cheap passive vehicles or truly active skilled managers to improve performance.
The information herein is not represented or warranted to be accurate, correct, complete or timely.
Past performance is no guarantee of future results.
Copyright © 2012-2015, 
AlphaBetaWorks, a division of Alpha Beta Analytics, LLC. All rights reserved.
Content may not be republished without express written consent.

Hedge Fund Closet Indexing: 2015 Update

A fund must take active risk to generate active returns in excess of fees. However, some managers charge active fees but manage their funds passively. Managers also tend to become less active as they accumulate assets. This problem of hedge fund closet indexing is widespread. Over a third of capital invested in U.S. hedge funds’ long equity portfolios is too passive to warrant the common 1.5/15% fee structure, even if its managers are highly skilled. Investors can replace closet indexers with cheap passive vehicles or with truly active skilled managers and improve performance.

Hedge Fund Closet Indexing Background

This article updates our earlier pieces on mutual fund and hedge fund closet indexing with mid-2015 data. We examine current and historical long equity portfolios of approximately 500 U.S. hedge funds that are analyzable from regulatory filings and identify those that are unlikely to earn their fees in the future given their current active risk. We then quantify the cost of hedge fund closet indexing for a typical investor.

Recall from our earlier discussion that Active Share is a brittle metric of fund activity: If a fund buys a position in an index ETF, this passive position may increase Active Share while making the fund less active. If a fund with S&P 500 benchmark simply indexes Russell 2000, this passive fund will have 100% Active Share. These examples are consistent with recent findings that high Active Share funds appear to outperform merely due to miss-specified benchmarks. Our factor-based approach identifies the unique passive factor benchmark for each fund and is free from these deficiencies.

Information Ratio – the Measure of Active Risk Required to Earn a Fee

The Information Ratio (IR) is a measure of active return relative to active risk (tracking error). The best-performing 10% of U.S. hedge funds’ long portfolios achieve IRs above 0.59 relative to their passive factor benchmarks:

Chart of the historical information ratio for active returns of U.S. hedge funds’ long equity portfolios

U.S. Hedge Fund Long Equity Portfolios: Historical Information Ratio Distribution

 Min. 1st Qu.  Median    Mean 3rd Qu.    Max.
-2.58   -0.34   -0.02   -0.04    0.28    2.17

If a fund’s long portfolio exceeds the performance of 90% of the peers and achieves a 0.59 IR, then it needs a tracking error above 1.00% / 0.59 = 1.69% to generate active return above 1%.

Let’s assume that hedge funds’ long equity portfolios are burdened with 1.5% management fee and 15% incentive allocation. Further assuming a 7% market return, the mean fee is 2.55%. If all funds were able to achieve IRs in the 90th percentile, they would need annual tracking error above 2.55% / 0.59 = 4.32% to earn the 2.55% estimated mean fee and a positive net active return. We show below that a significant fraction of the industry takes too little active risk to achieve this tracking error. In fact, much of the industry may not even be trying to earn its fees.

Historical Hedge Fund Closet Indexing

Tracking error comes from funds’ active exposures: systematic (factor) and idiosyncratic (stock-specific) bets. We applied the AlphaBetaWorks Statistical Equity Risk Model to funds’ historical holdings to estimate their unique factor benchmarks. These are passive factor portfolios that capture the representative systematic risks of each fund. We then estimated past and future tracking errors of each fund relative to these benchmarks.

Over 13% (67) of the funds have taken so little risk that, even if they had exceeded the performance of 90% of their peers each year, they would still have failed to earn a typical fee. In other words, these funds have not even appeared to try earning their fees:

Chart of the historical tracking error of active returns of U.S. hedge funds’ long equity portfolios

U.S. Hedge Fund Long Portfolios: Historical Tracking Error Distribution

Min. 1st Qu.  Median    Mean 3rd Qu.    Max.
0.43    6.04   10.04   15.17   19.43  201.00

Estimated Future Hedge Fund Closet Indexing

Fund activity changes over time as managers accumulate assets. Many funds are more passive today than they have been historically. To control for this, we estimated current tracking errors.

Approximately a fifth (88) of the funds are currently taking so little risk that, even if they were to exceed the performance of 90% of their peers each year, they would still fail to merit a typical fee.  In other words, these funds are not even appearing to try earning their fees:

Chart of the predicted future tracking error of active returns of U.S. hedge funds’ long equity portfolios

U.S. Hedge Fund Long Portfolios: Predicted Future Tracking Error Distribution

Min. 1st Qu.  Median    Mean 3rd Qu.    Max.
0.76    4.96    7.67   11.01   12.48  148.30

Capital-Weighted Hedge Fund Closet Indexing

Larger hedge funds are more likely to engage in closet indexing. While approximately 20% of hedge funds surveyed have estimated future tracking errors below 4.30%, they represent a third of the assets ($240 billion out of the $720 billion total in our sample). Therefore, a third of hedge fund long equity capital is unlikely to exceed 4.32% tracking error and earn a typical fee, even when its managers are highly skilled:

Chart of the capital-weighted predicted future tracking error of active returns of U.S. hedge funds’ long equity portfolios

U.S. Hedge Fund Long Portfolios: Capital-Weighted Predicted Future Tracking Error Distribution

Min. 1st Qu.  Mean 3rd Qu.    Max.
0.76    3.70  5.49   8.21   116.47

The assumption that all funds will generate higher IRs than 90% of their peers have historically is unrealistic. Hence, a portfolio of large funds built without a robust analysis of hedge fund closet indexing may be doomed to generate negative net active returns, irrespective of the managers’ skills. The 2.55% fee cited here is the estimated mean. Plenty of closet indexers charge more on their long equity portfolios, and plenty of investors who remain with them stand to lose even more.

While there is less closet indexing among hedge funds than among mutual funds, the fees that hedge funds charge and the expectations they set are significantly higher.  When practiced by hedge funds, closet indexing is all the more egregious.

A Map of Hedge Fund Closet Indexing

The evolution of managers’ utility curves may explain their reluctance to take risk. As a manager accumulates assets, fee harvesting becomes increasingly attractive. The following map of U.S. hedge fund active management skill and current activity illustrates that large skilled funds are generally less active (large purple circles on the right cluster towards the bottom):

Map of U.S. hedge fund closet indexing for long equity portfolios, charting historical active management skill as represented by the consistency of active returns and predicted future tracking error of active returns of U.S. hedge funds’ long equity portfolios

U.S. Hedge Fund Long Portfolios: Historical Active Management Skill and Predicted Future Activity

Yet, there are notable exceptions – several large, skilled, and active managers remain.

Conclusions

  • A fifth of U.S. hedge funds’ long equity portfolios are currently so passive that, even if they exceed the information ratios of 90% of their peers, they will still fail to merit a typical fee.
  • A third of U.S. hedge funds’ long equity capital will fail to merit a typical fee, even when its managers are highly skilled.
  • As skilled managers accumulate assets, they are more likely to closet index.
  • A typical hedge fund investor can replace a third of long hedge fund capital with cheap passive vehicles or truly active skilled managers and improve performance.
The information herein is not represented or warranted to be accurate, correct, complete or timely.
Past performance is no guarantee of future results.
Copyright © 2012-2015, 
AlphaBetaWorks, a division of Alpha Beta Analytics, LLC. All rights reserved.
Content may not be republished without express written consent.

Hedge Fund Semiconductor Sector Crowding

Our June 2015 piece listed SunEdison (SUNE) and Micron (MU) among the top ten stocks driving hedge fund risk and alpha. In the semiconductor sector, they were virtually the sole drivers. In addition, since mid-2014 semiconductor sector alpha for hedge funds has been sharply negative. Extreme semiconductor sector crowding and threat of liquidation were ominous and actionable. Investors armed with capable analytics could have avoided the bulk of their losses (by liquidating), or profited (by shorting); allocators could have asked undifferentiated managers probing questions.

This situation is not unique – liquidations devastated crowded bets across several sectors in 2015. For example, our July analysis highlighted the liquidation of crowded energy stocks. These lessons for investors and allocators apply across sectors and market cycles.

Hedge Fund Crowding in SunEdison (SUNE) and Micron (MU)

SunEdison and Micron were the two major sources of idiosyncratic (stock-specific) risk for hedge funds in the semiconductor sector for some time. For example, MU and SUNE contributed over 90% of stock-specific hedge fund risk in the semiconductor sector in Q3 2014:

Chart of the main stock-specific bets and their cumulative contribution to the residual variance of Hedge Fund Semiconductor Sector Aggregate Portfolio relative to Market on 9/30/2014

Stocks Contributing Most to U.S. Hedge Fund Semiconductor Aggregate Relative Residual Risk in Q3 2014

This continued into the new year, and by Q2 2015, MU and SUNE contributed almost 95% of stock-specific hedge fund risk in the semiconductor sector:

Chart of the main stock-specific bets and their cumulative contribution to the residual variance of Hedge Fund Semiconductor Sector Aggregate Portfolio relative to Market on 6/30/2015

Stocks Contributing Most to U.S. Hedge Fund Semiconductor Aggregate Relative Residual Risk in Q2 2015

The following table contains detailed data on hedge fund semiconductor crowding as of Q2 2015:

Exposure (%) Net Exposure Share of Risk (%)
HF Sector Aggregate Sector Aggregate % $mil Days of Trading
SUNE SunEdison, Inc. 28.03 1.24 26.79 2,177.1 9.2 65.40
MU Micron Technology, Inc. 31.10 5.56 25.54 2,075.8 3.9 28.23
INTC Intel Corporation 5.71 28.19 -22.49 -1,827.7 -2.0 2.48
NXPI NXP Semiconductors NV 8.55 4.46 4.10 333.0 1.1 0.55
TXN Texas Instruments Incorporated 0.13 11.40 -11.27 -915.6 -2.7 0.50
SEMI SunEdison Semiconductor, Inc. 3.86 0.20 3.65 296.8 44.9 0.45
AVGO Avago Technologies Limited 1.61 6.20 -4.59 -373.5 -0.8 0.44
SWKS Skyworks Solutions, Inc. 0.05 3.57 -3.52 -286.1 -0.8 0.44
BRCM Broadcom Corporation Class A 0.33 4.53 -4.20 -341.2 -0.7 0.33
MLNX Mellanox Technologies, Ltd. 2.39 0.39 1.99 161.8 5.7 0.21
FSL Freescale Semiconductor Inc 0.07 2.38 -2.31 -187.8 -2.7 0.21
QRVO Qorvo, Inc. 0.19 2.25 -2.06 -167.7 -0.9 0.18
ON ON Semiconductor Corporation 3.60 0.99 2.60 211.5 3.5 0.12
NVDA NVIDIA Corporation 0.10 2.19 -2.09 -170.2 -0.9 0.08
GB:0Q19 CEVA, Inc. 1.39 0.08 1.30 106.0 42.2 0.07
ADI Analog Devices, Inc. 0.02 3.74 -3.72 -302.3 -2.1 0.07
MX MagnaChip Semiconductor Corporation 0.57 0.04 0.54 43.5 9.5 0.03
MXIM Maxim Integrated Products, Inc. 0.38 1.87 -1.50 -121.6 -1.3 0.02
LLTC Linear Technology Corporation 0.00 2.13 -2.13 -173.2 -1.8 0.02
MCHP Microchip Technology Incorporated 0.11 1.88 -1.77 -143.7 -1.5 0.02
Other Positions 0.34 0.15
Total 100.00

Hedge Fund Security Selection in the Semiconductor Sector

The above data is informative and actionable on its own – it points to massive concentration of risk. However, the data becomes more threatening when combined with hedge funds’ semiconductor security selection performance:

Hedge Fund Semiconductor Sector Aggregate Historical Security Selection Performance

Historical Return from Security Selection of Hedge Fund Semiconductor Sector Aggregate

AlphaBetaWorks’s metric of security selection is αReturn – the performance a portfolio would have generated if markets had been flat. Hedge funds enjoyed positive αReturn in the semiconductor sector over ten years, albeit with up and down cycles. The latest surge in αReturn started in 2012 and peaked in 2014. Since then, hedge funds’ long semiconductor picks underperformed by over 30%, on a risk-adjusted basis. Had hedge funds taken the same risk passively (say by owning a cap-weighted semiconductor index) they would have made over 30% more.

Negative αReturn is often a sign of liquidation and hedge fund semiconductor bets have a history of booms and busts. As illustrated in the charts above, most of the stock-specific hedge fund risk came from two stocks: SunEdison and Micron. When liquidation became evident in late-2014, these stocks became vulnerable.

Hedge Fund Liquidation of SUNE and MU

Analytics built on a robust risk model, such as the AlphaBetaWorks Statistical Equity Risk Model used here, identify crowding and leading indicators of liquidations. Portfolio managers and investors armed with these analytics see early warning signs and avoid losses, or even profit from herding. Allocators have the data on undifferentiated managers.

The above pattern is not unique: crowded names typically underperform on a risk-adjusted basis. Liquidations are routine.

Conclusions

  • Holdings-based analytics built on robust risk models identify crowding and detect early signs of portfolio liquidations.
  • Investors with the tools to identify hedge fund crowding and liquidations can reduce losses or profit from opportunities.
  • Allocators aware of crowding can gain new insights into portfolio risk, manager skills, and fund differentiation.
The information herein is not represented or warranted to be accurate, correct, complete or timely.
Past performance is no guarantee of future results.
Copyright © 2012-2015, AlphaBetaWorks, a division of Alpha Beta Analytics, LLC. All rights reserved.
Content may not be republished without express written consent.

Hedge Fund Crowding Update – Q2 2015

Hedge funds share a few bets. These crowded systematic and idiosyncratic exposures are the main sources of the industry’s relative performance and of many firms’ returns. Two factors and three stocks were behind most herding of hedge fund long U.S. equity positions in Q2 2015.

Investors should treat consensus ideas with caution: Crowded stocks are prone to mass liquidation. Crowded hedge fund bets tend to do poorly in most sectors, though there are some exceptions.

Identifying Hedge Fund Crowding

This piece follows the approach of our earlier articles on crowding: We created a position-weighted portfolio (HF Aggregate) consisting of the popular U.S. equity holdings of all long hedge fund portfolios tractable from regulatory filings. We then analyzed HF Aggregate’s risk relative to U.S. Market Aggregate (similar to the Russell 3000 index) using AlphaBetaWorks’ Statistical Equity Risk Model to identify sources of crowding.

Hedge Fund Aggregate’s Risk

The Q2 2015 HF Aggregate had 3.2% estimated future tracking error relative to U.S. Market. Factor (systematic) bets were the primary source of risk and systematic crowding increased slightly from prior quarters:

The components of HF Aggregate’s relative risk on 6/30/2015 were the following:

 Source Volatility (%) Share of Variance (%)
Factor 2.46 60.01
Residual 2.01 39.99
Total 3.17 100.00

Because of the close relationship between active risk and active performance, the low estimated future volatility (tracking error) indicates that the long book of a diversified portfolio of hedge funds will behave similarly to a passive factor portfolio. Even if its active bets pay off, HF Aggregate will have a hard time earning a typical fee. Consequently, the long portion of highly diversified hedge fund portfolios will struggle to outperform a passive alternative.

Hedge Fund Factor (Systematic) Crowding

Below are HF Aggregate’s principal factor exposures (in red) relative to U.S. Market’s (in gray) as of 6/30/2015:

Chart of the factor exposures contributing most to the factor variance of Hedge Fund Aggregate Portfolio relative to Market on 6/30/2015

Factor Exposures Contributing Most to the Relative Risk for U.S. Hedge Fund Aggregate

Of these bets, Market (Beta) and Oil are responsible for 90% of the relative factor risk. These are the components of the 2.46% Factor Volatility in the first table:

Chart of the main factors and their cumulative contribution to the factor variance of Hedge Fund Aggregate Portfolio relative to Market on 6/30/2015

Factors Contributing Most to Relative Factor Variance of U.S. Hedge Fund Aggregate

Factor Relative Exposure (%) Portfolio Variance (%²) Share of Systematic Variance (%)
Market 15.76 3.68 60.91
Oil Price 2.93 1.75 28.94
Industrial 9.72 0.53 8.72
Finance -8.36 0.46 7.58
Utilities -2.78 0.25 4.13
Other Factors -0.62 -10.28
Total 6.04 100.00

Exposures to the three main factor bets are near 10-year highs.

Hedge Fund U.S. Market Factor Exposure History

HF Aggregate’s market exposure is approximately 115% (its Market Beta is approximately 1.15). Hedge fund’s long books are taking approximately 15% more market risk than U.S. equities and approximately 20% more market risk than S&P 500. This bet has proven costly in August of 2015:

Chart of the historical exposure of Hedge Fund Aggregate Portfolio to the U.S. Market Factor

U.S. Hedge Fund Aggregate’s U.S. Market Factor Exposure History

Also note that long hedge fund portfolios consistently take 5-15% more market risk than S&P500 and other broad benchmarks. This is why simple comparison of long hedge fund portfolio performance to market indices is misleading.

Hedge Fund Oil Price Exposure History

HF Aggregate’s oil exposure, near 3%, is also close to the 10-year highs last reached in 2009:

Chart of the historical exposure of Hedge Fund Aggregate Portfolio to the Oil Price Factor

U.S. Hedge Fund Aggregate’s Oil Factor Exposure History

As oil prices collapsed in 2014, hedge funds rapidly boosted oil exposure. This contrarian bet is a weak bullish indicator for the commodity.

Hedge Fund Industrial Factor Exposure History

HF Aggregate’s industrials factor exposure remained near the all-time high:

Chart of the historical exposure of Hedge Fund Aggregate Portfolio to the Industrial Factor

U.S. Hedge Fund Aggregate’s Industrial Factor Exposure History

This has been a losing contrarian bet since 2014 and it is a weak bearish indicator for the sector.

Hedge Fund Residual (Idiosyncratic) Crowding

About 40% of hedge fund crowding is due to residual (idiosyncratic, stock-specific) risk. Just three names are responsible for over half of it:

Chart of the main stock-specific bets and their cumulative contribution to the residual variance of Hedge Fund Aggregate Portfolio relative to Market on 6/30/2015

Stocks Contributing Most to Relative Residual Variance of U.S. Hedge Fund Aggregate

These stocks will be primary drivers of HF Aggregate’s and of the most crowded firms’ stock-specific performance. Investors should be ready for seemingly inexplicable volatility due to portfolio liquidation and rebalancing. Though individual crowded names may be wonderful investments, they have tended to underperform:

Symbol Name Exposure (%) Share of Idiosyncratic Variance (%)
VRX Valeant Pharmaceuticals International, Inc. 4.78 36.25
LNG Cheniere Energy, Inc. 1.58 10.53
JD JD.com, Inc. Sponsored ADR Class A 1.59 4.60
NFLX Netflix, Inc. 0.74 4.55
SUNE SunEdison, Inc. 0.92 4.03
CHTR Charter Communications, Inc. Class A 1.55 3.04
PCLN Priceline Group Inc 1.36 2.37
EBAY eBay Inc. 1.47 1.58
FLT FleetCor Technologies, Inc. 1.10 1.17
TWC Time Warner Cable Inc. 1.27 1.17

Investors drawn to these names should not use hedge fund ownership as a plus. Instead, this ownership should trigger particularly thorough due-diligence. Any company slip-ups will be magnified as impatient investors stampede out of positions.

Fund allocators should also pay attention to crowding: Historically, consensus bets have done worse than a passive portfolio with the same risk. Investing in crowded books is investing in a pool of undifferentiated bets destined to disappoint.

AlphaBetaWorks’ analytics identify hedge fund herding in each equity sector. Our fund analytics measure hedge fund differentiation and identify specific skills in each sector that are strongly predictive of future performance.

Summary

  • There is both factor (systematic/market) and residual (idiosyncratic/security-specific) crowding of hedge funds’ long U.S. equity portfolios.
  • Hedge fund crowding is approximately 60% systematic and 40% idiosyncratic.
  • The main sources of systematic crowding are Market (Beta) and Oil.
  • The main sources of idiosyncratic crowding are VRX, LNG, JD, NFLX, and SUNE.
  • The crowded hedge fund portfolio has historically underperformed its passive alternative – allocators and fund followers should pay close attention to these consensus bets.
The information herein is not represented or warranted to be accurate, correct, complete or timely.
Past performance is no guarantee of future results.
Copyright © 2012-2015, AlphaBetaWorks, a division of Alpha Beta Analytics, LLC. All rights reserved.
Content may not be republished without express written consent.

Liquidation of Crowded Hedge Fund Energy Positions

The 2014-2015 energy carnage has been worse for crowded hedge fund energy positions than the global financial crisis. Past liquidations of crowded hedge fund bets were followed by rapid recoveries. Consequently, energy investors should survey the wreckage for opportunities.

Crowded hedge fund oil and gas producers underperformed their sector peers by over 20% since 2013 as fund energy books were liquidated. Crowded oilfield service bets underperformed by over 15%. This is worse than 10-15% underperformance during the 2008-2009 global financial crisis.

Forced hedge fund portfolio liquidations are usually followed by rapid recoveries in the affected names – liquidations during the global financial crisis reversed in under a year. Since the energy market in 2015 faces unique challenges, history may not repeat itself. Still, some of the crowded positions should present opportunities.

Performance of Crowded Hedge Fund Oil and Gas Producer Bets

To explore crowding we analyze hedge fund Oil and Gas Producer Sector holdings (HF Sector Aggregate) relative to the Sector Market Portfolio (Sector Aggregate). HF Sector Aggregate is position-weighted; Sector Aggregate is capitalization-weighted. This follows the approach of our earlier articles on hedge fund crowding.

The figure below plots historical return of HF Oil and Gas Producer Aggregate. Factor return is due to systematic (market) risk. Blue area represents positive and gray area represents negative risk-adjusted returns from security selection (αReturn). Crowded bets underperformed the portfolio with the same systematic risk (factor portfolio) by over 50% during the past 10 years, largely since 2014:

Chart of the passive and security selection performance of the aggregate portfolio of Hedge Fund Oil and Gas Producer Sector holdings

Hedge Fund Oil and Gas Producer Sector Aggregate Historical Performance

The risk-adjusted return from security selection (αReturn) of HF Sector Aggregate is the return it would have generated if markets had been flat – all market effects on performance have been eliminated. This is the idiosyncratic performance of HF Sector Aggregate:

Chart of the security selection performance of the aggregate portfolio of Hedge Fund Oil and Gas Producer Sector holdings

Hedge Fund Oil and Gas Producer Sector Aggregate Historical Security Selection Performance

The above chart reveals that by Q2 2009 the crowded hedge fund energy producers erased underperformance due to 2008 liquidation. The liquidation since 2013 has been even larger than in 2008. Since they may be posed for a steep recovery, crowded hedge fund oil and gas producer bets are worth watching in the coming months.

Performance of Crowded Hedge Fund Oilfield Service Bets

The figure below plots historical return of HF Oilfield Service Aggregate. It follows the approach of HF Oil and Gas Producer Aggregate above:

Chart of the passive and security selection performance of the aggregate portfolio of Hedge Fund Oilfield Service Sector holdings

Hedge Fund Oilfield Service Sector Aggregate Historical Performance

Since 2013, the crowded oilfield service portfolio has underperformed, similarly to the crowded oil and gas portfolio:

Chart of the security selection performance of the aggregate portfolio of Hedge Fund Oilfield Service Sector holdings

Hedge Fund Oilfield Service Sector Aggregate Historical Security Selection Performance

Crowded energy producers and service companies have underperformed sector peers by 15-25% in the latest liquidation. Many may now be attractive, given the recovery that typically follows. Below are the hedge fund energy bets that may present these opportunities:

Crowded Hedge Fund Oil and Gas Producer Bets

The following stocks contributed most to the relative residual (idiosyncratic, security-specific) risk of the HF Oil and Gas Aggregate as of Q1 2015. Blue bars represent long (overweight) exposures relative to Sector Aggregate. White bars represent short (underweight) exposures. Bar height represents contribution to relative stock-specific risk:

Chart of the contribution to relative risk of the most crowded hedge fund oil and gas production bets

Crowded Hedge Fund Oil and Gas Producer Bets

The following table contains detailed data on these crowded hedge fund oil and gas producer bets:

Exposure (%)

Net Exposure

Share of Risk (%)
HF Sector Aggr. Sector Aggr. % $mil Days of Trading
WPZ Williams Partners, L.P. 17.93 4.75 13.18 1,812.2 15.0 23.04
PXD Pioneer Natural Resources Company 14.42 4.01 10.41 1,432.0 4.9 17.91
CRC California Resources Corp 3.42 0.48 2.93 403.2 8.2 10.79
CHK Chesapeake Energy Corporation 8.31 1.55 6.76 930.1 2.8 9.95
COP ConocoPhillips 0.99 12.62 -11.63 -1,599.0 -3.7 7.00
OXY Occidental Petroleum Corporation 0.69 9.25 -8.56 -1,176.6 -3.3 5.45
EOG EOG Resources, Inc. 2.13 8.28 -6.14 -844.7 -2.4 4.40
RRC Range Resources Corporation 5.33 1.45 3.88 533.8 3.4 3.68
CIE Cobalt International Energy, Inc. 3.10 0.64 2.46 338.2 11.2 2.93
OAS Oasis Petroleum Inc. 3.15 0.33 2.82 387.9 2.7 2.39
CMLP Crestwood Midstream Partners LP 3.83 0.45 3.38 465.2 47.0 1.99
AR Antero Resources Corporation 3.97 1.60 2.37 325.5 4.5 1.39
WLL Whiting Petroleum Corporation 3.57 1.04 2.53 347.5 1.2 1.06
NBL Noble Energy, Inc. 0.28 3.12 -2.84 -390.1 -2.2 0.80
CLR Continental Resources, Inc. 0.18 2.68 -2.50 -344.1 -2.2 0.76
COG Cabot Oil \& Gas Corporation 0.49 2.01 -1.52 -209.5 -1.1 0.71
DVN Devon Energy Corporation 0.55 4.06 -3.51 -483.0 -2.2 0.62
EQT EQT Corporation 0.16 2.07 -1.91 -262.3 -2.5 0.59
APA Apache Corporation 1.15 3.74 -2.59 -356.6 -1.7 0.47
APC Anadarko Petroleum Corporation 4.99 7.02 -2.04 -280.2 -0.8 0.43
Other Positions 0.80 3.65
Total 100.00

Crowded Hedge Fund Oilfield Service Bets

The following stocks contributed most to the relative residual risk of the HF Sector Aggregate as of Q1 2015:

Chart of the contribution to relative risk of the most crowded hedge fund oilfield service bets

Crowded Hedge Fund Oilfield Service Bets

The following table contains detailed data on these crowded hedge fund oilfield service bets:

Exposure (%) Net Exposure Share of Risk (%)
HF Sector Aggr. Sector Aggr. % $mil Days of Trading
BHI Baker Hughes Incorporated 32.63 9.95 22.68 1,258.9 6.1 50.38
SLB Schlumberger NV 3.31 38.39 -35.07 -1,946.7 -2.8 22.65
HAL Halliburton Company 28.87 13.42 15.45 857.4 1.4 12.44
DAKP Dakota Plains Holdings, Inc. 0.31 0.04 0.27 15.1 78.3 3.86
HOS Hornbeck Offshore Services, Inc. 3.21 0.24 2.97 164.9 6.8 1.89
NOV National Oilwell Varco, Inc. 2.88 7.38 -4.49 -249.4 -0.9 1.45
FTI FMC Technologies, Inc. 0.02 3.08 -3.06 -169.9 -1.2 1.06
FTK Flotek Industries, Inc. 1.51 0.29 1.22 67.9 5.8 0.85
WFT Weatherford International plc 1.25 3.43 -2.18 -121.1 -1.0 0.71
CLB Core Laboratories NV 0.00 1.62 -1.62 -90.0 -1.1 0.57
SDRL Seadrill Ltd. 0.00 1.66 -1.66 -92.1 -0.6 0.49
OIS Oil States International, Inc. 2.71 0.74 1.97 109.5 2.7 0.39
EXH Exterran Holdings, Inc. 1.98 0.83 1.14 63.4 2.6 0.36
USAC USA Compression Partners LP 1.80 0.24 1.56 86.6 45.7 0.31
OII Oceaneering International, Inc. 0.13 1.93 -1.81 -100.3 -1.5 0.27
FI Frank’s International NV 0.00 1.04 -1.04 -57.7 -4.2 0.26
KNOP KNOT Offshore Partners LP 2.31 0.12 2.19 121.4 47.1 0.25
RES RPC, Inc. 0.05 1.00 -0.96 -53.0 -2.0 0.23
WG Willbros Group, Inc. 0.46 0.07 0.39 21.5 11.3 0.19
MDR McDermott International, Inc. 1.04 0.33 0.71 39.5 1.4 0.17
Other Positions 0.34 1.22
Total 100.00

Summary

  • The 2014-2015 carnage has been worse for crowded hedge fund oil and gas producer and oilfield service bets than the global financial crisis.
  • Past liquidations of crowded positions were followed by rapid recoveries.
  • Energy investors should survey the wreckage of crowded hedge fund energy bets for opportunities.
The information herein is not represented or warranted to be accurate, correct, complete or timely.
Past performance is no guarantee of future results.
Copyright © 2012-2015, AlphaBetaWorks, a division of Alpha Beta Analytics, LLC. All rights reserved.
Content may not be republished without express written consent.


The Impact of Fund Mean Reversion

Real-world restrictions on hedge fund investing wreak havoc on common allocation strategies

Common return measures fail to predict future hedge fund performance. More important, under typical allocation and withdrawal constraints, these failures due to mean reversion become more severe:

  • Portfolios based on top nominal returns and win/loss ratios tend to under-perform.
  • Portfolios based on top Sharpe ratios don’t outperform.
  • Portfolios based on predictive skill analytics and robust factor models continue to consistently outperform.

To illustrate, we follow the approach of our earlier pieces on hedge funds: Our dataset spans the long portfolios of all U.S. hedge funds active over the past 15 years that are tractable using 13F filings. Top- and bottom-performing portfolios are selected based on 36 months of performance history.

But here we impose realistic allocation constraints: a 6-month delay between holdings reporting and fund investment, plus a bi-annual window for investments into, or withdrawals from, hedge funds. For example, an allocator who wishes to invest in a fund using 12/31/2013 data can only do so on 6/30/2014 and cannot redeem until 12/31/2014. These practical liquidity restrictions deepen the impact of hedge fund mean reversion.

Hedge Fund Selection Using Nominal Returns

The following chart tracks two simulated funds of hedge funds. One contains the top-performing 5% and the other the bottom-performing 5% of hedge fund U.S. equity long books. We use a 36-month trailing performance look-back; investments are made with a six-month delay (as above):

Chart of the cumulative returns of hedge fund portfolios constructed from funds with the highest 5% and the lowest 5% 36-month trailing returns

Performance of Portfolios of Hedge Funds Based on High and Low Historical Returns

Cumulative Return (%)

Annual Return (%)

High Historical Returns

99.54

6.74

Low Historical Returns

125.12

7.92

High – Low Returns

-25.57

-1.18

The chart reveals several regimes of hedge fund mean reversion: In a monotonically increasing market, such as 2005-2007, relative nominal performance persists; funds with the highest systematic risk outperform. When the regime changes, however, they under-perform. At the end of 2008, the top nominal performers are those taking the lowest systematic risk. In 2009, as the regime changes again, these funds under-perform.

Hedge Fund Selection Using Sharpe Ratios

The following chart tracks portfolios of funds with the top 5% and bottom 5% Sharpe ratios:

Chart of the cumulative returns of hedge fund portfolios constructed from funds with the highest 5% and the lowest 5% 36-month trailing Sharpe ratios

Performance of Portfolios of Hedge Funds Based on High and Low Historical Sharpe Ratios

Cumulative Return (%)

Annual Return (%)

High Historical Sharpe Ratios

115.31

7.48

Low Historical Sharpe Ratios

115.52

7.49

High – Low Sharpe Ratios

-0.20

-0.01

Since Sharpe ratio simply re-processes nominal returns, and only partially adjusts for systematic risk, it also fails when market regimes change. However, it is less costly. While Sharpe ratio may not be predictive under practical constraints of hedge fund investing, at least (unlike nominal returns) it does little damage.

Hedge Fund Selection Using Win/Loss Ratios

The following chart tracks portfolios of funds with the top 5% and the bottom 5% win/loss ratios, related to the batting average. These are examples of popular non-parametric approaches to skill evaluation:

Chart of the cumulative returns of hedge fund portfolios constructed from funds with the highest 5% and the lowest 5% 36-month trailing win/loss ratios

Performance of Portfolios of Hedge Funds Based on High and Low Historical Win/Loss Ratios

Cumulative Return (%)

Annual Return (%)

High Historical Win/Loss Ratios

112.41

7.35

Low Historical Win/Loss Ratios

136.86

8.41

High – Low Win/Loss Ratios

-24.45

-1.06

The win/loss ratio suffers from the same challenges as nominal returns: Win/loss ratio favors funds with the highest systematic risk in the bullish regimes and funds with the lowest systematic risk in the bearish regimes. As with nominal returns, this can be predictive while market trends continue. When trends change, the losses are especially severe under liquidity constraints.

Hedge Fund Selection Using αReturns

Systematic (factor) returns that make up the bulk of portfolio volatility are the primary source of mean reversion. Proper risk adjustment with a robust risk model controls for factor returns; it addresses mean reversion and identifies residual returns due to security selection.

AlphaBetaWorks’ measure of residual security selection performance is αReturn – outperformance relative to a replicating factor portfolio. αReturn is also the return a portfolio would have generated if markets had been flat.

The following chart tracks portfolios of funds with the top 5% and the bottom 5% αReturns. These portfolios have matching factor exposures:

Chart of the cumulative returns of hedge fund portfolios constructed from funds with the highest 5% and the lowest 5% 36-month trailing returns from security selection (αReturns)

Performance of Portfolios of Hedge Funds Based on High and Low Historical αReturns

Cumulative Return (%)

Annual Return (%)

High Historical αReturns

144.33

8.72

Low Historical αReturns

104.25

6.97

High – Low αReturns

40.08

1.75

Even with the same 6-month investment delay and bi-annual liquidity constraints, long portfolios of the top stock pickers outperformed long portfolios of the bottom stock pickers by 40% cumulatively over the past 10 years.

This outperformance has been consistent. Indeed, top stock pickers (high αReturn funds) have continued to do well in recent years. Security selection results of the industry’s top talent are strong. Widespread discussions of the difficulty of generating excess returns in 2014 reflect the sorry state of commonly used risk and skill analytics.

Conclusions

  • Due to hedge fund mean reversion, yesterday’s nominal winners tend to become tomorrow’s nominal losers.
  • Under typical hedge fund liquidity constraints, mean reversion is aggravated. Funds of top performing hedge funds under-perform.
  • Re-processing nominal returns does not eliminate mean reversion:
    • Funds with top and bottom Sharpe ratios perform similarly;
    • Funds with top win/loss ratios underperform funds with bottom win/loss ratios.
  • Risk-adjusted returns from security selection (stock picking) persist. Robust skill analytics, such as αReturn, identify strong future stock pickers.
The information herein is not represented or warranted to be accurate, correct, complete or timely.
Past performance is no guarantee of future results.
Copyright © 2012-2015, 
AlphaBetaWorks, a division of Alpha Beta Analytics, LLC. All rights reserved.
Content may not be republished without express written consent.

Hedge Fund Mean Reversion

Our earlier articles explored hedge fund survivor (survivorship) bias and large fund survivor bias. These artifacts can nearly double nominal returns and overstate security selection (stock picking) performance by 80%. Due to these biases, future performance of the largest funds disappoints. The survivors and the largest funds have excellent past nominal performance, yet it is not predictive of their future returns due to hedge fund mean reversion, a special case of reversion toward the mean. Here we explore this phenomenon and its mitigation.

We follow the approach of our earlier pieces that analyzed hedge funds’ long U.S. equity portfolios (HF Aggregate). This dataset spans the long portfolios of all U.S. hedge funds active over the past 15 years that are tractable using 13F filings.

Mean Reversion of Nominal Hedge Fund Returns

To illustrate the mean reversion of nominal hedge fund returns, we have assembled hedge fund portfolios with the highest and lowest trailing 36-month performance and track these groups over the subsequent 36 months. This covers the past 15 years and considers approximately 100 such group pairs.

If strong historical performance is predictive, we should see future (ex-post, realized) outperformance of the best historical performers relative to the worst. This would support the wisdom of chasing the largest funds or the top-performing gurus.

The following chart tracks past and future performance of each group. The average subsequent performance of the historically best- and worst-performing long U.S. equity hedge fund portfolios is practically identical and similar to the market return. There is some difference in the distributions, however: highest performers’ subsequent returns are skewed to the downside; lowest performers’ subsequent returns are skewed to the upside:

Chart of the past and future performance of hedge fund groups with high and low historical 36-month returns, assembled monthly over the past 15 years.

Hedge Fund Performance Persistence: High and Low Historical Returns

Prior 36 Months Return (%)

Subsequent 36 Months Return (%)

High Historical Returns

52.84

28.17

Low Historical Returns

-11.43

28.33

Thus, nominal historical returns are not predictive of future performance. We will try a few simple metrics of risk-adjusted performance next to see if they prove more effective.

Sharpe Ratio and Mean Reversion of Returns

Sharpe ratio is a popular measure of risk-adjusted performance that attempts to account for risk using return volatility. The following chart tracks past and future performance of portfolios with the highest and lowest historical Sharpe ratios. The average future performance of the best- and worst-performing portfolios begins to diverge, though we have not tested this difference for statistical significance:

Chart of the past and future performance of hedge fund groups with high and low historical 36-month Sharpe ratios, assembled monthly over the past 15 years.

Hedge Fund Performance Persistence: High and Low Historical Sharpe Ratios

Prior 36 Months Return (%)

Subsequent 36 Months Return (%)

High Historical Sharpe Ratios

43.65

28.38

Low Historical Sharpe Ratios

-8.34

25.66

Note that portfolios with the highest historical Sharpe ratios perform similarly to the best and worst nominal performers in the first chart. However, portfolios with the lowest historical Sharpe ratios underperform by 2.5%. Sharpe ratio does not appear to predict high future performance, yet it may help guard against poor results.

Win/Loss Ratio and Mean Reversion of Returns

Sharpe ratio and similar parametric approaches make strong assumptions, including normality of returns. We try a potentially more robust non-parametric measure of performance free of these assumptions – the win/loss ratio, closely related to the batting average. The following chart tracks past and future performance of portfolios with the highest and lowest historical win/loss ratios. The relative future performance of the two groups is similar:

Chart of the past and future performance of hedge fund groups with high and low historical 36-month win/loss ratios, assembled monthly over the past 15 years.

Hedge Fund Performance Persistence: High and Low Historical Win/Loss Ratios

Prior 36 Months Return (%)

Subsequent 36 Months Return (%)

High Historical Win/Loss Ratios

26.93

27.59

Low Historical Win/Loss Ratios

1.70

26.53

Win/loss ratio does not appear to improve on the predictive ability of Sharpe ratio. In fact, both groups slightly underperform the low performers from the first chart above.

Persistence of Hedge Fund Security Selection Returns

Nominal returns and simple metrics that rely on nominal returns both suffer from mean reversion, since systematic (factor) returns responsible for the bulk of portfolio volatility are themselves mean reverting. Proper risk adjustment with a robust risk model that eliminates systematic risk factors and purifies residuals addresses this problem.

AlphaBetaWorks’ measure of this residual security selection performance is αReturn – outperformance relative to a replicating factor portfolio. αReturn is also the return a portfolio would have generated if markets had been flat. The following chart tracks past and future security selection performance of portfolios with the highest and lowest historical αReturns. The future security selection performance of the best and worst stock pickers diverges by over 10%:

Charts of the past and future security selection (residual, αReturn) performance of hedge fund groups with high and low historical 36-month security selection (residua) returns, assembled monthly over the past 15 years.

Hedge Fund Security Selection Performance Persistence: High and Low Historical αReturns

Prior 36 Months αReturn (%)

Subsequent 36 Months αReturn (%)

High Historical αReturns

60.90

5.65

Low Historical αReturns

-35.66

-4.58

Security Selection and Persistent Nominal Outperformance

Strong security selection performance and strong αReturns can always be turned into nominal outperformance. In fact, a portfolio with positive αReturns can be hedged to outperform any broad benchmark. Nominal outperformance is convenient and easy to understand. These are the returns that investors “can eat.”

The following chart tracks past and future nominal performance of portfolios with the highest and lowest historical αReturns, hedged to match U.S. Equity Market’s risk (factor exposures). Hedging preserved security selection returns and compounded them with market performance: future performance of the two groups diverges by over 11%:

Charts of the past and future performance of hedge fund groups with high and low historical 36-month security selection (residua) returns, assembled monthly over the past 15 years and hedged to match U.S. Market.

Hedge Fund Performance Persistence: High and Low Historical αReturns

Prior 36 Months Return (%)

Subsequent 36 Months Return (%)

High Historical αReturns

81.70

32.50

Low Historical αReturns

-28.93

21.41

Note that, similarly to Sharpe ratio, αReturn is most effective in identifying future under-performers.

Thus, with predictive analytics and a robust model, investors can not only identify persistently strong stock pickets but also construct portfolios with predictably strong nominal performance.

Conclusions

  • Due to hedge fund mean reversion, future performance of the best and worst nominal performers of the past is similar.
  • Re-processing nominal returns does not eliminate mean reversion. However, Sharpe ratio begins to identify future under-performers.
  • Risk-adjusted returns from security selection (stock picking) persist. A robust risk model can isolate these returns and identify strong future stock pickers.
  • Hedging can turn persistent security selection returns into outperformance relative to any benchmark:
    • A hedged portfolio of the best stock pickers persistently outperforms.
    • A hedged portfolio of the worst stock pickers persistently underperforms.
The information herein is not represented or warranted to be accurate, correct, complete or timely.
Past performance is no guarantee of future results.
Copyright © 2012-2015, 
AlphaBetaWorks, a division of Alpha Beta Analytics, LLC. All rights reserved.
Content may not be republished without express written consent.