Who’s Been Naughty or Nice
The five top hedge fund long stock pickers with long U.S. equity AUM over $3 billion produced 10.7% average annual alpha in the past three years (through October 2015). The five bottom hedge fund long U.S. equity stock pickers had negative alpha averaging -6.5% during the same period. Both lists contain well-known and well-followed managers with a combined long U.S. equity AUM over $100 billion. These rankings overcome the flaws of simplistic performance measures by using a persistent and hence predictive metric of
Ranking Hedge Fund Long Stock Pickers
Fund rankings usually focus on absolute or relative nominal returns. Reliance on such simplistic measures, frequently mislabeled as “alpha,” is hazardous for allocators and consultants and typically leads to picking yesterday’s winners, who tend to become tomorrow’s losers: high-beta funds in bull markets and low-beta funds in bear markets. To overcome these flaws, AlphaBetaWorks calculates returns independent of risks taken – αReturn – the performance a fund would have generated if markets had been flat. A true measure of security selection skill, αReturn is strongly predictive of future stock picking performance.
To the extent a fund derives significant returns from long equity holdings, our approach helps allocators and consultants avoid losses and unhappy clients. Furthermore, absent this approach, mindless followers of famous funds are headed for disappointment.
Top and Bottom Five Hedge Funds by Stock Picking Return
A comparison of nominal long hedge fund portfolio performance to market indices is misleading, since a portfolio may be taking dramatically different risks. It follows that equating outperformance relative to S&P500 with alpha is wrong. Under this simplistic approach, leveraged market ETFs generate positive alpha in up years and negative alpha in down years – a flawed result and a dangerous criterion for investment decisions.
Adjusting returns for the factor (systematic) risks taken to generate them is required to identify stock picking return and, correspondingly, stock picking skill.
Below we list the top and bottom long U.S. equity stock pickers among the hedge funds that can be analyzed using regulatory filings:
| Name | αβReturn | αβScore | αReturn | αScore | βReturn | βScore |
| Harbinger Capital Partners LLC | 15.45 | 95.04 | 15.38 | 95.4 | -0.01 | 49.92 |
| Icahn Associates Holdings LLC | 9.09 | 80.19 | 11.11 | 85.92 | -2.01 | 23 |
| PAR Capital Management, Inc. | 8.32 | 95.56 | 10.93 | 98.85 | -2.69 | 12.48 |
| Longview Asset Management LLC | 14.09 | 97.02 | 9.40 | 87.53 | 4.49 | 98.83 |
| ValueAct Capital Management LP | 3.29 | 74.01 | 6.73 | 90.06 | -3.52 | 3.9 |
Hedge Funds with the Highest Long U.S. Equity Stock Picking Returns and > $3B AUM, 3-yr CAGR
| Name | αβReturn | αβScore | αReturn | αScore | βReturn | βScore |
| Bridgewater Associates LP | -9.05 | 1.86 | -8.15 | 4.28 | -0.99 | 28.03 |
| Omega Advisors, Inc. | -8.29 | 0.22 | -7.19 | 1.25 | -1.14 | 16.06 |
| Pershing Square Capital Management LP | -5.36 | 25.15 | -5.83 | 25.01 | 0.28 | 56.73 |
| Axiom International Investors LLC | -2.62 | 16.93 | -5.83 | 0.71 | 3.17 | 94.05 |
| Paulson & Co., Inc. | -5.05 | 14.65 | -5.63 | 10.72 | 0.57 | 61.94 |
Hedge Funds with the Lowest Long U.S. Equity Stock Picking Returns and > $3B AUM, 3-yr CAGR
There are familiar fund names on both lists, with a combined $112 billion in long AUM. While these funds’ reported returns will differ from those above due principally to factor (systematic) sources (market / sector betas, et cetera), international holdings, fixed income positions, derivatives, and shorts, αReturn is a clear and predictive measure of stock picking skill reflecting returns in excess of passive risks taken. Unlike nominal returns, Sharpe Ratios, and other returns-based measures (which revert), αReturn reflects what investors pay fees for: performance independent of risks taken. What’s more, both positive and negative αReturns tend to persist.
The tables above also show several related skill metrics. For example, βReturn is return from market timing, and αβReturn is total active return combining security selection and market timing. The Scores above, such as αScore, quantify return consistency using a scale of 0 to 100: 0 corresponds to consistently negative returns; 100 to consistently positive.
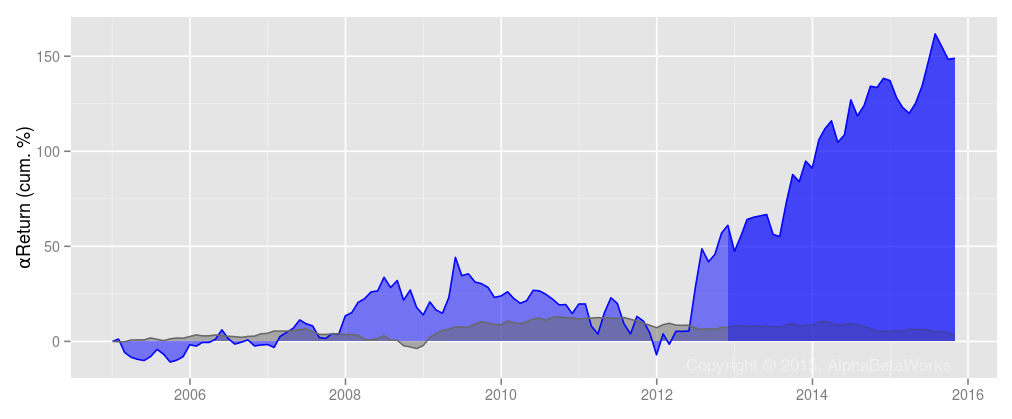
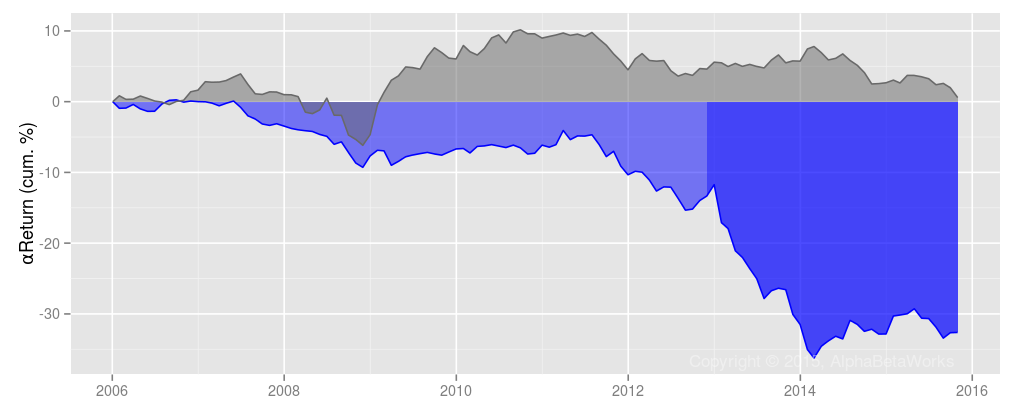
The following charts show cumulative αReturns of the best and worst 3-year long U.S. equity stock pickers from the above group. Portfolio αReturns in blue compare to the peer group of all hedge funds’ long U.S. equity portfolio in gray:

Harbinger Capital Partners LLC: Risk-adjusted Return from Security Selection (αReturn), Long U.S. Equity Portfolio

Bridgewater Associates LP: Risk-adjusted Return from Security Selection (αReturn), Long U.S. Equity Portfolio
Conclusions
A comparison of nominal long hedge fund portfolio performance to market indices is misleading and can lead to allocators selecting high-return funds that are, in truth, merely high risk. Since systematic fund risk varies, the assumption that outperformance relative to S&P500 is alpha is wrong. In a rising market, allocators and consultants who make these mistakes are likely to allocate to the most aggressive managers, rather than the most skilled. In a flat or declining market, these mistakes are revealed, leading to losses, pain, and embarrassment.
The solution is using skill analytics that discriminate among the different levels of systematic risk, like AlphaBetaWorks’ αReturn (among others), which reveals managers with investment skill likely to generate future alpha.


