Tag Archives: closet indexing

Mutual Fund Closet Indexing: 2015 Update

An index fund aims to track the market or its segment, with low fees. An actively managed fund aims to do better, but with higher fees. So in order to earn its fees, an active mutual fund must take risks. Much of the industry does not even try. Mutual fund closet indexing is the practice of charging active fees for passive management. Over a third of active mutual funds and half of active mutual fund capital appear to be investing passively: Funds tend to become less active as they accumulate assets. Skilled managers who were active in the past may be closet indexing today. Simply by identifying closet indexers, investors can eliminate half of their active management fees, increase allocation to skilled active managers, and improve performance. 

Closet Indexing Defined

A common metric of fund activity is Active Share — the percentage difference between portfolio and benchmark holdings. This measure is flawed: If fund with S&P 500 benchmark buys SPXL (S&P 500 Bull 3x ETF), this passive position increases Active Share. If a fund with S&P 500 benchmark indexes Russell 2000, this passive strategy has 100% Active Share. Indeed, recent findings indicate that high Active Share funds that outperform merely track higher-risk benchmarks.

Factor-based analysis of positions can eliminate the above deficiencies. We applied the AlphaBetaWorks Statistical Equity Risk Model to funds’ holdings over time and estimated each fund’s unique factor benchmark. These passive factor benchmarks captured the representative systematic risks of each fund. We then estimated each fund’s past and future tracking errors relative to their factor benchmarks and identified those funds that are unlikely to earn their fees in the future given their current active risk. We also quantified mutual fund closet indexing costs for a typical investor.

This study covers 10-year portfolio history of approximately three thousand U.S. equity mutual funds that are analyzable from regulatory filings. It updates our earlier studies of mutual fund and closet indexing with 2015 data. Due to the larger fund dataset and higher recent market volatility, the mutual fund industry appears slightly more active now than in the 2014 study.

Information Ratio – the Measure of Fund Activity

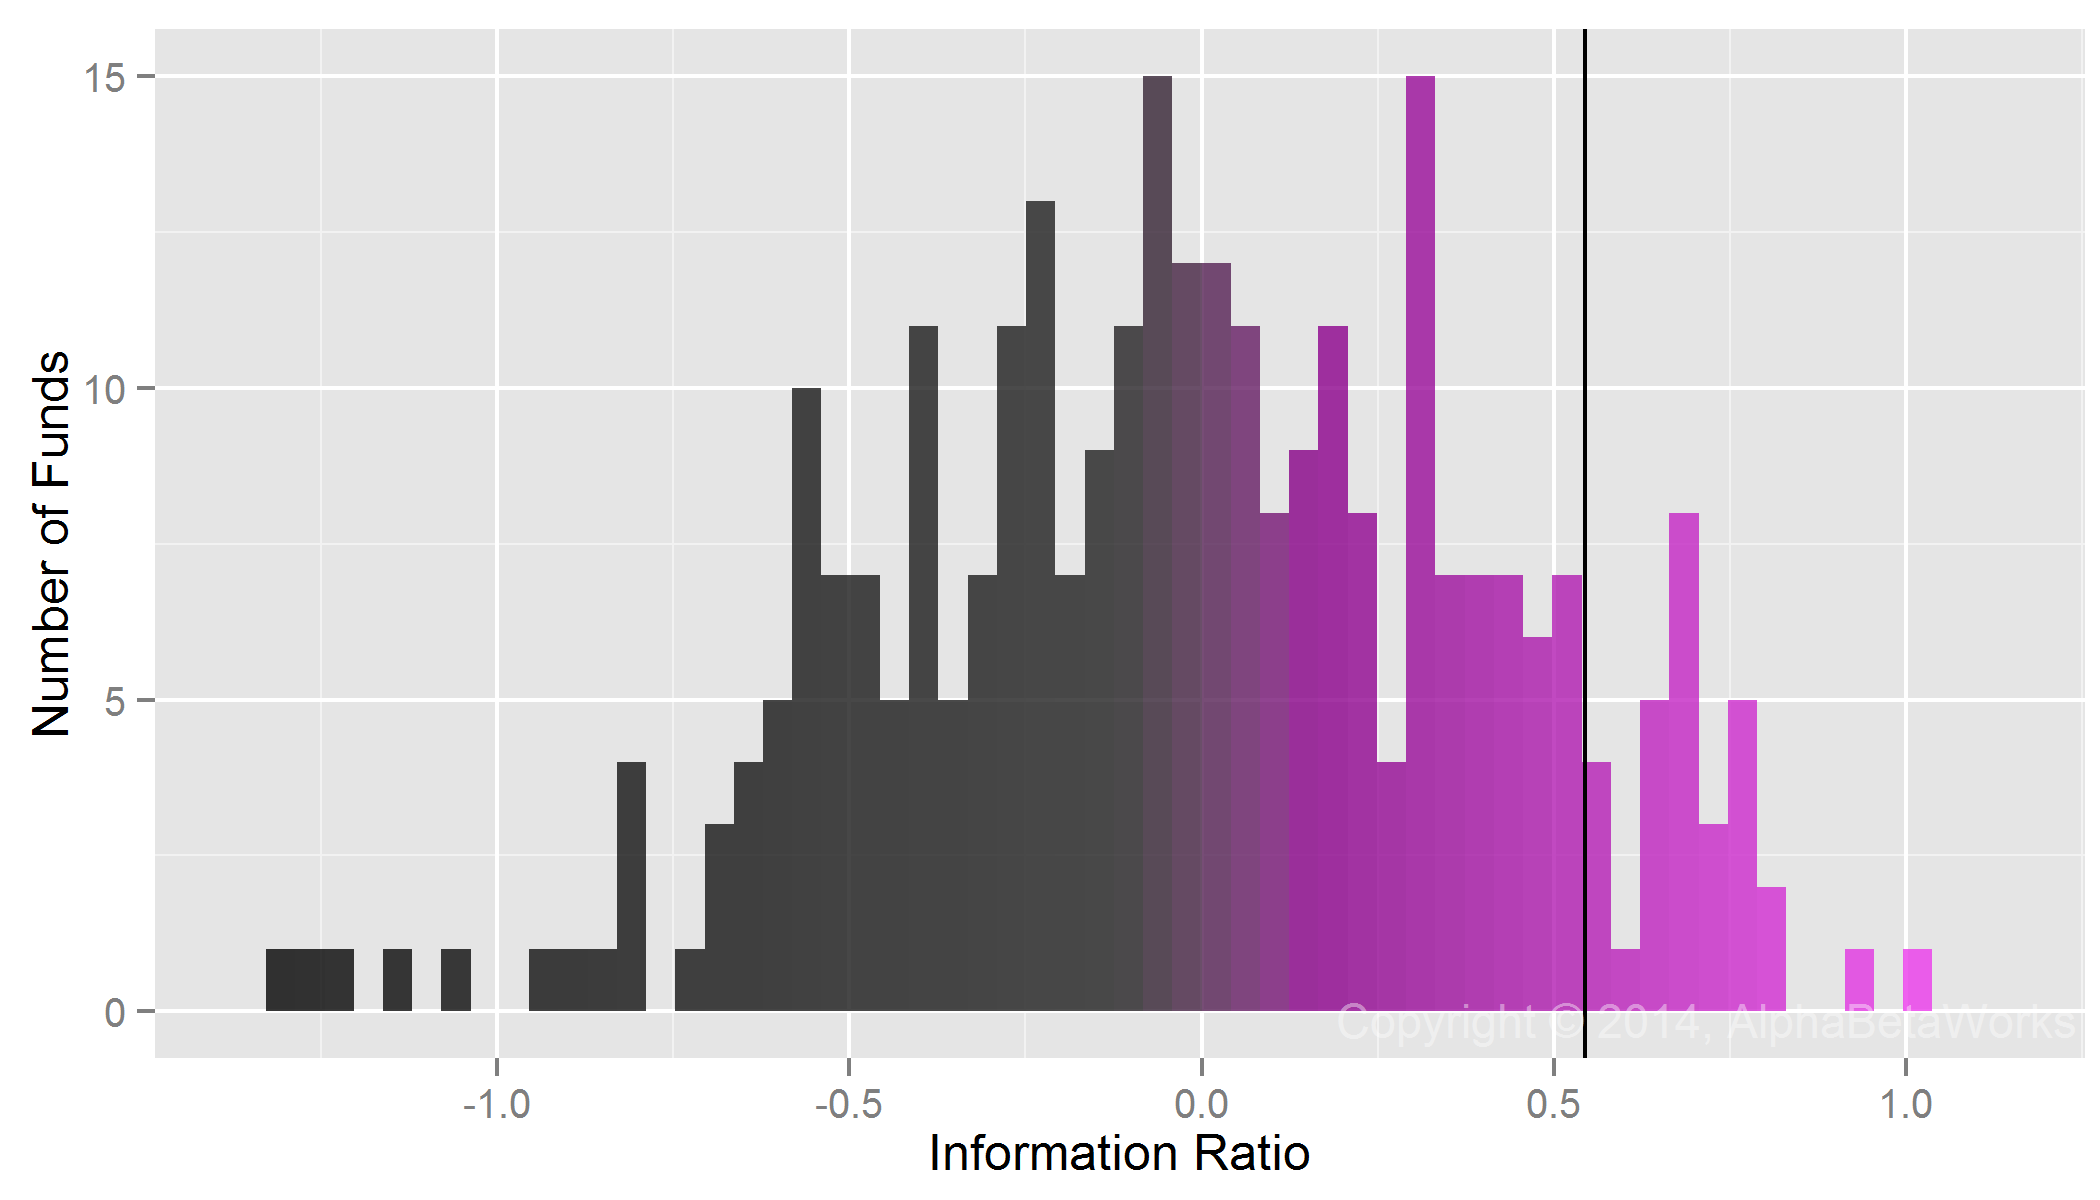
The Information Ratio (IR) is the measure of active return a fund generates relative to its active risk, or tracking error. We estimated each fund’s IR relative to its factor benchmark. The top 10% of U.S. equity mutual funds achieved IRs above 0.36:

Chart of the historical information ratio for active returns of U.S. mutual funds’ equity portfolios

U.S. Equity Mutual Funds: Historical Information Ratio Distribution

 Min. 1st Qu.  Median    Mean 3rd Qu.    Max.
-5.34   -0.49   -0.22   -0.23    0.06    3.26

If a fund outperforms 90% of the group and achieves 0.36 IR, then it needs tracking error above 1% / 0.36 = 2.79% to generate active return above 1%. So assuming a typical 1% fee, if a fund were able to consistently achieve IR in the 90th percentile, it would need annual tracking error above 2.79% to generate net active return. As we show, much of the industry is far less active. In fact, half of U.S. “active” equity mutual fund assets do not even appear to be trying to earn a 1% active management fee.

Historical Mutual Fund Closet Indexing

Tracking error comes from active exposures: systematic (factor) and idiosyncratic (stock-specific) bets. The AlphaBetaWorks Statistical Equity Risk Model used to estimate these exposures is highly accurate and predictive for a typical equity mutual fund.

Over 28% (746) of the funds have taken too little risk in the past. Even if they had exceeded the performance of 90% of their peers each year, they would still have failed to earn a typical fee. These funds have not even appeared to try to earn their fees:

Chart of the historical mutual fund closet indexing as measured by the tracking error of active returns of U.S. mutual funds’ equity portfolios

U.S. Equity Mutual Funds: Historical Tracking Error Distribution

Min. 1st Qu.  Median    Mean 3rd Qu.    Max.
0.35    2.63    3.95    4.62    5.90   26.60

Current Mutual Fund Closet Indexing

Funds tend to become less active as they grow. To control for this, we estimated current tracking errors of all funds relative to their factor benchmarks.

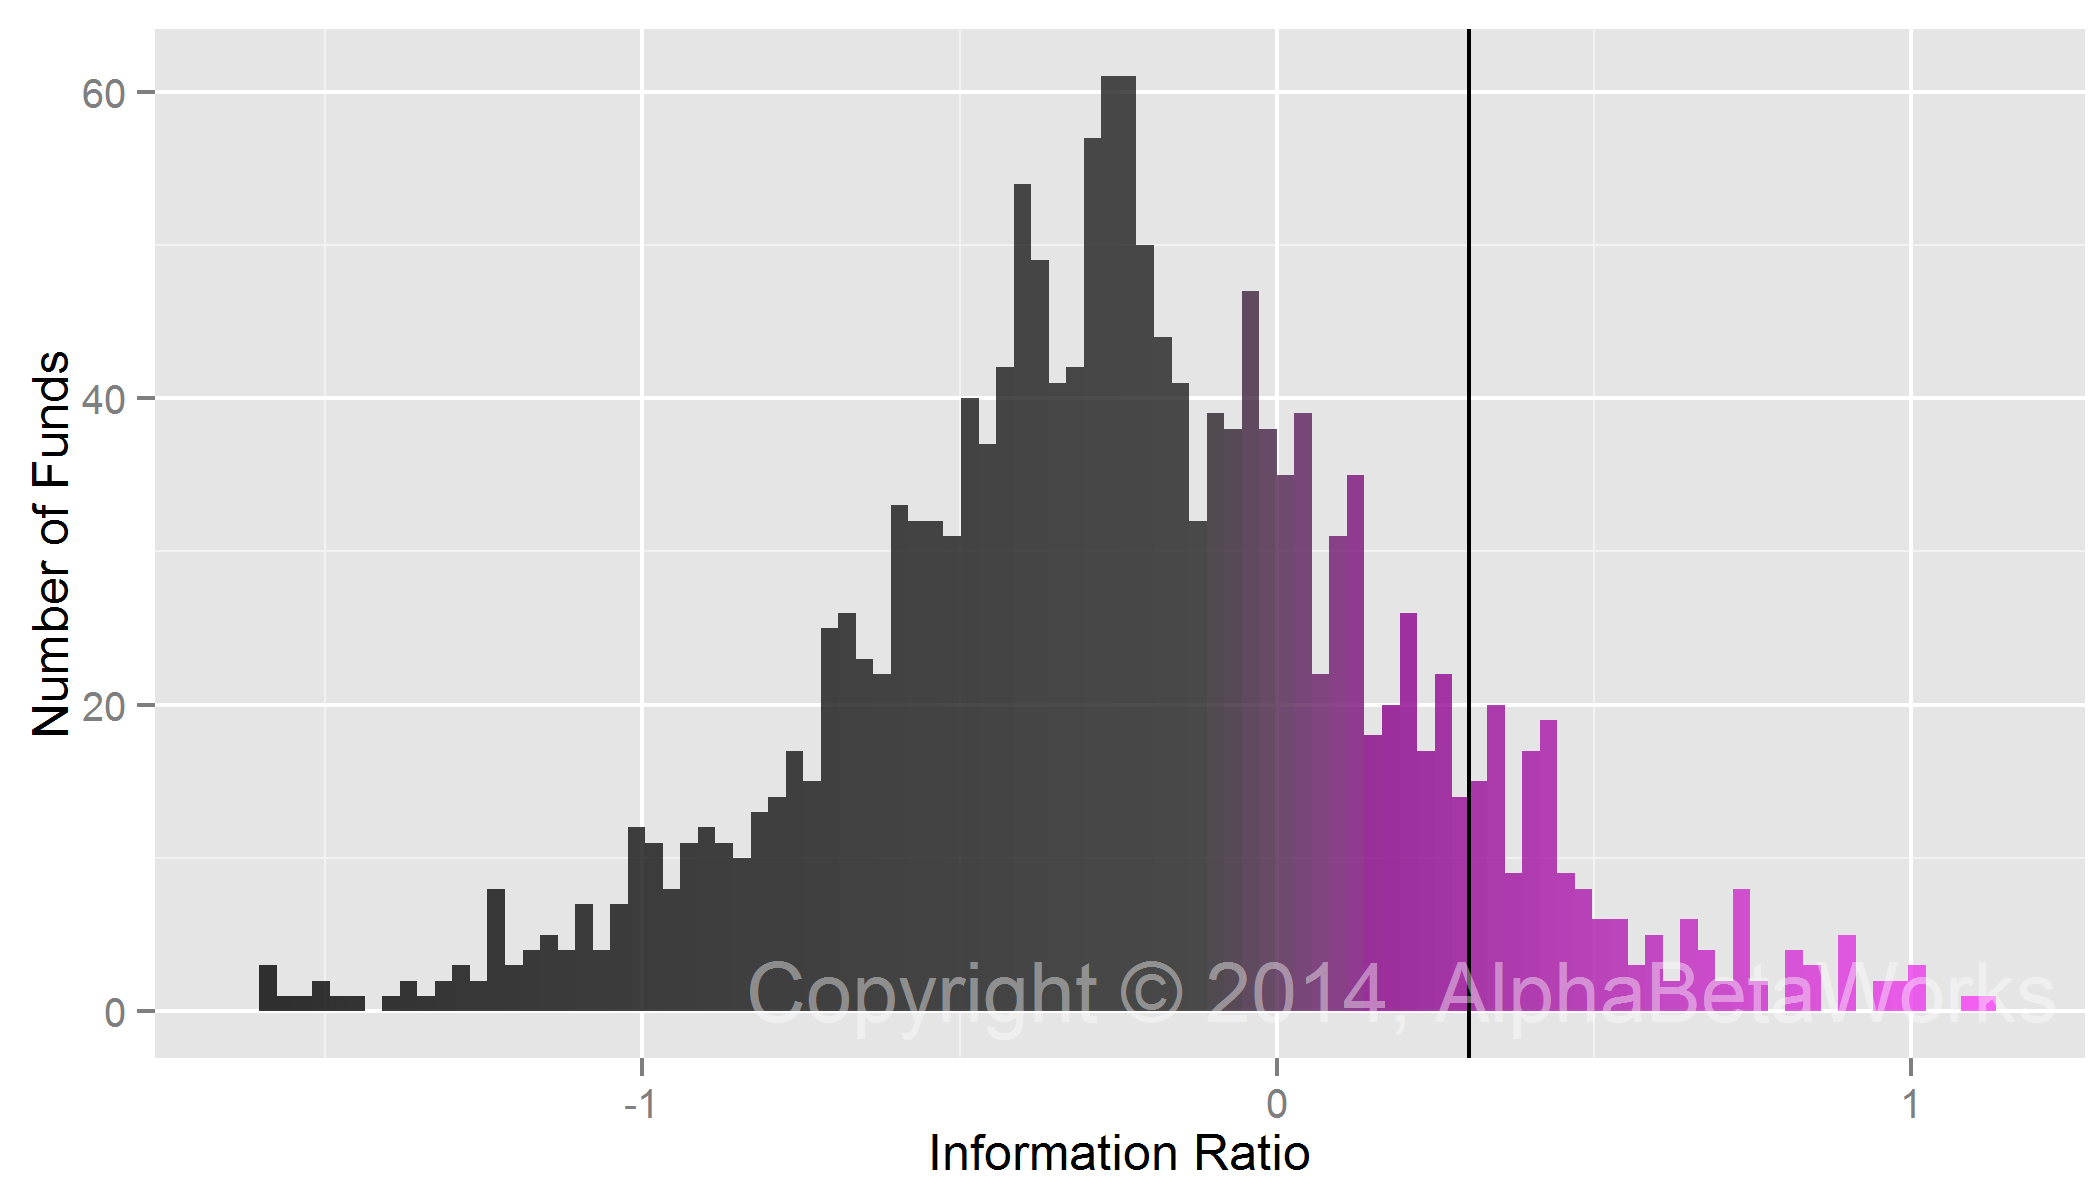
Over a third (961) of the funds are taking too little risk currently. Even if they exceed the performance of 90% of their peers each year, they will still fail to merit a typical fee. These funds are not even appearing to try to earn their fees:

Chart of the predicted future mutual fund closet indexing as measured by the tracking error of active returns of U.S. mutual funds’ equity portfolios

U.S. Equity Mutual Funds: Predicted Future Tracking Error Distribution

Min. 1st Qu.  Median    Mean 3rd Qu.    Max.
0.92    2.45    3.20    3.52    4.29   20.90

Capital-Weighted Mutual Fund Closet Indexing

Since funds become less active as they grow, larger mutual funds are more likely to closet index. The 36% of mutual funds that have estimated future tracking errors below 2.79% represent half of the assets ($2.25 trillion out of the $4.57 trillion total in our study). Hence, half of active equity mutual fund capital is unlikely to earn a typical free, even when its managers are highly skilled:

Chart of the capital-weighted predicted future mutual fund closet indexing as measured by the tracking error of active returns of U.S. mutual funds’ equity portfolios

U.S. Equity Mutual Funds: Capital-Weighted Predicted Future Tracking Error Distribution

Min. 1st Qu.  Mean 3rd Qu.    Max.
0.92    2.10  2.79    3.72   20.90

Even the most skilled managers will struggle to generate IRs in the 90th percentile each and every year. Therefore, portfolios of large funds, when built without robust analysis of manager activity, may be doomed to negative net active returns. Plenty of closet indexers charge more than the 1% fee we assume, and plenty of investors will lose even more.

A Map of Mutual Fund Closet Indexing

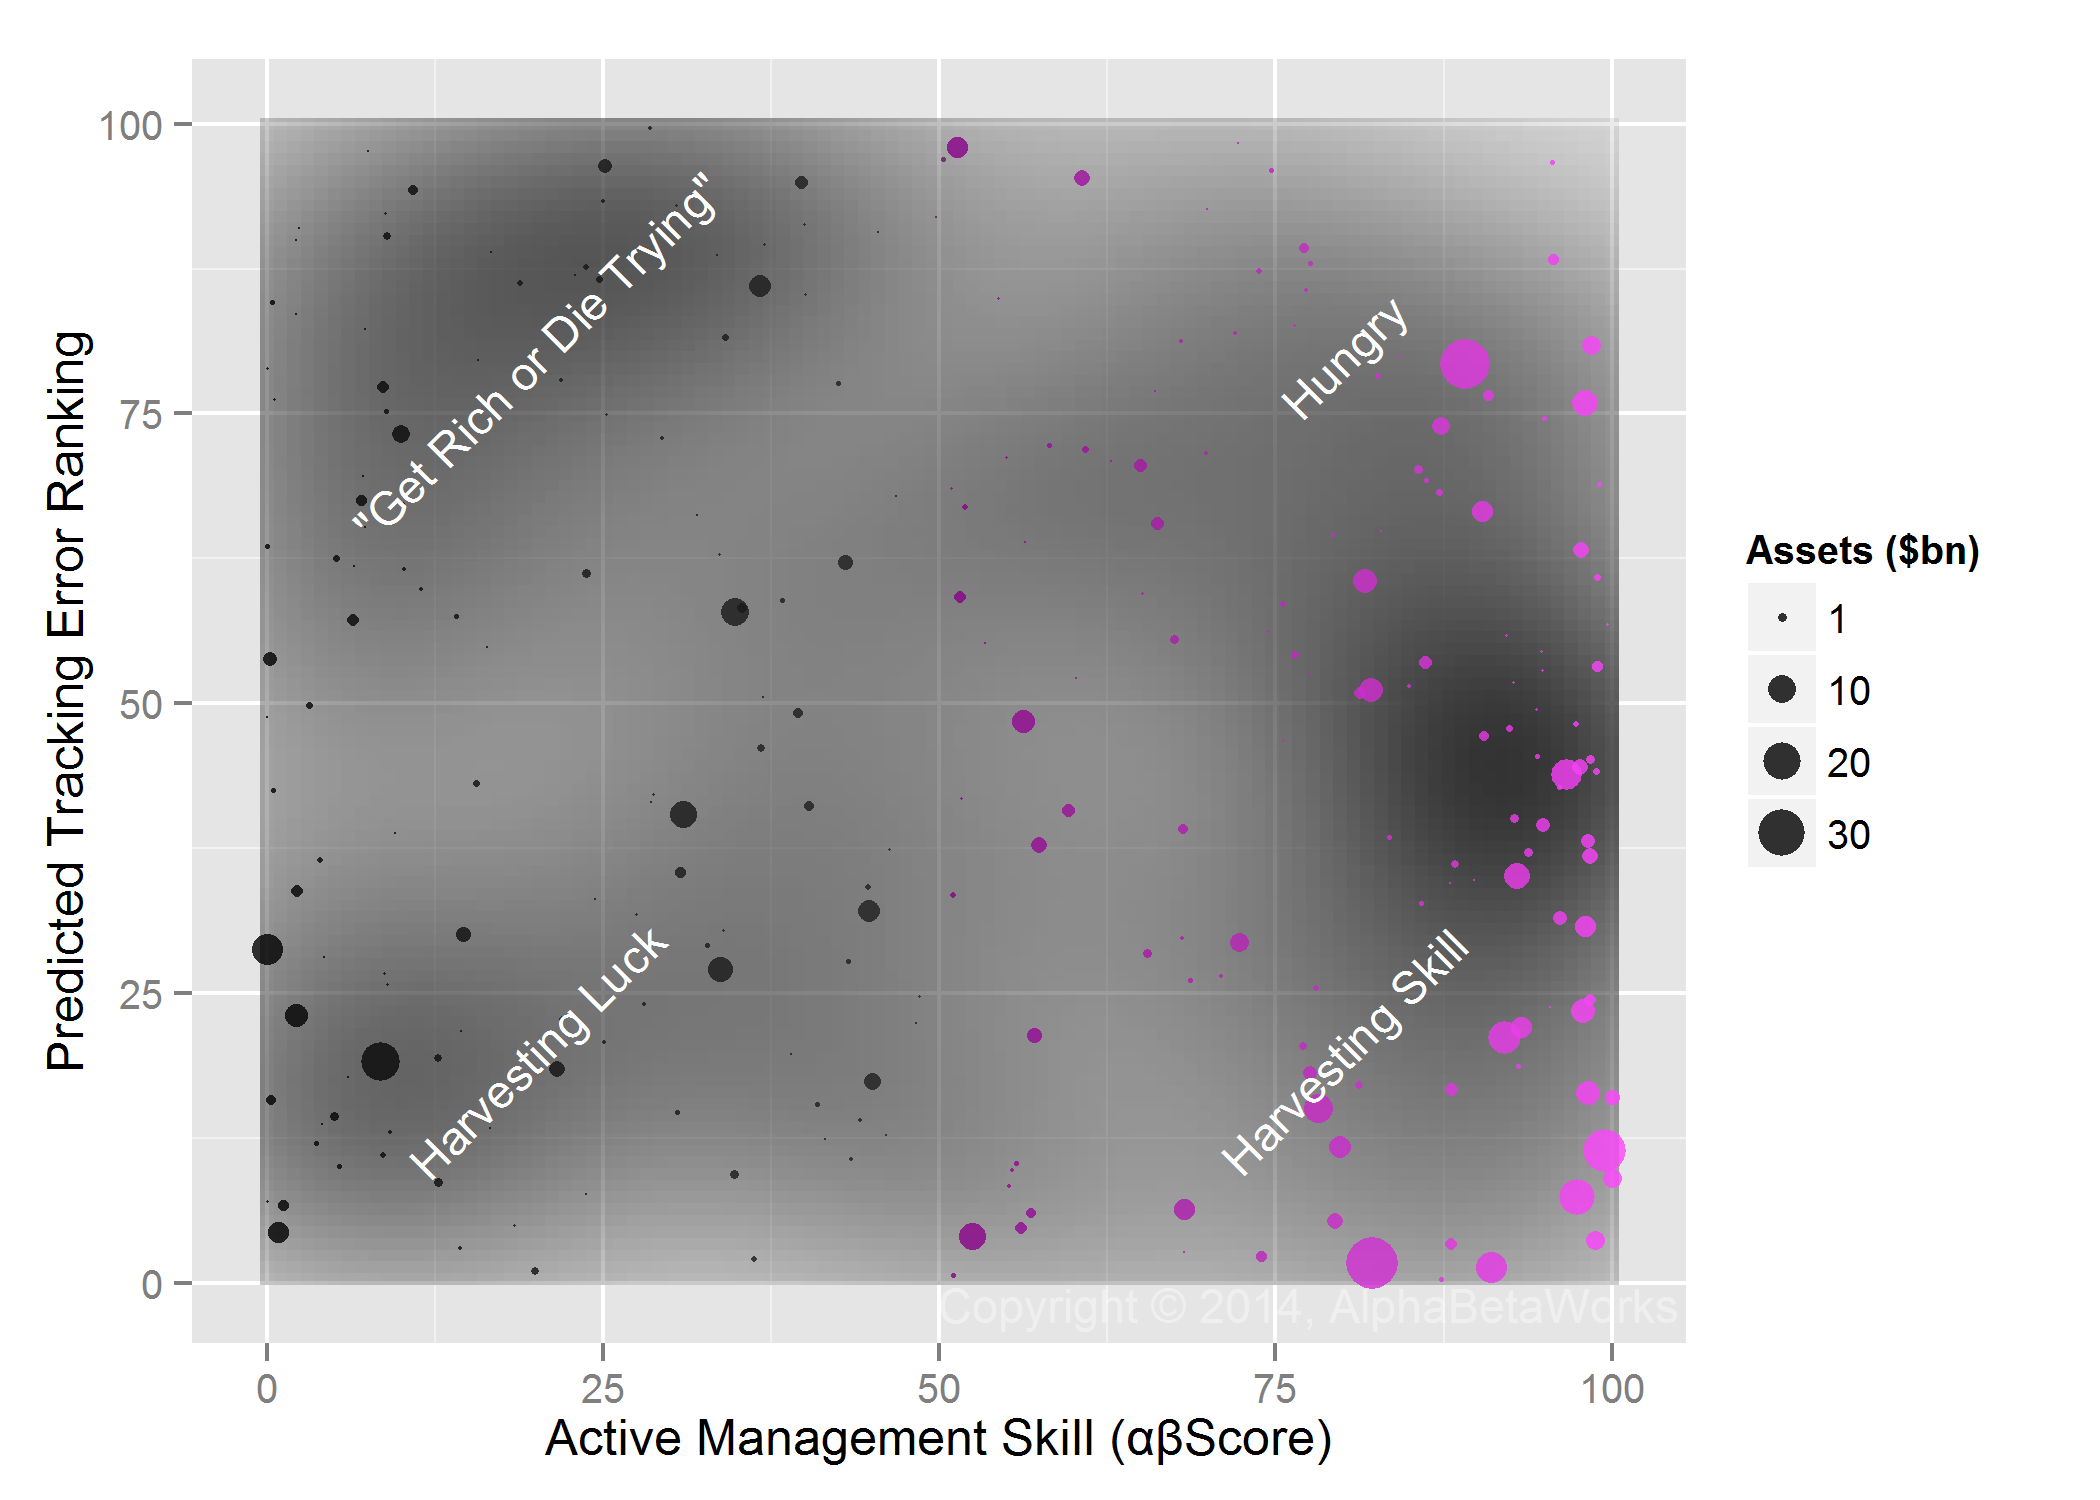
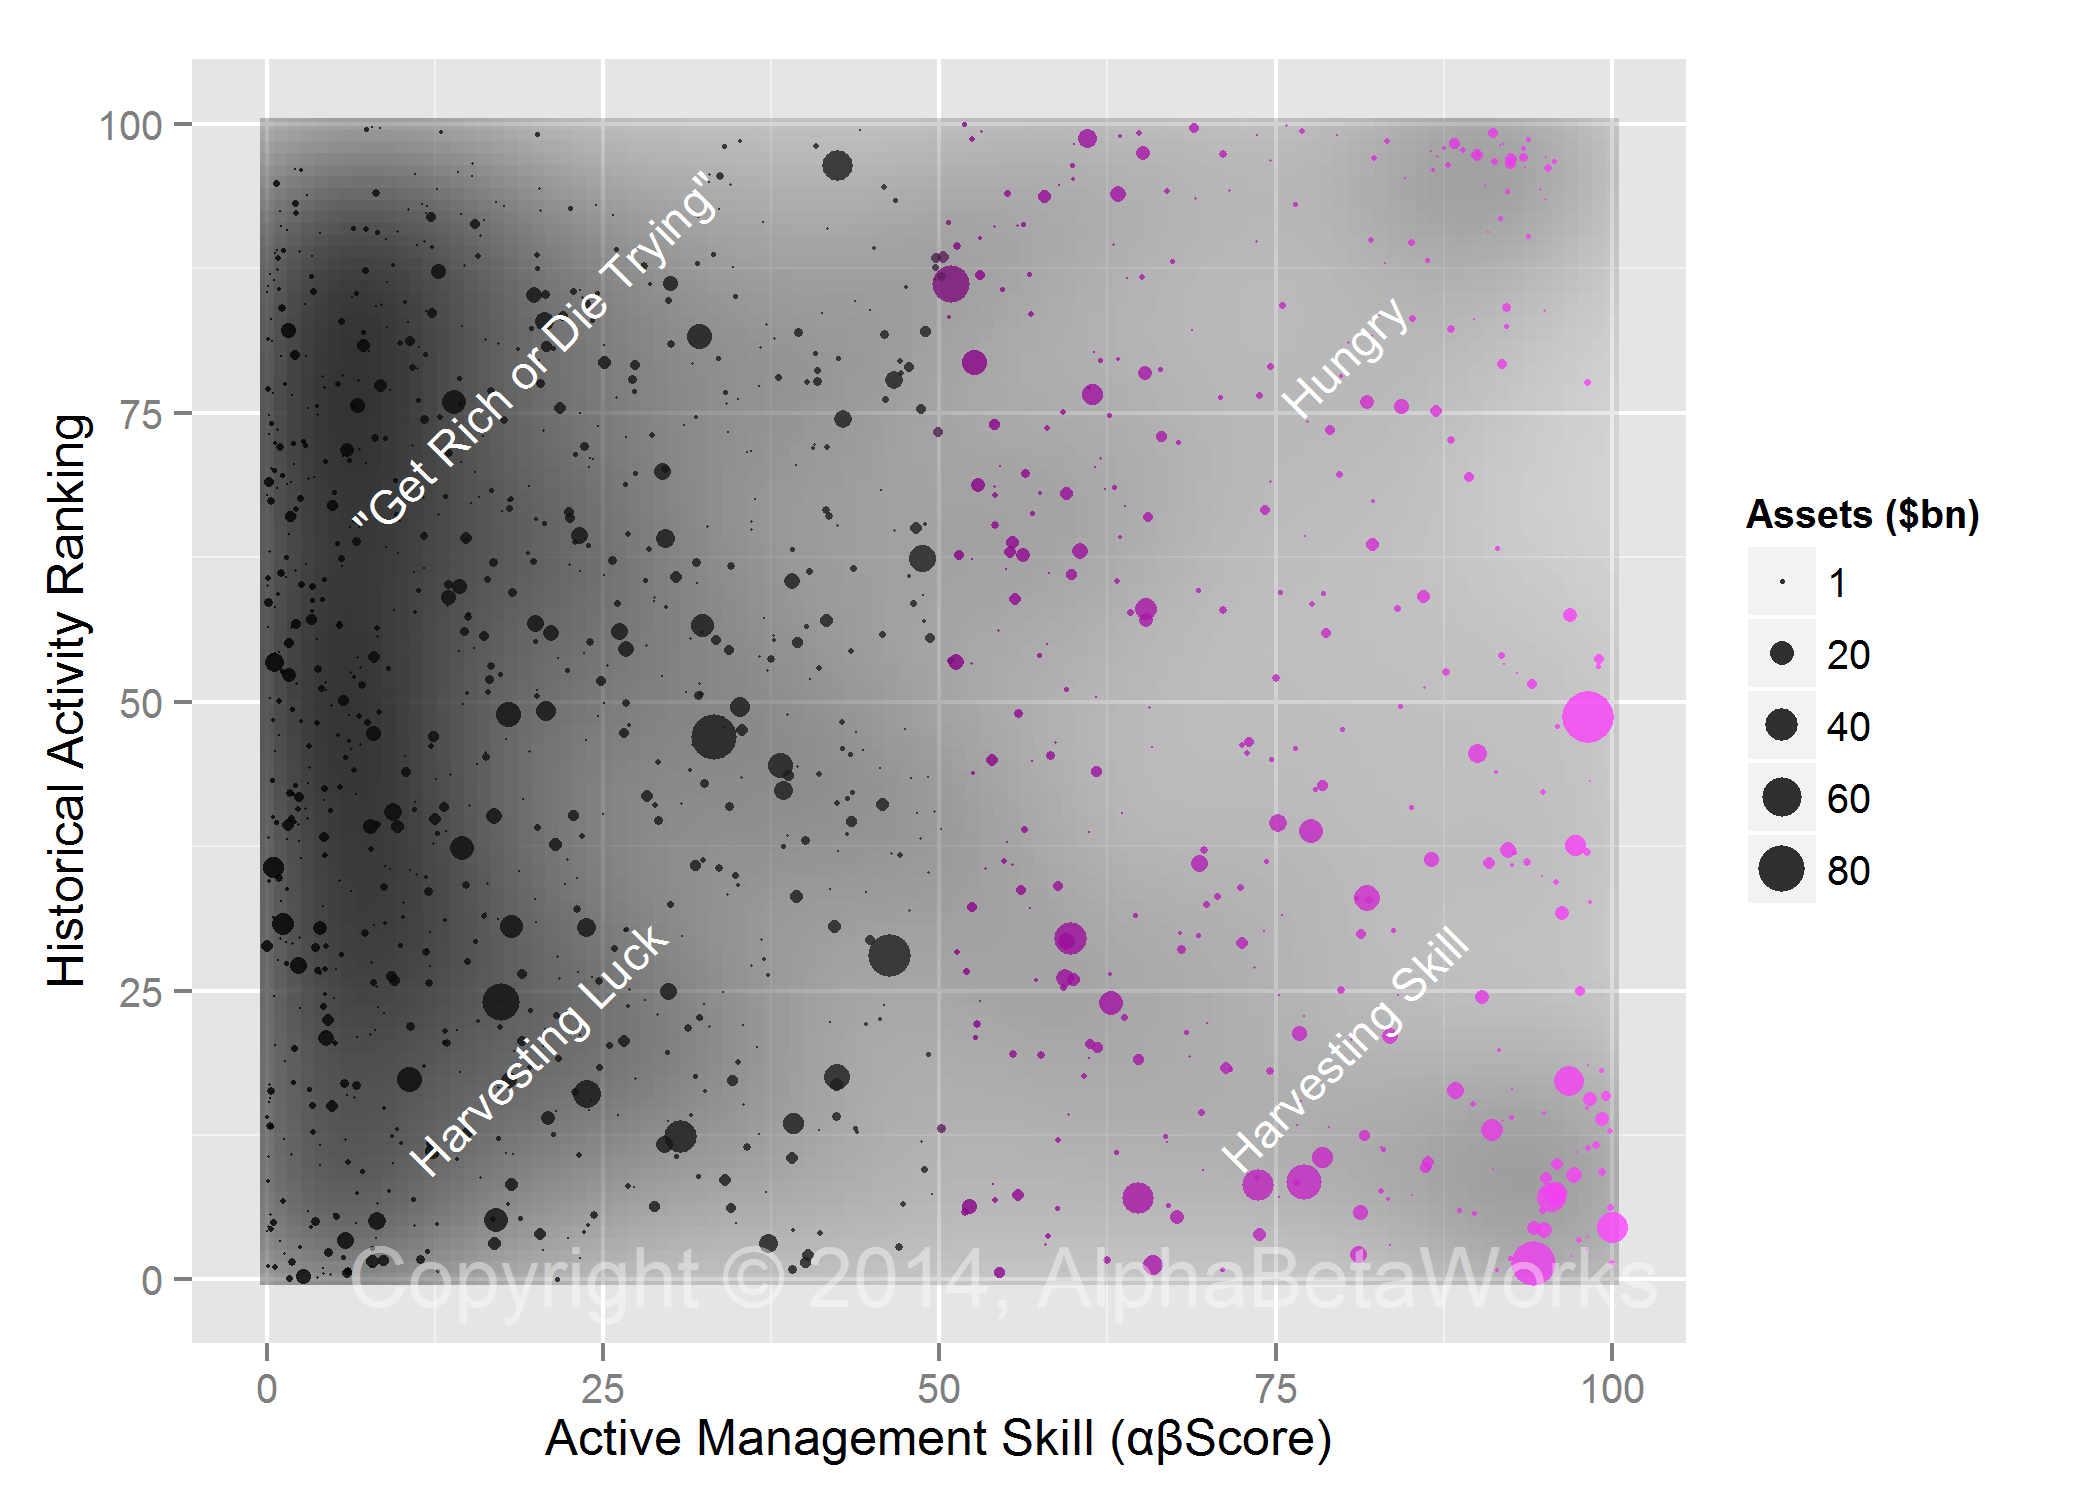
As a manager accumulates assets, fee harvesting becomes more attractive than risk taking. Managers’ utility curves may thus explain large funds’ passivity. The following map of U.S. mutual fund active management skill (defined by the αβScore of active return consistency) and current activity illustrates that large skilled funds are generally less active. Large skilled funds, represented by large purple circles on the right, cluster towards the bottom area of low tracking error:

Chart of the historical active management skill as represented by the consistency of active returns and predicted future tracking error of active returns of U.S. mutual funds’ equity portfolios

U.S. Equity Mutual Funds: Historical Active Management Skill and Predicted Future Activity

In spite of the widespread mutual fund closet indexing, numerous skilled and active funds remain. Many are young and, with a low asset base, have a long way to grow before fee harvesting becomes seductive for their managers.

Conclusions

  • Over a third of U.S. equity mutual funds are currently so passive that, even if they exceed the information ratios of 90% of their peers, they will still fail to merit a typical fee.
  • Half of U.S. equity mutual fund capital will fail to merit a typical fee, even when its managers are highly skilled.
  • As skilled managers accumulate assets, they are more likely to closet index.
  • A typical investor can re-allocate half of their active equity mutual fund capital to cheap passive vehicles or truly active skilled managers to improve performance.
The information herein is not represented or warranted to be accurate, correct, complete or timely.
Past performance is no guarantee of future results.
Copyright © 2012-2015, 
AlphaBetaWorks, a division of Alpha Beta Analytics, LLC. All rights reserved.
Content may not be republished without express written consent.

Hedge Fund Closet Indexing: 2015 Update

A fund must take active risk to generate active returns in excess of fees. However, some managers charge active fees but manage their funds passively. Managers also tend to become less active as they accumulate assets. This problem of hedge fund closet indexing is widespread. Over a third of capital invested in U.S. hedge funds’ long equity portfolios is too passive to warrant the common 1.5/15% fee structure, even if its managers are highly skilled. Investors can replace closet indexers with cheap passive vehicles or with truly active skilled managers and improve performance.

Hedge Fund Closet Indexing Background

This article updates our earlier pieces on mutual fund and hedge fund closet indexing with mid-2015 data. We examine current and historical long equity portfolios of approximately 500 U.S. hedge funds that are analyzable from regulatory filings and identify those that are unlikely to earn their fees in the future given their current active risk. We then quantify the cost of hedge fund closet indexing for a typical investor.

Recall from our earlier discussion that Active Share is a brittle metric of fund activity: If a fund buys a position in an index ETF, this passive position may increase Active Share while making the fund less active. If a fund with S&P 500 benchmark simply indexes Russell 2000, this passive fund will have 100% Active Share. These examples are consistent with recent findings that high Active Share funds appear to outperform merely due to miss-specified benchmarks. Our factor-based approach identifies the unique passive factor benchmark for each fund and is free from these deficiencies.

Information Ratio – the Measure of Active Risk Required to Earn a Fee

The Information Ratio (IR) is a measure of active return relative to active risk (tracking error). The best-performing 10% of U.S. hedge funds’ long portfolios achieve IRs above 0.59 relative to their passive factor benchmarks:

Chart of the historical information ratio for active returns of U.S. hedge funds’ long equity portfolios

U.S. Hedge Fund Long Equity Portfolios: Historical Information Ratio Distribution

 Min. 1st Qu.  Median    Mean 3rd Qu.    Max.
-2.58   -0.34   -0.02   -0.04    0.28    2.17

If a fund’s long portfolio exceeds the performance of 90% of the peers and achieves a 0.59 IR, then it needs a tracking error above 1.00% / 0.59 = 1.69% to generate active return above 1%.

Let’s assume that hedge funds’ long equity portfolios are burdened with 1.5% management fee and 15% incentive allocation. Further assuming a 7% market return, the mean fee is 2.55%. If all funds were able to achieve IRs in the 90th percentile, they would need annual tracking error above 2.55% / 0.59 = 4.32% to earn the 2.55% estimated mean fee and a positive net active return. We show below that a significant fraction of the industry takes too little active risk to achieve this tracking error. In fact, much of the industry may not even be trying to earn its fees.

Historical Hedge Fund Closet Indexing

Tracking error comes from funds’ active exposures: systematic (factor) and idiosyncratic (stock-specific) bets. We applied the AlphaBetaWorks Statistical Equity Risk Model to funds’ historical holdings to estimate their unique factor benchmarks. These are passive factor portfolios that capture the representative systematic risks of each fund. We then estimated past and future tracking errors of each fund relative to these benchmarks.

Over 13% (67) of the funds have taken so little risk that, even if they had exceeded the performance of 90% of their peers each year, they would still have failed to earn a typical fee. In other words, these funds have not even appeared to try earning their fees:

Chart of the historical tracking error of active returns of U.S. hedge funds’ long equity portfolios

U.S. Hedge Fund Long Portfolios: Historical Tracking Error Distribution

Min. 1st Qu.  Median    Mean 3rd Qu.    Max.
0.43    6.04   10.04   15.17   19.43  201.00

Estimated Future Hedge Fund Closet Indexing

Fund activity changes over time as managers accumulate assets. Many funds are more passive today than they have been historically. To control for this, we estimated current tracking errors.

Approximately a fifth (88) of the funds are currently taking so little risk that, even if they were to exceed the performance of 90% of their peers each year, they would still fail to merit a typical fee.  In other words, these funds are not even appearing to try earning their fees:

Chart of the predicted future tracking error of active returns of U.S. hedge funds’ long equity portfolios

U.S. Hedge Fund Long Portfolios: Predicted Future Tracking Error Distribution

Min. 1st Qu.  Median    Mean 3rd Qu.    Max.
0.76    4.96    7.67   11.01   12.48  148.30

Capital-Weighted Hedge Fund Closet Indexing

Larger hedge funds are more likely to engage in closet indexing. While approximately 20% of hedge funds surveyed have estimated future tracking errors below 4.30%, they represent a third of the assets ($240 billion out of the $720 billion total in our sample). Therefore, a third of hedge fund long equity capital is unlikely to exceed 4.32% tracking error and earn a typical fee, even when its managers are highly skilled:

Chart of the capital-weighted predicted future tracking error of active returns of U.S. hedge funds’ long equity portfolios

U.S. Hedge Fund Long Portfolios: Capital-Weighted Predicted Future Tracking Error Distribution

Min. 1st Qu.  Mean 3rd Qu.    Max.
0.76    3.70  5.49   8.21   116.47

The assumption that all funds will generate higher IRs than 90% of their peers have historically is unrealistic. Hence, a portfolio of large funds built without a robust analysis of hedge fund closet indexing may be doomed to generate negative net active returns, irrespective of the managers’ skills. The 2.55% fee cited here is the estimated mean. Plenty of closet indexers charge more on their long equity portfolios, and plenty of investors who remain with them stand to lose even more.

While there is less closet indexing among hedge funds than among mutual funds, the fees that hedge funds charge and the expectations they set are significantly higher.  When practiced by hedge funds, closet indexing is all the more egregious.

A Map of Hedge Fund Closet Indexing

The evolution of managers’ utility curves may explain their reluctance to take risk. As a manager accumulates assets, fee harvesting becomes increasingly attractive. The following map of U.S. hedge fund active management skill and current activity illustrates that large skilled funds are generally less active (large purple circles on the right cluster towards the bottom):

Map of U.S. hedge fund closet indexing for long equity portfolios, charting historical active management skill as represented by the consistency of active returns and predicted future tracking error of active returns of U.S. hedge funds’ long equity portfolios

U.S. Hedge Fund Long Portfolios: Historical Active Management Skill and Predicted Future Activity

Yet, there are notable exceptions – several large, skilled, and active managers remain.

Conclusions

  • A fifth of U.S. hedge funds’ long equity portfolios are currently so passive that, even if they exceed the information ratios of 90% of their peers, they will still fail to merit a typical fee.
  • A third of U.S. hedge funds’ long equity capital will fail to merit a typical fee, even when its managers are highly skilled.
  • As skilled managers accumulate assets, they are more likely to closet index.
  • A typical hedge fund investor can replace a third of long hedge fund capital with cheap passive vehicles or truly active skilled managers and improve performance.
The information herein is not represented or warranted to be accurate, correct, complete or timely.
Past performance is no guarantee of future results.
Copyright © 2012-2015, 
AlphaBetaWorks, a division of Alpha Beta Analytics, LLC. All rights reserved.
Content may not be republished without express written consent.

Hedge Fund Closet Indexing

Fee Harvesting is a Problem for All Asset Classes

To generate active returns in excess of its fees, an active fund must take some active risk. However, some managers passively manage their funds but charge active fees. Others become less active as they accumulate assets. This problem of closet indexing is not confined to mutual funds. Over a third of the long capital of U.S. hedge funds is invested too passively to warrant a typical 1.5/15% fee structure, even if the funds’ managers are highly skilled. Investors could replace closet indexers with passive vehicles or truly active skilled managers and improve performance.

Closet Indexing Background

Two of our earlier articles explored past and current mutual fund closet indexing:

One article analyzed historical risk and performance of U.S. mutual funds.  It discovered that over a quarter (26%) of the funds have been so passive that, even after exceeding the information ratios of 90% of their peers, they would still not be worth the 1% mean management fee.

The other article addressed current risk and predicted volatility of U.S. mutual funds. It found that over two thirds (70%) of their capital is currently taking so little active risk that it will fail to merit the 1% mean management fee, even if the funds’ managers are highly skilled.

This article surveys long portfolios of hedge funds. We analyze current and historical long positions of approximately 300 concentrated medium and lower turnover U.S. hedge funds, identifying those that are unlikely to earn their fees in the future given their current active risk. We then quantify the problem of closet indexing for a typical hedge fund investor.

How Much Active Risk is Needed to Earn a Fee?

The Information Ratio (IR) is a measure of active return relative to active risk (tracking error). The best-performing 10% of U.S. hedge funds’ long portfolios achieve IR’s of 0.54 and higher; 90% achieve IR’s below 0.54:

Chart of the Distribution of Information Ratios of Long Portfolios of U.S. Hedge Funds

U.S. Hedge Fund Information Ratio Distribution – Long Positions

If a fund’s long portfolio exceeds the performance of 90% of its peers and achieves an IR of 0.54, then it needs tracking error above 1.85% to generate active return above 1%.

What active return will cover a typical fee? We make conservative assumptions that funds’ long equity portfolios are burdened with 1.5% management fee and 15% incentive allocation. Assuming 7% expected market return, the mean fee is 2.55%.

If all funds were able to achieve the 90th percentile of IR, they will need annual tracking error above 4.7% to earn this estimated mean fee and generate a positive net active return.

Hedge Fund Active Risk

Tracking error is due to active risks a fund takes: security selection risk due to stock picking and market timing risk due to variation in factors bets. We applied the AlphaBetaWorks Statistical Equity Risk Model to funds’ historical and latest holdings and estimated their historical and future tracking errors. Tracking errors were calculated relative to fund-specific benchmarks that represent each fund’s unique passive risk profile.

Over a tenth (33) of the funds have such low historical tracking errors that, even if they exceeded the performance of 90% of their peers, they would have failed to merit the 2.55% estimated mean fee:

Chart of the Distribution of Historical Tracking Errors of Long Portfolios of U.S. Hedge Funds

U.S. Hedge Fund Historical Tracking Error Distribution – Long Positions

Over a fifth (61) of the funds have such low estimated future tracking errors that, even if they exceed the performance of 90% of their peers, they will fail to merit the 2.55% estimated mean fee:

Chart of the Distribution of Estimated Future Tracking Errors of Long Portfolios of U.S. Hedge Funds

U.S. Hedge Fund Estimated Future Tracking Error Distribution – Long Positions

While there is less closet indexing among hedge funds than among mutual funds, the fees that hedge funds charge are significantly higher — to say nothing of the higher expectations that these higher fees warrant.  When practiced by hedge funds, closet indexing is all the more egregious.

Capital-Weighted Hedge Fund Closet Indexing

Larger hedge funds are more likely to engage in closet indexing. While approximately 20% of hedge funds surveyed have estimated future tracking errors below 4.7%, they represent nearly 40% of assets ($207 billion out of the $391 billion total in our sample). Therefore, more than a third of hedge fund long capital will not earn the 2.55% estimated mean fee, even when the managers are skilled.

Chart of the Distribution of Capital Estimated Future Capital-Weighted Tracking Error of Long U.S. Hedge Fund Capital

U.S. Hedge Fund Capital Estimated Future Tracking Error Distribution – Long Positions

The assumption of all funds exceeding historical IR’s of 90% of their peers is unrealistic. In practice, a portfolio of large hedge funds, built without attention to closet indexing, may be doomed to generate negative active returns, regardless of the managers’ skills. The 2.55% fee cited here is the estimated mean. Plenty of closet indexers charge more on their long equity portfolios and plenty of investors who remain with them stand to lose more.

A Map of Hedge Fund Skill and Activity

Our previous article discussed the evolution of skilled managers’ utility curves as an explanation for their reluctance to take risk. As a manager accumulates assets, fee harvesting becomes increasingly attractive. The map of U.S. hedge fund active management skill and activity below illustrates that large skilled funds tend to be relatively less active:

Chart Showing the Distribution of U.S. Hedge Fund Active Management Skill and Activity for Long Positions.

U.S. Hedge Fund Active Management Skill and Activity – Long Positions

Conclusions

  • 20% of long U.S. hedge fund portfolios surveyed are currently so passive that, even after exceeding the information ratios of 90% of their peers, they will still fail to merit a typical fee.
  • 39% of long U.S. hedge fund capital surveyed will fail to merit a typical fee, even if its managers are highly skilled.
  • Investors must monitor the evolution of their hedge fund managers towards closet indexing and mitigate fee harvesting.
  • A typical investor may be able to replace over a third of long hedge fund capital with passive vehicles or active skilled managers, improving performance.
The information herein is not represented or warranted to be accurate, correct, complete or timely.
Past performance is no guarantee of future results.
Copyright © 2012-2014, 
AlphaBetaWorks, a division of Alpha Beta Analytics, LLC. All rights reserved.
Content may not be republished without express written consent.

Mutual Fund Closet Indexing – Part 3

Why Most Investors Lose, Even if Their Manager is Skilled

An actively managed fund must take risk sufficient to generate active returns in excess of the fees that it charges. However, as skilled managers accumulate assets, they tend to become less active. Skilled managers who took sufficient active risk to earn their fees in the past may be closet indexing today. Consequently, over two thirds of the capital invested in “active” U.S. mutual funds is allocated to managers who are unlikely to earn the average fee, even if highly skilled. Simply by identifying these managers, investors can eliminate most active management fees and improve portfolio performance. 

Closet Indexing Defined

Our first article in this series discussed closet indexing and proposed a new metric of fund activity: Active Share of Variance  the share of volatility due to active management (security selection and market timing). The second article analyzed historical performance of U.S. mutual funds and discovered that over a quarter (26%) of the funds surveyed have been so passive that, even after exceeding the information ratios of 90% of their peers, they would still not be worth the 1% mean management fee.

Too Little Current Risk to Earn Future Fees

Thus far, our analysis improved on existing closet indexing metrics by evaluating past fund activity. The shortcoming of this analysis has been its failure to identify funds that have been active in the past but are closet indexing today. This article addresses the shortcoming: We analyze current and historical positions of approximately 1,700 non-index medium and lower turnover U.S. mutual funds, identifying those that are unlikely to earn their management fees in the future given their current active risk.

The Information Ratio (IR) is a measure of active return relative to active risk (tracking error). The top 10% of the funds achieve IR’s greater than or equal to 0.30; 90% achieve IR’s below 0.30:

Chart of the Distribution of Information Ratios for U.S. Mutual Funds

U.S. Mutual Fund Information Ratio Distribution

If a fund exceeds the performance of 90% of its peers and achieves IR of 0.30, then it needs tracking error above 3.3% to generate active return above 1%. The mean expense ratio for active U.S. mutual funds is approximately 1%. Therefore, if all funds were able to achieve the 90th percentile of IR, they will need annual tracking error above 3.3% to earn the mean fee and generate a positive net active return.

Tracking error is due to active risks a fund takes: security selection risk due to stock picking and market timing risk due to variation in factors bets. We applied the AlphaBetaWorks Statistical Equity Risk Model to funds’ historical and latest holdings and estimated their future tracking errors.

Over half (911) of the funds have such low estimated future tracking errors that, even if they exceeded the performance of 90% of their peers and achieved the IR of 0.30, they will fail to merit the 1% mean management fee:

Chart of the Distribution of Estimated Future Tracking Errors for U.S. Mutual Funds

U.S. Mutual Fund Estimated Future Tracking Error Distribution

Capital-Weighted Closet Indexing

Larger mutual funds are more likely to engage in closet indexing. While only 54% of mutual funds surveyed have estimated future tracking errors below 3.3%, they represent 70% of the assets ($2.4 trillion out of the $3.4 trillion total). Therefore, even if capital is invested with highly skilled managers, more than two thirds of it will not earn the 1% mean management fee:

Chart of the Distribution of Estimated Future Tracking Error of the Capital Invested in U.S. Mutual Funds

U.S. Mutual Fund Capital Estimated Future Tracking Error Distribution

A portfolio that primarily consists of large mutual funds may be doomed to generate negative active returns, regardless of the managers’ skills. The 1% management fee cited here is the mean. Plenty of closet indexers charge more and plenty of investors who remain with them stand to lose more.

Conclusions

  • Over half (54%) of active U.S. mutual funds surveyed are currently so passive that, even after exceeding the information ratios of 90% of their peers, they will still fail to merit a 1% management fee.
  • Over two thirds (70%) of active U.S. mutual fund capital surveyed will fail to merit a 1% management fee, even if its managers are highly skilled.
  • Skilled active managers do exist, but investors need to capture them early in their life cycles.
  • Investors must monitor the evolution of their skilled managers towards passivity.
  • By identifying closet indexers, a typical investor can eliminate most active fees and improve performance.
The information herein is not represented or warranted to be accurate, correct, complete or timely.
Past performance is no guarantee of future results.
Copyright © 2012-2014, 
AlphaBetaWorks, a division of Alpha Beta Analytics, LLC. All rights reserved.
Content may not be republished without express written consent.

Mutual Fund Closet Indexing – Part 2

Can a Fund Earn Its Fees if It Does Not Try?

To be worth the fees it charges, an actively managed fund must take some active risk, rather than merely mirror passive market exposures. However, over a quarter of “active” medium and lower turnover US mutual funds take so little active risk, they are unlikely to earn their management fees. In this article, we build on our earlier work and estimate the risk an active fund must take in order to earn the 1% mean management fee. Simply by testing for funds that are taking too little risk to generate positive net active returns, investors can save billions in fees each year. 

Closet Indexing Defined

Our earlier article discussed closet indexing and proposed a new metric of fund activity: Active Share of Variance – the share of volatility due to active management (security selection and market timing). This analytic relies on the factor analysis of historical holdings and is immune to the issues with holdings-based analysis and the issues with returns-based analysis that affect the popular closet indexing tests: Active Share and . This article uses the AlphaBetaWorks’ Performance Analytics Platform to objectively evaluate the level of fund activity necessary to earn a typical management fee.

Too Little Risk to Make a Difference

Is it possible for a highly skilled manager to take too little risk to earn management fees?

We surveyed 10 years of US filings history of approximately 1,700 non-index medium and lower turnover mutual funds with at least 5 years of filings. This group holds over $3.4 trillion in assets.

We applied the AlphaBetaWorks Statistical Equity Risk Model to funds’ historical holdings to estimate risk at the end of each month. We then attributed the following month’s returns to factor(market) and residual(security-specific) sources, estimated the appropriate factor benchmark, and calculated market timing returns due to variations in factor exposures.

The Information Ratio (IR) is a measure of active return relative to active risk (tracking error). The AlphaBetaWorks Performance Analytics Platform calculated historical (realized) IRs for all funds in the group. The 90th percentile of IR for the group is 0.30, which suggests that 90% of funds needed a tracking error above 3.3% to generate an active return above 1%:

US Mutual Fund Information Ratio Distribution

US Mutual Fund Information Ratio Distribution

Knowing that the mean expense ratio for active US mutual funds is approximately 1.0%, if all funds were able to achieve the 90th percentile of IR, they would need annual tracking error over 3.3% to generate a positive net active return. Over a quarter (445) of the funds in our survey realized tracking errors below this threshold; they have been so passive that, even assuming an IR of 0.30, they would have failed to generate 1% gross and 0% net active returns:

US Mutual Fund Tracking Error Distribution

US Mutual Fund Tracking Error Distribution

A Map of US Mutual Fund Skill and Activity

The evolution of skilled managers’ utility curves is one possible explanation for this reluctance to take risk. Perhaps, as a manager accumulates assets, fee harvesting becomes increasingly attractive. The map of fund active management skill and activity, included below, supports this hypothesis: Large skilled funds tend to be relatively less active. In fact, all the funds in the active and skilled (“Hungry”) group are relatively small:

US Mutual Fund Active Management Skill and Activity

US Mutual Fund Active Management Skill and Activity

Conclusions

  • Over a quarter (26%) of US mutual funds surveyed have been so passive that, even after exceeding the information ratios of 90% of their peers, they would still fail to merit a 1% management fee.
  • Large skilled funds tend to be relatively more passive.
  • Skilled active managers exist, but investors need to capture them early in their life cycles.
  • For this group alone, by identifying funds that take too little risk to generate positive active returns, investors could save between $4 and $10 billion in annual management fees.

Thus far, our work improves on the existing closet indexing metrics by evaluating past fund activity. In subsequent articles we will use the AlphaBetaWorks Performance Analytics Platform to analyze current risk and closet indexing, identifying those funds that are unlikely to earn their management fees in the future.

Copyright © 2012-2014, AlphaBetaWorks, a division of Alpha Beta Analytics, LLC. All rights reserved.
Content may not be republished without express written consent.

Mutual Fund Closet Indexing – Part 1

Are you Paying Active Fees for Passive Management?

Closet indexing may be practiced by 20% to 50% of “active” medium and lower turnover US mutual funds. To make this case, we improve on traditional holdings- and returns-based closet indexing metrics. Simply by testing for closet indexing, investors can save billions in management fees each year.

Closet Indexing

A 2009 study introduced the concept of Active Share to measure the degree to which a fund is actively managed, showing that active stock pickers outperform closet indexers. Another notable active management metric is with respect to a multifactor model.  Both metrics have their drawbacks:  Active Share relies on vulnerable holdings-based analysis. For example, suppose a manager holds a position in a benchmark ETF; this position will increase Active Share without making the fund more active. R² relies on returns-based analysis, which does not distinguish between passive factor exposures and market timing, among other limitations. Hence, both metrics are susceptible to manipulation and may not properly identify passive funds.

A Robust Approach

The AlphaBetaWorks approach relies on risk and attribution capabilities free of the above issues. We surveyed ten years of historical holdings of approximately 1,700 non-index medium and lower turnover mutual funds with at least 5 years of position history. This group manages over $3.4 trillion in assets. We used our proprietary Statistical Equity Risk Model on historical holdings to estimate fund risk at the end of each month. We then attributed the following month’s returns to factor (market), and residual (security-specific) sources. We compared the variance of residual and factor returns of the group to NASDX, a NASDAQ 100 ETF. We selected this ETF as a passive reference strategy that is more concentrated than broad market benchmarks but less concentrated than granular sector indices. Using an S&P 100 ETF yields similar conclusions.

For NASDX, factor exposures at the end of a given month explain approximately 95% of return variance in the following month. The remaining 5% residual variance is due to security selection.

How active are funds in our group compared to this 100-position ETF? A quarter (425 funds) had a lower share of residual variance – they were less active stock pickers:

Security Selection Share of Historical US Mutual Fund Variance

Security Selection Share of Historical US Mutual Fund Variance

Security selection is not the only source of active performance. The variation in factor exposures, or factor (market) timing, is another. The NASDAX’s historical factor exposures were not constant over the last 10 years. This factor exposure variation is responsible for 4.1% of monthly return variance. Eighty percent (1,354 funds) had been less active market timers:

Market Timing Share of Historical US Mutual Fund Variance

Market Timing Share of Historical US Mutual Fund Variance

Active returns consist of both security selection and market timing. In the case of NASDX, 93.3% of its 10-year monthly return variance can be explained by passive factor bets, while 6.7% is active. We call the latter figure the Active Share of Variance.

Using the F test to evaluate whether historical Active Share of Variance of a given fund exceeded that of NASDX, we produced a confidence level that a fund has been more active than the ETF. The following chart illustrates the confidence that each fund in our group has been active and shows Historical Active Shares of Variance due to security selection and market timing:

Distribution of Historical Active Share of Variance and Confidence that a Fund is Active

Distribution of Historical Active Share of Variance and Confidence that a Fund is Active

At the 95% confidence level, fewer than half of the funds (737) have been more active than the ETF; more than a fifth (350) have been less active. The test is inconclusive for the remaining 36% (602 funds), suggesting that investors can’t be certain that over half the “active” mutual funds surveyed are in fact active:

Distribution of Confidence that a Fund is Active

Distribution of Confidence that a Fund is Active

Conclusions

  • Over half (56%) of active US mutual funds surveyed are not significantly more active than a 100-position NASDX ETF.
  • Less than half (44%) of the funds are significantly more active that the ETF.
  • More than a fifth (21%) of the funds are significantly less active than the ETF.
  • Investors must be sure that they are not being charged active fees for passive management.
  • By identifying closet indexers within this group alone, investors could save between $4 and $15 billion in annual management fees.

This work improves on traditional holdings-based and returns-based analyses of fund activity. Admittedly, we use a subjective benchmark for activity – a specific passive ETF. In later notes we will use the AlphaBetaWorks Performance Analytics Platform to evaluate activity levels using objective metrics.

Copyright © 2012-2014, AlphaBetaWorks, a division of Alpha Beta Analytics, LLC. All rights reserved.
Content may not be republished without express written consent.