Hedge Fund Clustering: Q2 2015 Update

Fund crowding consists of investment bets shared by groups of funds – large pools of capital chasing similar strategies. Within the hedge fund industry, long equity portfolios crowd into several clusters with similar systematic (factor) and idiosyncratic (residual) bets. This hedge fund clustering is the internal structure of hedge fund crowding.

This piece illustrates the large-scale hedge fund clustering and examines the largest hedge fund cluster in which:

  • Factor crowding is due to two factors;
  • Residual crowding is moderate and four stock-specific bets stand out.

Allocators who are unaware of hedge fund clustering and hedge fund crowding may be invested in an undifferentiated portfolio, paying active fees for passive factor exposure.

Hedge Fund Crowding and Hedge Fund Clustering

Several of our earlier articles on hedge fund crowding analyzed the factor (systematic) and residual (idiosyncratic) bets of HF Aggregate, which consists of the popular equity holdings of all long U.S. hedge fund portfolios tractable from regulatory filings.

Analysis of overall industry crowding does not address bets shared by fund groups within the aggregate. To explore this internal structure of hedge fun crowding – clusters of funds with shared systematic (factor) and idiosyncratic (residual) bets – in 2014 we released pioneering research on hedge fund clustering. The 2014 work proved predictive and invaluable to allocators. This piece updates the analysis of hedge fund clustering with Q2 2015 holdings data.

Hedge Fund Clusters

To explore hedge fund clustering we analyze long portfolios of every pair of hedge funds analyzable using regulatory filings using the AlphaBetaWorks’ Statistical Equity Risk Model, a proven tool for forecasting portfolio risk and future performance. For each portfolio pair we estimate the future relative volatility (tracking error). The lower the expected relative tracking error between two funds, the more similar they are to each other.

Once each hedge fund pair is analyzed – hundreds of thousands of factor-based risk analyses – we identify groups of funds with similar factor and residual exposures and build clusters (similar to phylogenic trees, or family trees) of the funds’ long portfolios. We use agglomerative hierarchical clustering with estimated future relative tracking error as the metric of differentiation or dissimilarity. The result is a picture of clustering among all analyzable U.S. hedge funds’ long portfolios:

Chart of clustering of U.S. Hedge Funds’ Q2 2015 Long Equity Portfolios

Clusters of U.S. Hedge Funds’ Long Equity Portfolios: Q2 2015

The largest cluster contains approximately 50 funds. A number of portfolios had exposures that were so similar, we expect their relative annual volatility to be under 3% – their annual returns should differ from one another by less than 3% about two thirds of the time.

This is critical for allocators: if they are invested in clustered funds, they may be paying high active fees for a handful of passive factor bets and consensus stock picks.

The AQR-Adage Hedge Fund Cluster

The largest cluster is currently the AQR-Adage Cluster, named after two of its large members with similar long exposures:

Chart of clustering within the largest cluster of U.S. Hedge Funds’ Q2 2015 Long Equity Portfolios

The Largest Hedge Fund Long Equity Portfolio Cluster: Q2 2015

A flat diagram of the cluster better illustrates the distances (estimated future tracking errors) between its members:

Chart of the flat view of the chart of clustering within the AQR-Adage cluster of U.S. Hedge Funds’ Q2 2015 Long Equity Portfolios

Flat View of the AQR-Adage Long Equity Portfolio Cluster: Q2 2015

In aggregate, this cluster’s risk is very close to that of the U.S. equity market. We estimate the AQR-Adage Cluster’s expected tracking error relative to the Russell 3000 Index at 1.4%.

Source

Volatility (%)

Share of Variance (%)

Factor

0.97

48.18

Residual

1.01

51.82

Total

1.40

100.00

Put differently, we expect this cluster’s aggregate long portfolio return to differ from the market by more than 1.4% only about a third of the time.

AQR-Adage Cluster Factor (Systematic) Crowding

Below are this cluster’s significant factor exposures (in red) relative to the Russell 3000’s exposures (in gray):

Chart of exposures to the risk factors contributing most to the risk of the AQR-Adage hedge fund long equity portfolio cluster relative to the U.S. Market

Factor Exposures of the AQR-Adage Hedge Fund Cluster: Q2 2015

Market (high-beta) and Size (small-cap) exposures are responsible for most of this cluster’s relative factor risk:

Chart of contributions to the relative factor (systematic) variance of the risk factors contributing most to the risk of the AQR-Adage hedge fund long equity portfolio cluster relative to the U.S. Market

Factors Contributing Most to Relative Variance of the AQR-Adage Hedge Fund Cluster: Q2 2015

Factor

Relative Exposure (%)

Portfolio Variance (%²)

Share of Systematic Variance (%)

Market

5.18

0.44

46.48

Size

-4.65

0.16

16.46

Oil Price

0.90

0.15

15.38

Finance

-5.61

0.12

12.19

Utilities

-2.58

0.10

10.29

Other Factors

-0.03

-0.80

Total

0.94

100.00

AQR-Adage Cluster Residual (Idiosyncratic) Crowding

There is less residual crowding in the AQR-Adage Cluster than in HF Aggregate. For HF Aggregate, just three stocks were responsible for over half of the relative residual risk in Q2 2015. By contrast, in the AQR-Adage Cluster, four stocks are responsible for approximately a quarter of the relative residual risk:

Chart of contributions to the relative residual (idiosyncratic) variance of the stocks contributing most to the risk of the AQR-Adage hedge fund long equity portfolio cluster relative to the U.S. Market

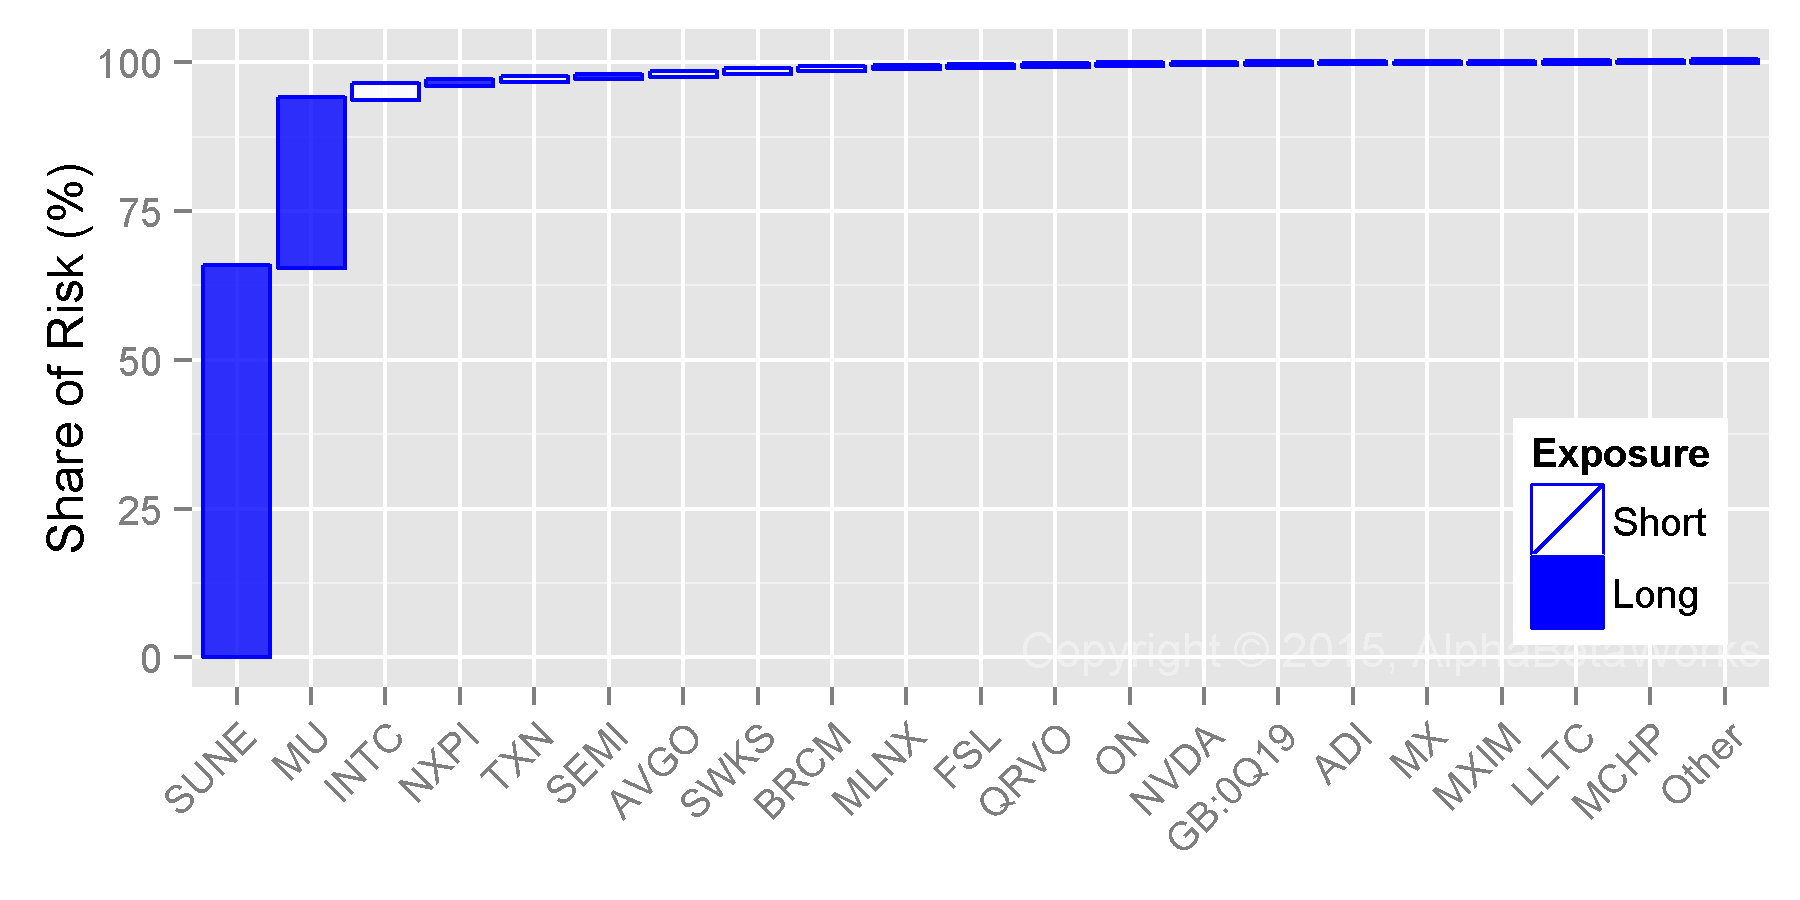
Stocks Contributing Most to Relative Residual Variance of the AQR-Adage Hedge Fund Cluster: Q2 2015

Symbol Name

Exposure (%)

Share of Idiosyncratic Variance (%)

AAPL Apple Inc.

-1.67

8.34

CHTR Charter Communications, Inc. Class A

1.09

5.97

FOLD Amicus Therapeutics, Inc.

0.35

5.60

SBAC SBA Communications Corporation

1.40

3.57

PCRX Pacira Pharmaceuticals, Inc.

0.37

2.56

LBTYK Liberty Global Plc Class C

1.08

2.47

SQBG Sequential Brands Group, Inc.

0.09

2.16

BAC Bank of America Corporation

-0.73

1.71

VRX Valeant Pharmaceuticals International, Inc.

0.50

1.66

LVLT Level 3 Communications, Inc.

0.41

1.45

Crowding within the AQR-Adage Cluster may not affect AAPL, CHTR, FOLD, and SBAC. However, these consensus bets will be the key contributors to the active returns of the AQR-Adage Cluster and many members. These stocks will also be the key drivers of some allocators’ idiosyncratic performance.

Idiosyncratic crowding is not the main problem with the cluster, since the expected idiosyncratic tracking error is low. Passivity is a bigger problem: Allocators to diversified portfolios of hedge funds within this cluster may be paying high fees for what’s effectively an index fund of passive factor bets. Closet indexing may be practiced by 70% of “active” U.S. mutual fund capital, but the high fees charged by hedge funds make fund differentiation especially important.

Summary

  • An analysis of the underlying structure of hedge fund crowding reveals hedge fund clustering – groups of portfolios with similar bets.
  • The largest hedge fund cluster consists of approximately 50 funds with shared factor and residual exposures.
  • The largest cluster’s factor herding is towards Market (high-beta) and short Size (small-cap) exposures.
  • This cluster’s residual herding is away from AAPL and towards CHTR, FOLD, and SBAC.
  • Allocators unaware of the clustering of their funds may be paying active fees for an effectively passive factor portfolio.
The information herein is not represented or warranted to be accurate, correct, complete or timely.
Past performance is no guarantee of future results.
Copyright © 2012-2015, 
AlphaBetaWorks, a division of Alpha Beta Analytics, LLC. All rights reserved.
Content may not be republished without express written consent.

Hedge Fund Semiconductor Sector Crowding

Our June 2015 piece listed SunEdison (SUNE) and Micron (MU) among the top ten stocks driving hedge fund risk and alpha. In the semiconductor sector, they were virtually the sole drivers. In addition, since mid-2014 semiconductor sector alpha for hedge funds has been sharply negative. Extreme semiconductor sector crowding and threat of liquidation were ominous and actionable. Investors armed with capable analytics could have avoided the bulk of their losses (by liquidating), or profited (by shorting); allocators could have asked undifferentiated managers probing questions.

This situation is not unique – liquidations devastated crowded bets across several sectors in 2015. For example, our July analysis highlighted the liquidation of crowded energy stocks. These lessons for investors and allocators apply across sectors and market cycles.

Hedge Fund Crowding in SunEdison (SUNE) and Micron (MU)

SunEdison and Micron were the two major sources of idiosyncratic (stock-specific) risk for hedge funds in the semiconductor sector for some time. For example, MU and SUNE contributed over 90% of stock-specific hedge fund risk in the semiconductor sector in Q3 2014:

Chart of the main stock-specific bets and their cumulative contribution to the residual variance of Hedge Fund Semiconductor Sector Aggregate Portfolio relative to Market on 9/30/2014

Stocks Contributing Most to U.S. Hedge Fund Semiconductor Aggregate Relative Residual Risk in Q3 2014

This continued into the new year, and by Q2 2015, MU and SUNE contributed almost 95% of stock-specific hedge fund risk in the semiconductor sector:

Chart of the main stock-specific bets and their cumulative contribution to the residual variance of Hedge Fund Semiconductor Sector Aggregate Portfolio relative to Market on 6/30/2015

Stocks Contributing Most to U.S. Hedge Fund Semiconductor Aggregate Relative Residual Risk in Q2 2015

The following table contains detailed data on hedge fund semiconductor crowding as of Q2 2015:

Exposure (%) Net Exposure Share of Risk (%)
HF Sector Aggregate Sector Aggregate % $mil Days of Trading
SUNE SunEdison, Inc. 28.03 1.24 26.79 2,177.1 9.2 65.40
MU Micron Technology, Inc. 31.10 5.56 25.54 2,075.8 3.9 28.23
INTC Intel Corporation 5.71 28.19 -22.49 -1,827.7 -2.0 2.48
NXPI NXP Semiconductors NV 8.55 4.46 4.10 333.0 1.1 0.55
TXN Texas Instruments Incorporated 0.13 11.40 -11.27 -915.6 -2.7 0.50
SEMI SunEdison Semiconductor, Inc. 3.86 0.20 3.65 296.8 44.9 0.45
AVGO Avago Technologies Limited 1.61 6.20 -4.59 -373.5 -0.8 0.44
SWKS Skyworks Solutions, Inc. 0.05 3.57 -3.52 -286.1 -0.8 0.44
BRCM Broadcom Corporation Class A 0.33 4.53 -4.20 -341.2 -0.7 0.33
MLNX Mellanox Technologies, Ltd. 2.39 0.39 1.99 161.8 5.7 0.21
FSL Freescale Semiconductor Inc 0.07 2.38 -2.31 -187.8 -2.7 0.21
QRVO Qorvo, Inc. 0.19 2.25 -2.06 -167.7 -0.9 0.18
ON ON Semiconductor Corporation 3.60 0.99 2.60 211.5 3.5 0.12
NVDA NVIDIA Corporation 0.10 2.19 -2.09 -170.2 -0.9 0.08
GB:0Q19 CEVA, Inc. 1.39 0.08 1.30 106.0 42.2 0.07
ADI Analog Devices, Inc. 0.02 3.74 -3.72 -302.3 -2.1 0.07
MX MagnaChip Semiconductor Corporation 0.57 0.04 0.54 43.5 9.5 0.03
MXIM Maxim Integrated Products, Inc. 0.38 1.87 -1.50 -121.6 -1.3 0.02
LLTC Linear Technology Corporation 0.00 2.13 -2.13 -173.2 -1.8 0.02
MCHP Microchip Technology Incorporated 0.11 1.88 -1.77 -143.7 -1.5 0.02
Other Positions 0.34 0.15
Total 100.00

Hedge Fund Security Selection in the Semiconductor Sector

The above data is informative and actionable on its own – it points to massive concentration of risk. However, the data becomes more threatening when combined with hedge funds’ semiconductor security selection performance:

Hedge Fund Semiconductor Sector Aggregate Historical Security Selection Performance

Historical Return from Security Selection of Hedge Fund Semiconductor Sector Aggregate

AlphaBetaWorks’s metric of security selection is αReturn – the performance a portfolio would have generated if markets had been flat. Hedge funds enjoyed positive αReturn in the semiconductor sector over ten years, albeit with up and down cycles. The latest surge in αReturn started in 2012 and peaked in 2014. Since then, hedge funds’ long semiconductor picks underperformed by over 30%, on a risk-adjusted basis. Had hedge funds taken the same risk passively (say by owning a cap-weighted semiconductor index) they would have made over 30% more.

Negative αReturn is often a sign of liquidation and hedge fund semiconductor bets have a history of booms and busts. As illustrated in the charts above, most of the stock-specific hedge fund risk came from two stocks: SunEdison and Micron. When liquidation became evident in late-2014, these stocks became vulnerable.

Hedge Fund Liquidation of SUNE and MU

Analytics built on a robust risk model, such as the AlphaBetaWorks Statistical Equity Risk Model used here, identify crowding and leading indicators of liquidations. Portfolio managers and investors armed with these analytics see early warning signs and avoid losses, or even profit from herding. Allocators have the data on undifferentiated managers.

The above pattern is not unique: crowded names typically underperform on a risk-adjusted basis. Liquidations are routine.

Conclusions

  • Holdings-based analytics built on robust risk models identify crowding and detect early signs of portfolio liquidations.
  • Investors with the tools to identify hedge fund crowding and liquidations can reduce losses or profit from opportunities.
  • Allocators aware of crowding can gain new insights into portfolio risk, manager skills, and fund differentiation.
The information herein is not represented or warranted to be accurate, correct, complete or timely.
Past performance is no guarantee of future results.
Copyright © 2012-2015, AlphaBetaWorks, a division of Alpha Beta Analytics, LLC. All rights reserved.
Content may not be republished without express written consent.

Hedge Fund Crowding Update – Q2 2015

Hedge funds share a few bets. These crowded systematic and idiosyncratic exposures are the main sources of the industry’s relative performance and of many firms’ returns. Two factors and three stocks were behind most herding of hedge fund long U.S. equity positions in Q2 2015.

Investors should treat consensus ideas with caution: Crowded stocks are prone to mass liquidation. Crowded hedge fund bets tend to do poorly in most sectors, though there are some exceptions.

Identifying Hedge Fund Crowding

This piece follows the approach of our earlier articles on crowding: We created a position-weighted portfolio (HF Aggregate) consisting of the popular U.S. equity holdings of all long hedge fund portfolios tractable from regulatory filings. We then analyzed HF Aggregate’s risk relative to U.S. Market Aggregate (similar to the Russell 3000 index) using AlphaBetaWorks’ Statistical Equity Risk Model to identify sources of crowding.

Hedge Fund Aggregate’s Risk

The Q2 2015 HF Aggregate had 3.2% estimated future tracking error relative to U.S. Market. Factor (systematic) bets were the primary source of risk and systematic crowding increased slightly from prior quarters:

The components of HF Aggregate’s relative risk on 6/30/2015 were the following:

 Source Volatility (%) Share of Variance (%)
Factor 2.46 60.01
Residual 2.01 39.99
Total 3.17 100.00

Because of the close relationship between active risk and active performance, the low estimated future volatility (tracking error) indicates that the long book of a diversified portfolio of hedge funds will behave similarly to a passive factor portfolio. Even if its active bets pay off, HF Aggregate will have a hard time earning a typical fee. Consequently, the long portion of highly diversified hedge fund portfolios will struggle to outperform a passive alternative.

Hedge Fund Factor (Systematic) Crowding

Below are HF Aggregate’s principal factor exposures (in red) relative to U.S. Market’s (in gray) as of 6/30/2015:

Chart of the factor exposures contributing most to the factor variance of Hedge Fund Aggregate Portfolio relative to Market on 6/30/2015

Factor Exposures Contributing Most to the Relative Risk for U.S. Hedge Fund Aggregate

Of these bets, Market (Beta) and Oil are responsible for 90% of the relative factor risk. These are the components of the 2.46% Factor Volatility in the first table:

Chart of the main factors and their cumulative contribution to the factor variance of Hedge Fund Aggregate Portfolio relative to Market on 6/30/2015

Factors Contributing Most to Relative Factor Variance of U.S. Hedge Fund Aggregate

Factor Relative Exposure (%) Portfolio Variance (%²) Share of Systematic Variance (%)
Market 15.76 3.68 60.91
Oil Price 2.93 1.75 28.94
Industrial 9.72 0.53 8.72
Finance -8.36 0.46 7.58
Utilities -2.78 0.25 4.13
Other Factors -0.62 -10.28
Total 6.04 100.00

Exposures to the three main factor bets are near 10-year highs.

Hedge Fund U.S. Market Factor Exposure History

HF Aggregate’s market exposure is approximately 115% (its Market Beta is approximately 1.15). Hedge fund’s long books are taking approximately 15% more market risk than U.S. equities and approximately 20% more market risk than S&P 500. This bet has proven costly in August of 2015:

Chart of the historical exposure of Hedge Fund Aggregate Portfolio to the U.S. Market Factor

U.S. Hedge Fund Aggregate’s U.S. Market Factor Exposure History

Also note that long hedge fund portfolios consistently take 5-15% more market risk than S&P500 and other broad benchmarks. This is why simple comparison of long hedge fund portfolio performance to market indices is misleading.

Hedge Fund Oil Price Exposure History

HF Aggregate’s oil exposure, near 3%, is also close to the 10-year highs last reached in 2009:

Chart of the historical exposure of Hedge Fund Aggregate Portfolio to the Oil Price Factor

U.S. Hedge Fund Aggregate’s Oil Factor Exposure History

As oil prices collapsed in 2014, hedge funds rapidly boosted oil exposure. This contrarian bet is a weak bullish indicator for the commodity.

Hedge Fund Industrial Factor Exposure History

HF Aggregate’s industrials factor exposure remained near the all-time high:

Chart of the historical exposure of Hedge Fund Aggregate Portfolio to the Industrial Factor

U.S. Hedge Fund Aggregate’s Industrial Factor Exposure History

This has been a losing contrarian bet since 2014 and it is a weak bearish indicator for the sector.

Hedge Fund Residual (Idiosyncratic) Crowding

About 40% of hedge fund crowding is due to residual (idiosyncratic, stock-specific) risk. Just three names are responsible for over half of it:

Chart of the main stock-specific bets and their cumulative contribution to the residual variance of Hedge Fund Aggregate Portfolio relative to Market on 6/30/2015

Stocks Contributing Most to Relative Residual Variance of U.S. Hedge Fund Aggregate

These stocks will be primary drivers of HF Aggregate’s and of the most crowded firms’ stock-specific performance. Investors should be ready for seemingly inexplicable volatility due to portfolio liquidation and rebalancing. Though individual crowded names may be wonderful investments, they have tended to underperform:

Symbol Name Exposure (%) Share of Idiosyncratic Variance (%)
VRX Valeant Pharmaceuticals International, Inc. 4.78 36.25
LNG Cheniere Energy, Inc. 1.58 10.53
JD JD.com, Inc. Sponsored ADR Class A 1.59 4.60
NFLX Netflix, Inc. 0.74 4.55
SUNE SunEdison, Inc. 0.92 4.03
CHTR Charter Communications, Inc. Class A 1.55 3.04
PCLN Priceline Group Inc 1.36 2.37
EBAY eBay Inc. 1.47 1.58
FLT FleetCor Technologies, Inc. 1.10 1.17
TWC Time Warner Cable Inc. 1.27 1.17

Investors drawn to these names should not use hedge fund ownership as a plus. Instead, this ownership should trigger particularly thorough due-diligence. Any company slip-ups will be magnified as impatient investors stampede out of positions.

Fund allocators should also pay attention to crowding: Historically, consensus bets have done worse than a passive portfolio with the same risk. Investing in crowded books is investing in a pool of undifferentiated bets destined to disappoint.

AlphaBetaWorks’ analytics identify hedge fund herding in each equity sector. Our fund analytics measure hedge fund differentiation and identify specific skills in each sector that are strongly predictive of future performance.

Summary

  • There is both factor (systematic/market) and residual (idiosyncratic/security-specific) crowding of hedge funds’ long U.S. equity portfolios.
  • Hedge fund crowding is approximately 60% systematic and 40% idiosyncratic.
  • The main sources of systematic crowding are Market (Beta) and Oil.
  • The main sources of idiosyncratic crowding are VRX, LNG, JD, NFLX, and SUNE.
  • The crowded hedge fund portfolio has historically underperformed its passive alternative – allocators and fund followers should pay close attention to these consensus bets.
The information herein is not represented or warranted to be accurate, correct, complete or timely.
Past performance is no guarantee of future results.
Copyright © 2012-2015, AlphaBetaWorks, a division of Alpha Beta Analytics, LLC. All rights reserved.
Content may not be republished without express written consent.

Liquidation of Crowded Hedge Fund Energy Positions

The 2014-2015 energy carnage has been worse for crowded hedge fund energy positions than the global financial crisis. Past liquidations of crowded hedge fund bets were followed by rapid recoveries. Consequently, energy investors should survey the wreckage for opportunities.

Crowded hedge fund oil and gas producers underperformed their sector peers by over 20% since 2013 as fund energy books were liquidated. Crowded oilfield service bets underperformed by over 15%. This is worse than 10-15% underperformance during the 2008-2009 global financial crisis.

Forced hedge fund portfolio liquidations are usually followed by rapid recoveries in the affected names – liquidations during the global financial crisis reversed in under a year. Since the energy market in 2015 faces unique challenges, history may not repeat itself. Still, some of the crowded positions should present opportunities.

Performance of Crowded Hedge Fund Oil and Gas Producer Bets

To explore crowding we analyze hedge fund Oil and Gas Producer Sector holdings (HF Sector Aggregate) relative to the Sector Market Portfolio (Sector Aggregate). HF Sector Aggregate is position-weighted; Sector Aggregate is capitalization-weighted. This follows the approach of our earlier articles on hedge fund crowding.

The figure below plots historical return of HF Oil and Gas Producer Aggregate. Factor return is due to systematic (market) risk. Blue area represents positive and gray area represents negative risk-adjusted returns from security selection (αReturn). Crowded bets underperformed the portfolio with the same systematic risk (factor portfolio) by over 50% during the past 10 years, largely since 2014:

Chart of the passive and security selection performance of the aggregate portfolio of Hedge Fund Oil and Gas Producer Sector holdings

Hedge Fund Oil and Gas Producer Sector Aggregate Historical Performance

The risk-adjusted return from security selection (αReturn) of HF Sector Aggregate is the return it would have generated if markets had been flat – all market effects on performance have been eliminated. This is the idiosyncratic performance of HF Sector Aggregate:

Chart of the security selection performance of the aggregate portfolio of Hedge Fund Oil and Gas Producer Sector holdings

Hedge Fund Oil and Gas Producer Sector Aggregate Historical Security Selection Performance

The above chart reveals that by Q2 2009 the crowded hedge fund energy producers erased underperformance due to 2008 liquidation. The liquidation since 2013 has been even larger than in 2008. Since they may be posed for a steep recovery, crowded hedge fund oil and gas producer bets are worth watching in the coming months.

Performance of Crowded Hedge Fund Oilfield Service Bets

The figure below plots historical return of HF Oilfield Service Aggregate. It follows the approach of HF Oil and Gas Producer Aggregate above:

Chart of the passive and security selection performance of the aggregate portfolio of Hedge Fund Oilfield Service Sector holdings

Hedge Fund Oilfield Service Sector Aggregate Historical Performance

Since 2013, the crowded oilfield service portfolio has underperformed, similarly to the crowded oil and gas portfolio:

Chart of the security selection performance of the aggregate portfolio of Hedge Fund Oilfield Service Sector holdings

Hedge Fund Oilfield Service Sector Aggregate Historical Security Selection Performance

Crowded energy producers and service companies have underperformed sector peers by 15-25% in the latest liquidation. Many may now be attractive, given the recovery that typically follows. Below are the hedge fund energy bets that may present these opportunities:

Crowded Hedge Fund Oil and Gas Producer Bets

The following stocks contributed most to the relative residual (idiosyncratic, security-specific) risk of the HF Oil and Gas Aggregate as of Q1 2015. Blue bars represent long (overweight) exposures relative to Sector Aggregate. White bars represent short (underweight) exposures. Bar height represents contribution to relative stock-specific risk:

Chart of the contribution to relative risk of the most crowded hedge fund oil and gas production bets

Crowded Hedge Fund Oil and Gas Producer Bets

The following table contains detailed data on these crowded hedge fund oil and gas producer bets:

Exposure (%)

Net Exposure

Share of Risk (%)
HF Sector Aggr. Sector Aggr. % $mil Days of Trading
WPZ Williams Partners, L.P. 17.93 4.75 13.18 1,812.2 15.0 23.04
PXD Pioneer Natural Resources Company 14.42 4.01 10.41 1,432.0 4.9 17.91
CRC California Resources Corp 3.42 0.48 2.93 403.2 8.2 10.79
CHK Chesapeake Energy Corporation 8.31 1.55 6.76 930.1 2.8 9.95
COP ConocoPhillips 0.99 12.62 -11.63 -1,599.0 -3.7 7.00
OXY Occidental Petroleum Corporation 0.69 9.25 -8.56 -1,176.6 -3.3 5.45
EOG EOG Resources, Inc. 2.13 8.28 -6.14 -844.7 -2.4 4.40
RRC Range Resources Corporation 5.33 1.45 3.88 533.8 3.4 3.68
CIE Cobalt International Energy, Inc. 3.10 0.64 2.46 338.2 11.2 2.93
OAS Oasis Petroleum Inc. 3.15 0.33 2.82 387.9 2.7 2.39
CMLP Crestwood Midstream Partners LP 3.83 0.45 3.38 465.2 47.0 1.99
AR Antero Resources Corporation 3.97 1.60 2.37 325.5 4.5 1.39
WLL Whiting Petroleum Corporation 3.57 1.04 2.53 347.5 1.2 1.06
NBL Noble Energy, Inc. 0.28 3.12 -2.84 -390.1 -2.2 0.80
CLR Continental Resources, Inc. 0.18 2.68 -2.50 -344.1 -2.2 0.76
COG Cabot Oil \& Gas Corporation 0.49 2.01 -1.52 -209.5 -1.1 0.71
DVN Devon Energy Corporation 0.55 4.06 -3.51 -483.0 -2.2 0.62
EQT EQT Corporation 0.16 2.07 -1.91 -262.3 -2.5 0.59
APA Apache Corporation 1.15 3.74 -2.59 -356.6 -1.7 0.47
APC Anadarko Petroleum Corporation 4.99 7.02 -2.04 -280.2 -0.8 0.43
Other Positions 0.80 3.65
Total 100.00

Crowded Hedge Fund Oilfield Service Bets

The following stocks contributed most to the relative residual risk of the HF Sector Aggregate as of Q1 2015:

Chart of the contribution to relative risk of the most crowded hedge fund oilfield service bets

Crowded Hedge Fund Oilfield Service Bets

The following table contains detailed data on these crowded hedge fund oilfield service bets:

Exposure (%) Net Exposure Share of Risk (%)
HF Sector Aggr. Sector Aggr. % $mil Days of Trading
BHI Baker Hughes Incorporated 32.63 9.95 22.68 1,258.9 6.1 50.38
SLB Schlumberger NV 3.31 38.39 -35.07 -1,946.7 -2.8 22.65
HAL Halliburton Company 28.87 13.42 15.45 857.4 1.4 12.44
DAKP Dakota Plains Holdings, Inc. 0.31 0.04 0.27 15.1 78.3 3.86
HOS Hornbeck Offshore Services, Inc. 3.21 0.24 2.97 164.9 6.8 1.89
NOV National Oilwell Varco, Inc. 2.88 7.38 -4.49 -249.4 -0.9 1.45
FTI FMC Technologies, Inc. 0.02 3.08 -3.06 -169.9 -1.2 1.06
FTK Flotek Industries, Inc. 1.51 0.29 1.22 67.9 5.8 0.85
WFT Weatherford International plc 1.25 3.43 -2.18 -121.1 -1.0 0.71
CLB Core Laboratories NV 0.00 1.62 -1.62 -90.0 -1.1 0.57
SDRL Seadrill Ltd. 0.00 1.66 -1.66 -92.1 -0.6 0.49
OIS Oil States International, Inc. 2.71 0.74 1.97 109.5 2.7 0.39
EXH Exterran Holdings, Inc. 1.98 0.83 1.14 63.4 2.6 0.36
USAC USA Compression Partners LP 1.80 0.24 1.56 86.6 45.7 0.31
OII Oceaneering International, Inc. 0.13 1.93 -1.81 -100.3 -1.5 0.27
FI Frank’s International NV 0.00 1.04 -1.04 -57.7 -4.2 0.26
KNOP KNOT Offshore Partners LP 2.31 0.12 2.19 121.4 47.1 0.25
RES RPC, Inc. 0.05 1.00 -0.96 -53.0 -2.0 0.23
WG Willbros Group, Inc. 0.46 0.07 0.39 21.5 11.3 0.19
MDR McDermott International, Inc. 1.04 0.33 0.71 39.5 1.4 0.17
Other Positions 0.34 1.22
Total 100.00

Summary

  • The 2014-2015 carnage has been worse for crowded hedge fund oil and gas producer and oilfield service bets than the global financial crisis.
  • Past liquidations of crowded positions were followed by rapid recoveries.
  • Energy investors should survey the wreckage of crowded hedge fund energy bets for opportunities.
The information herein is not represented or warranted to be accurate, correct, complete or timely.
Past performance is no guarantee of future results.
Copyright © 2012-2015, AlphaBetaWorks, a division of Alpha Beta Analytics, LLC. All rights reserved.
Content may not be republished without express written consent.


Property and Casualty Industry Crowding

Property and casualty insurance company portfolios share a few systematic bets. These crowded bets are the main sources of the industry’s and many individual companies’ relative investment performance. Since the end of 2013, these exposures have cost the industry billions.

Identifying Property and Casualty Industry Crowding

This analysis of property and casualty (P&C) insurance industry portfolios resulted from collaboration with Peer Analytics, the only provider of accurate peer universe comparisons to the insurance industry.

In analyzing property and casualty industry portfolios, we follow the approach of our earlier articles on crowding: We created a position-weighted portfolio (P&C Aggregate) consisting of all property and casualty insurance portfolios reported in regulatory filings. P&C Aggregate covers over 1,300 companies with total portfolio value over $300 billion. We analyzed P&C Aggregate’s risk relative to Russell 3000 index (a close proxy for the U.S. Market) using AlphaBetaWorks’ Statistical Equity Risk Model to identify sources of crowding.

Property and Casualty Industry 2014-2015 Underperformance

P&C Aggregate systematic (factor) performance lagged the market by over 4%, or over $12 billion, since the end of 2013. This is largely due to low (short, underweight) exposures to Market (Beta), Health, and Technology factors:

Chart of the factor returns of the Property and Casualty Industry’s Aggregate Portfolio relative to Market during 2014-2015

2014-2015 Underperformance due to Property and Casualty Industry’s Portfolio Factor Exposures

Below are the main contributing exposures, in percent:

Factor

Return

Portfolio Exposure Benchmark Exposure Relative Exposure Portfolio Return Benchmark Return

Relative Return

Market

16.64

91.90 99.97 -8.07 15.25 16.63

-1.39

Health

21.12

6.59 13.09 -6.50 1.30 2.58

-1.29

Technology

5.93

8.93 19.10 -10.17 0.53 1.13

-0.60

FX

21.94

-3.72 -1.19 -2.53 -0.75 -0.24

-0.51

Energy

-25.18

7.26 5.67 1.59 -1.99 -1.56

-0.43

For some companies, these exposures may be due to conscious portfolio and risk management processes. For others, they may have been unintended. For industry as a whole, robust risk and portfolio management would have generated billions in additional returns.

Property and Casualty Industry Year-end 2013 Crowding

Property and casualty industry’s recent crowding has been costly in practice. P&C Aggregate’s relative factor bets have cost it over 4% since year-end 2013. The industry made $12 billion less than it would have if it had simply matched market factor exposures.

Year-end 2013 Systematic (Factor) Exposures

Below are P&C Aggregate’s most significant factor exposures (Portfolio in red) relative to Russell 3000 (Benchmark in gray) as of 12/31/2013:

Chart of the factor exposures contributing most to the factor variance of Property and Casualty Industry’s Aggregate Portfolio relative to Market on 12/31/2013

Factors Contributing Most to the Relative Portfolio Risk for Property and Casualty Industry Aggregate on 12/31/2013

P&C Aggregate’s factor exposures drive its systematic returns in various scenarios. The exposures above (underweight Market and Technology factors) suggest the P&C industry is preparing for technology crash akin to 2001. This and other historical regimes provide the stress tests below, similar to those now required of numerous managers.

Property and Casualty Industry Year-end 2014 Crowding

Year-end 2014 Systematic (Factor) Exposures

Property and casualty industry portfolio turnover is low. Consequently, industry factor exposures at year-end 2014 were close to those at year-end 2013. Below are P&C Aggregate’s most significant factor exposures (Portfolio in red) relative to Russell 3000 (Benchmark in gray) as of 12/31/2014:

Chart of the factor exposures contributing most to the factor variance of Property and Casualty Industry’s Aggregate Portfolio relative to Market on 12/31/2014

Factors Contributing Most to the Relative Portfolio Risk for Property and Casualty Industry Aggregate on 12/31/2014

The main exposures of the property and casualty industry were: short/underweight Market (Beta), long/overweight Size (large companies), short Health, and short Technology. The industry crowds towards large and low-beta Consumer and Financials stocks:

Factor

Portfolio Exposure

Benchmark Exposure Relative Exposure Factor Volatility Share of Absolute Factor Variance Share of Absolute Total Variance Share of Relative Factor Variance

Share of Relative Total Variance

Market

90.39

99.97 -9.58 13.44 98.18 96.21 55.19

26.60

Size

13.32

-1.01 14.33 8.03 -0.91 -0.90 46.71

22.51

Health

7.68

13.09 -5.41 6.91 0.29 0.28 6.19

2.98

Technology

9.31

19.10 -9.79 5.80 -0.06 -0.06 4.16

2.00

Mining

1.54

0.63 0.91 15.61 -0.20 -0.19 1.76

0.85

Energy

3.93

5.67 -1.74 10.47 1.04 1.02 1.62

0.78

Consumer

27.11

23.04 4.08 3.91 -0.68 -0.66 1.53

0.74

Finance

21.48

18.92 2.56 5.48 -1.93 -1.89 1.49

0.72

Value

1.52

0.78 0.73 13.45 -0.04 -0.04 0.61

0.29

Scenario Analysis: 2000-2001 Outperformance

Given property and casualty industry’s under-weighting of Market and Technology, it would experience its highest outperformance in an environment similar to the 2001 technology crash. In this environment, industry’s systematic exposures would generate 2% outperformance:

Chart of the factor returns of the Property and Casualty Industry’s Aggregate Portfolio relative to Market during 2000-2001

2000-2001: Stress test of outperformance due to Property and Casualty Industry’s Portfolio Factor Exposures

Below are the main contributors to this outperformance, in percent:

Factor Return Portfolio Exposure Benchmark Exposure Relative Exposure Portfolio Return Benchmark Return Relative Return
Technology

-36.83

9.31 19.10 -9.79 -3.96 -7.99

4.04

Market

-29.28

90.39 99.97 -9.58 -26.75 -29.27

2.52

Consumer

19.60

27.11 23.04 4.08 5.03 4.26

0.77

Finance

27.27

21.48 18.92 2.56 5.48 4.81

0.66

Value

42.82

1.52 0.78 0.73 0.58 0.30

0.28

Mining

32.25

1.54 0.63 0.91 0.47 0.20

0.28

Scenario Analysis: 1999-2000 Underperformance

Given property and casualty industry’s under-weighting of Market and Technology, it would experience its highest underperformance in an environment similar to the 1999 technology boom.  In this environment, industry’s systematic exposures would underperform the market by more than 10%:

Chart of the factor returns of the Property and Casualty Industry’s Aggregate Portfolio relative to Market during 1999-2000

1999-2000: Stress test of underperformance due to Property and Casualty Industry’s Portfolio Factor Exposures

Below are the main contributors to this underperformance, in percent:

Factor

Return

Portfolio Exposure Benchmark Exposure Relative Exposure Portfolio Return Benchmark Return

Relative Return

Technology

53.04

9.31 19.10 -9.79 4.30 8.95

-4.66

Market

29.23

90.39 99.97 -9.58 26.22 29.22

-3.00

Size

-18.83

13.32 -1.01 14.33 -2.63 0.20

-2.83

Consumer

-16.57

27.11 23.04 4.08 -4.72 -4.02

-0.70

Finance

-20.59

21.48 18.92 2.56 -4.54 -4.01

-0.54

Energy

14.38

3.93 5.67 -1.74 0.62 0.90

-0.27

FX

6.84

-3.74 -1.19 -2.55 -0.25 -0.08

-0.17

Value

-14.04

1.52 0.78 0.73 -0.17 -0.09

-0.08

Mining

-8.54

1.54 0.63 0.91 -0.08 -0.03

-0.05

Communications

0.52

1.30 2.06 -0.76 0.02 0.04

-0.01

Conclusions

  • There is factor (systematic/market) crowding of property and casualty insurance companies’ long U.S. equity portfolios.
  • The main sources of systematic crowding are short (underweight) exposures to Market (Beta), Technology, and Health.
  • Since year-end 2013, factor exposures have cost the property and casualty industry over 4%, more than $12 billion, in underperformance.
  • For some portfolios, this may be a conscious risk management decision; for others, it is a costly oversight.
  • By managing its exposures in recent quarters, the industry would have generated billions in additional returns.
The information herein is not represented or warranted to be accurate, correct, complete or timely.
Past performance is no guarantee of future results.
Copyright © 2012-2015, AlphaBetaWorks, a division of Alpha Beta Analytics, LLC. All rights reserved.
Content may not be republished without express written consent.

Hedge Fund Crowding Update – Q1 2015

Hedge funds share a few systematic and idiosyncratic bets. These crowded bets are the main sources of the industry’s relative performance and of many individual funds’ returns. Three factors and four stocks were behind the majority of hedge fund long U.S. equity herding during Q1 2015.

Investors should treat crowded ideas with caution: Crowded stocks are more volatile and vulnerable to mass liquidation. Crowded hedge fund bets generally fare poorly in most sectors, though they do well in a few.

Identifying Hedge Fund Crowding

This piece follows the approach of our earlier articles on crowding: We created a position-weighted portfolio (HF Aggregate) consisting of popular long U.S. equity holdings of all hedge funds tractable from quarterly filings. We then analyzed HF Aggregate’s risk relative to U.S. Market Aggregate (similar to the Russell 3000 index) using AlphaBetaWorks’ Statistical Equity Risk Model to identify sources of crowding.

Hedge Fund Aggregate’s Risk

The Q1 2015 HF Aggregate had 3.1% estimated future tracking error relative to U.S. Market. Factor (systematic) bets were the primary source of risk and systematic crowding increased slightly from Q4 2014:

The components of HF Aggregate’s relative risk on 3/31/2015 were the following:

 Source

Volatility (%)

Share of Variance (%)

Factor

2.42

61.21

Residual

1.92

38.79

Total

3.09

100.00

The low estimated future tracking error indicates that, even if its active bets pay off, HF Aggregate will have a hard time earning a typical fee. Consequently, the long portion of highly diversified hedge fund portfolios will struggle to outperform a passive alternative after factoring in the higher fees.

Hedge Fund Factor (Systematic) Crowding

Below are HF Aggregate’s principal factor exposures (in red) relative to U.S. Market’s (in gray) as of 3/31/2015:

Chart of the current and historical exposures to the most significant risk factors of U.S. Hedge Fund Aggregate

Factor Exposures Contributing Most to the Relative Risk for U.S. Hedge Fund Aggregate

Of these bets, Market (Beta) and Oil are responsible for almost 90% of the relative factor risk and 50% of the total. These are the components of the 2.42% Factor Volatility in the first table:

Chart of the cumulative contribution to relative factor variance of the most significant risk factors of U.S. Hedge Fund Aggregate

Factors Contributing Most to Relative Factor Variance of U.S. Hedge Fund Aggregate

Factor

Relative Exposure (%)

Portfolio Variance (%²)

Share of Systematic Variance (%)

Market

14.91

3.83

65.58

Oil Price

2.48

1.37

23.46

Industrial

9.38

0.46

7.88

Finance

-6.10

0.29

4.97

Utilities

-2.80

0.28

4.79

Other Factors

-0.39

-6.68

Total

5.84

100.00

Absolute exposures to all three primary sources of factor crowding are at or near 10-year highs.

Hedge Fund U.S. Market Factor Exposure History

HF Aggregate’s market exposure is near 115% (Beta is near 1.15) – the level last reached in mid-2006:

Chart of the historical U.S. Market Factor exposure of U.S. Hedge Fund Aggregate

U.S. Hedge Fund Aggregate’s U.S. Market Factor Exposure History

We will discuss the predictive value of this indicator in later posts. Note that long hedge fund portfolios consistently take 5-15% more market risk than S&P500 and other broad market benchmarks. Therefore, simple comparison of long hedge fund portfolio performance to market indices is generally misleading.

Hedge Fund Oil Price Exposure History

HF Aggregate’s oil exposure of 2.5% is similarly near 10-year highs and near the levels last seen in 2009:

Chart of the historical Oil Price factor exposure of U.S. Hedge Fund Aggregate

U.S. Hedge Fund Aggregate’s Oil Price Exposure History

As oil prices collapsed in 2014, hedge funds rapidly boosted oil exposure. This contrarian bet began to pay off in 2015. A comprehensive discussion of HF Aggregate’s historical oil factor timing performance is beyond the scope of this piece.

Hedge Fund Industrial Factor Exposure History

HF Aggregate’s industrials factor exposure over 25% is now at the all-time height:

Chart of the historical Industrial Factor exposure of U.S. Hedge Fund Aggregate

U.S. Hedge Fund Aggregate’s Industrial Factor Exposure History

This has been a losing contrarian bet since 2014.

Hedge Fund Residual (Idiosyncratic) Crowding

About a third of hedge fund crowding is due to residual (idiosyncratic, stock-specific) risk. Only four stocks were responsible for over half of the relative residual variance:

Chart of the cumulative contribution to relative residual variance of the most significant residual (stock-specific, idiosyncratic) bets of U.S. Hedge Fund Aggregate

Stocks Contributing Most to Relative Residual Variance of U.S. Hedge Fund Aggregate

These stocks will be primary drivers of HF Aggregate’s and of the most crowded firms’ stock-specific performance. Investors should be ready for seemingly inexplicable volatility in these names. Some may be wonderful individual investments, but most have historically underperformed:

Symbol

Name

Exposure (%)

Share of Idiosyncratic Variance (%)

VRX

Valeant Pharmaceuticals International, Inc.

4.13

29.75

LNG

Cheniere Energy, Inc.

1.72

15.06

SUNE

SunEdison, Inc.

0.80

3.51

CHTR

Charter Communications, Inc. Class A

1.54

2.84

PCLN

Priceline Group Inc

1.26

2.27

MU

Micron Technology, Inc.

0.86

1.99

ACT

Actavis Plc

1.68

1.94

EBAY

eBay Inc.

1.46

1.70

BIDU

Baidu, Inc. Sponsored ADR Class A

0.86

1.52

PAGP

Plains GP Holdings LP Class A

1.40

1.35

When investing in these crowded names, investors should perform particularly thorough due-diligence, since any losses will be magnified if hedge funds rush for the exits.

Historically, consensus bets have done worse than a passive portfolio with the same risk. Consequently, fund allocators should thoroughly investigate hedge fund managers’ crowding to avoid investing in a pool of undifferentiated bets destined to disappoint.

AlphaBetaWorks’ analytics assist in both tasks: Our sector crowding reports identify hedge fund herding in each equity sector. Our fund analytics measure hedge fund differentiation and identify skills that are strongly predictive of future performance.

Summary

  • There is both factor (systematic/market) and residual (idiosyncratic/security-specific) crowding of hedge funds’ long U.S. equity portfolios.
  • Hedge fund crowding is approximately 60% systematic and 40% stock-specific.
  • The main sources of systematic crowding are Market (Beta), Oil, and Industrials.
  • The main sources of idiosyncratic crowding are VRX, LNG, SUNE, and CHTR.
  • Allocators and fund followers should pay close attention to crowding: The crowded hedge fund portfolio has historically underperformed its passive alternative – investors would have made more by taking the same risks passively.
The information herein is not represented or warranted to be accurate, correct, complete or timely.
Past performance is no guarantee of future results.
Copyright © 2012-2015, AlphaBetaWorks, a division of Alpha Beta Analytics, LLC. All rights reserved.
Content may not be republished without express written consent.

The Impact of Fund Mean Reversion

Real-world restrictions on hedge fund investing wreak havoc on common allocation strategies

Common return measures fail to predict future hedge fund performance. More important, under typical allocation and withdrawal constraints, these failures due to mean reversion become more severe:

  • Portfolios based on top nominal returns and win/loss ratios tend to under-perform.
  • Portfolios based on top Sharpe ratios don’t outperform.
  • Portfolios based on predictive skill analytics and robust factor models continue to consistently outperform.

To illustrate, we follow the approach of our earlier pieces on hedge funds: Our dataset spans the long portfolios of all U.S. hedge funds active over the past 15 years that are tractable using 13F filings. Top- and bottom-performing portfolios are selected based on 36 months of performance history.

But here we impose realistic allocation constraints: a 6-month delay between holdings reporting and fund investment, plus a bi-annual window for investments into, or withdrawals from, hedge funds. For example, an allocator who wishes to invest in a fund using 12/31/2013 data can only do so on 6/30/2014 and cannot redeem until 12/31/2014. These practical liquidity restrictions deepen the impact of hedge fund mean reversion.

Hedge Fund Selection Using Nominal Returns

The following chart tracks two simulated funds of hedge funds. One contains the top-performing 5% and the other the bottom-performing 5% of hedge fund U.S. equity long books. We use a 36-month trailing performance look-back; investments are made with a six-month delay (as above):

Chart of the cumulative returns of hedge fund portfolios constructed from funds with the highest 5% and the lowest 5% 36-month trailing returns

Performance of Portfolios of Hedge Funds Based on High and Low Historical Returns

Cumulative Return (%)

Annual Return (%)

High Historical Returns

99.54

6.74

Low Historical Returns

125.12

7.92

High – Low Returns

-25.57

-1.18

The chart reveals several regimes of hedge fund mean reversion: In a monotonically increasing market, such as 2005-2007, relative nominal performance persists; funds with the highest systematic risk outperform. When the regime changes, however, they under-perform. At the end of 2008, the top nominal performers are those taking the lowest systematic risk. In 2009, as the regime changes again, these funds under-perform.

Hedge Fund Selection Using Sharpe Ratios

The following chart tracks portfolios of funds with the top 5% and bottom 5% Sharpe ratios:

Chart of the cumulative returns of hedge fund portfolios constructed from funds with the highest 5% and the lowest 5% 36-month trailing Sharpe ratios

Performance of Portfolios of Hedge Funds Based on High and Low Historical Sharpe Ratios

Cumulative Return (%)

Annual Return (%)

High Historical Sharpe Ratios

115.31

7.48

Low Historical Sharpe Ratios

115.52

7.49

High – Low Sharpe Ratios

-0.20

-0.01

Since Sharpe ratio simply re-processes nominal returns, and only partially adjusts for systematic risk, it also fails when market regimes change. However, it is less costly. While Sharpe ratio may not be predictive under practical constraints of hedge fund investing, at least (unlike nominal returns) it does little damage.

Hedge Fund Selection Using Win/Loss Ratios

The following chart tracks portfolios of funds with the top 5% and the bottom 5% win/loss ratios, related to the batting average. These are examples of popular non-parametric approaches to skill evaluation:

Chart of the cumulative returns of hedge fund portfolios constructed from funds with the highest 5% and the lowest 5% 36-month trailing win/loss ratios

Performance of Portfolios of Hedge Funds Based on High and Low Historical Win/Loss Ratios

Cumulative Return (%)

Annual Return (%)

High Historical Win/Loss Ratios

112.41

7.35

Low Historical Win/Loss Ratios

136.86

8.41

High – Low Win/Loss Ratios

-24.45

-1.06

The win/loss ratio suffers from the same challenges as nominal returns: Win/loss ratio favors funds with the highest systematic risk in the bullish regimes and funds with the lowest systematic risk in the bearish regimes. As with nominal returns, this can be predictive while market trends continue. When trends change, the losses are especially severe under liquidity constraints.

Hedge Fund Selection Using αReturns

Systematic (factor) returns that make up the bulk of portfolio volatility are the primary source of mean reversion. Proper risk adjustment with a robust risk model controls for factor returns; it addresses mean reversion and identifies residual returns due to security selection.

AlphaBetaWorks’ measure of residual security selection performance is αReturn – outperformance relative to a replicating factor portfolio. αReturn is also the return a portfolio would have generated if markets had been flat.

The following chart tracks portfolios of funds with the top 5% and the bottom 5% αReturns. These portfolios have matching factor exposures:

Chart of the cumulative returns of hedge fund portfolios constructed from funds with the highest 5% and the lowest 5% 36-month trailing returns from security selection (αReturns)

Performance of Portfolios of Hedge Funds Based on High and Low Historical αReturns

Cumulative Return (%)

Annual Return (%)

High Historical αReturns

144.33

8.72

Low Historical αReturns

104.25

6.97

High – Low αReturns

40.08

1.75

Even with the same 6-month investment delay and bi-annual liquidity constraints, long portfolios of the top stock pickers outperformed long portfolios of the bottom stock pickers by 40% cumulatively over the past 10 years.

This outperformance has been consistent. Indeed, top stock pickers (high αReturn funds) have continued to do well in recent years. Security selection results of the industry’s top talent are strong. Widespread discussions of the difficulty of generating excess returns in 2014 reflect the sorry state of commonly used risk and skill analytics.

Conclusions

  • Due to hedge fund mean reversion, yesterday’s nominal winners tend to become tomorrow’s nominal losers.
  • Under typical hedge fund liquidity constraints, mean reversion is aggravated. Funds of top performing hedge funds under-perform.
  • Re-processing nominal returns does not eliminate mean reversion:
    • Funds with top and bottom Sharpe ratios perform similarly;
    • Funds with top win/loss ratios underperform funds with bottom win/loss ratios.
  • Risk-adjusted returns from security selection (stock picking) persist. Robust skill analytics, such as αReturn, identify strong future stock pickers.
The information herein is not represented or warranted to be accurate, correct, complete or timely.
Past performance is no guarantee of future results.
Copyright © 2012-2015, 
AlphaBetaWorks, a division of Alpha Beta Analytics, LLC. All rights reserved.
Content may not be republished without express written consent.

Hedge Fund Mean Reversion

Our earlier articles explored hedge fund survivor (survivorship) bias and large fund survivor bias. These artifacts can nearly double nominal returns and overstate security selection (stock picking) performance by 80%. Due to these biases, future performance of the largest funds disappoints. The survivors and the largest funds have excellent past nominal performance, yet it is not predictive of their future returns due to hedge fund mean reversion, a special case of reversion toward the mean. Here we explore this phenomenon and its mitigation.

We follow the approach of our earlier pieces that analyzed hedge funds’ long U.S. equity portfolios (HF Aggregate). This dataset spans the long portfolios of all U.S. hedge funds active over the past 15 years that are tractable using 13F filings.

Mean Reversion of Nominal Hedge Fund Returns

To illustrate the mean reversion of nominal hedge fund returns, we have assembled hedge fund portfolios with the highest and lowest trailing 36-month performance and track these groups over the subsequent 36 months. This covers the past 15 years and considers approximately 100 such group pairs.

If strong historical performance is predictive, we should see future (ex-post, realized) outperformance of the best historical performers relative to the worst. This would support the wisdom of chasing the largest funds or the top-performing gurus.

The following chart tracks past and future performance of each group. The average subsequent performance of the historically best- and worst-performing long U.S. equity hedge fund portfolios is practically identical and similar to the market return. There is some difference in the distributions, however: highest performers’ subsequent returns are skewed to the downside; lowest performers’ subsequent returns are skewed to the upside:

Chart of the past and future performance of hedge fund groups with high and low historical 36-month returns, assembled monthly over the past 15 years.

Hedge Fund Performance Persistence: High and Low Historical Returns

Prior 36 Months Return (%)

Subsequent 36 Months Return (%)

High Historical Returns

52.84

28.17

Low Historical Returns

-11.43

28.33

Thus, nominal historical returns are not predictive of future performance. We will try a few simple metrics of risk-adjusted performance next to see if they prove more effective.

Sharpe Ratio and Mean Reversion of Returns

Sharpe ratio is a popular measure of risk-adjusted performance that attempts to account for risk using return volatility. The following chart tracks past and future performance of portfolios with the highest and lowest historical Sharpe ratios. The average future performance of the best- and worst-performing portfolios begins to diverge, though we have not tested this difference for statistical significance:

Chart of the past and future performance of hedge fund groups with high and low historical 36-month Sharpe ratios, assembled monthly over the past 15 years.

Hedge Fund Performance Persistence: High and Low Historical Sharpe Ratios

Prior 36 Months Return (%)

Subsequent 36 Months Return (%)

High Historical Sharpe Ratios

43.65

28.38

Low Historical Sharpe Ratios

-8.34

25.66

Note that portfolios with the highest historical Sharpe ratios perform similarly to the best and worst nominal performers in the first chart. However, portfolios with the lowest historical Sharpe ratios underperform by 2.5%. Sharpe ratio does not appear to predict high future performance, yet it may help guard against poor results.

Win/Loss Ratio and Mean Reversion of Returns

Sharpe ratio and similar parametric approaches make strong assumptions, including normality of returns. We try a potentially more robust non-parametric measure of performance free of these assumptions – the win/loss ratio, closely related to the batting average. The following chart tracks past and future performance of portfolios with the highest and lowest historical win/loss ratios. The relative future performance of the two groups is similar:

Chart of the past and future performance of hedge fund groups with high and low historical 36-month win/loss ratios, assembled monthly over the past 15 years.

Hedge Fund Performance Persistence: High and Low Historical Win/Loss Ratios

Prior 36 Months Return (%)

Subsequent 36 Months Return (%)

High Historical Win/Loss Ratios

26.93

27.59

Low Historical Win/Loss Ratios

1.70

26.53

Win/loss ratio does not appear to improve on the predictive ability of Sharpe ratio. In fact, both groups slightly underperform the low performers from the first chart above.

Persistence of Hedge Fund Security Selection Returns

Nominal returns and simple metrics that rely on nominal returns both suffer from mean reversion, since systematic (factor) returns responsible for the bulk of portfolio volatility are themselves mean reverting. Proper risk adjustment with a robust risk model that eliminates systematic risk factors and purifies residuals addresses this problem.

AlphaBetaWorks’ measure of this residual security selection performance is αReturn – outperformance relative to a replicating factor portfolio. αReturn is also the return a portfolio would have generated if markets had been flat. The following chart tracks past and future security selection performance of portfolios with the highest and lowest historical αReturns. The future security selection performance of the best and worst stock pickers diverges by over 10%:

Charts of the past and future security selection (residual, αReturn) performance of hedge fund groups with high and low historical 36-month security selection (residua) returns, assembled monthly over the past 15 years.

Hedge Fund Security Selection Performance Persistence: High and Low Historical αReturns

Prior 36 Months αReturn (%)

Subsequent 36 Months αReturn (%)

High Historical αReturns

60.90

5.65

Low Historical αReturns

-35.66

-4.58

Security Selection and Persistent Nominal Outperformance

Strong security selection performance and strong αReturns can always be turned into nominal outperformance. In fact, a portfolio with positive αReturns can be hedged to outperform any broad benchmark. Nominal outperformance is convenient and easy to understand. These are the returns that investors “can eat.”

The following chart tracks past and future nominal performance of portfolios with the highest and lowest historical αReturns, hedged to match U.S. Equity Market’s risk (factor exposures). Hedging preserved security selection returns and compounded them with market performance: future performance of the two groups diverges by over 11%:

Charts of the past and future performance of hedge fund groups with high and low historical 36-month security selection (residua) returns, assembled monthly over the past 15 years and hedged to match U.S. Market.

Hedge Fund Performance Persistence: High and Low Historical αReturns

Prior 36 Months Return (%)

Subsequent 36 Months Return (%)

High Historical αReturns

81.70

32.50

Low Historical αReturns

-28.93

21.41

Note that, similarly to Sharpe ratio, αReturn is most effective in identifying future under-performers.

Thus, with predictive analytics and a robust model, investors can not only identify persistently strong stock pickets but also construct portfolios with predictably strong nominal performance.

Conclusions

  • Due to hedge fund mean reversion, future performance of the best and worst nominal performers of the past is similar.
  • Re-processing nominal returns does not eliminate mean reversion. However, Sharpe ratio begins to identify future under-performers.
  • Risk-adjusted returns from security selection (stock picking) persist. A robust risk model can isolate these returns and identify strong future stock pickers.
  • Hedging can turn persistent security selection returns into outperformance relative to any benchmark:
    • A hedged portfolio of the best stock pickers persistently outperforms.
    • A hedged portfolio of the worst stock pickers persistently underperforms.
The information herein is not represented or warranted to be accurate, correct, complete or timely.
Past performance is no guarantee of future results.
Copyright © 2012-2015, 
AlphaBetaWorks, a division of Alpha Beta Analytics, LLC. All rights reserved.
Content may not be republished without express written consent.

Hedge Fund Crowding – Q4 2014

Hedge funds share a few systematic and idiosyncratic bets. These crowded bets are the main sources of the industry’s relative performance and of many individual funds’ returns. We survey risk factors and stocks responsible for the majority of hedge fund long U.S. equity herding during Q4 2014.

Investors should treat crowded ideas with caution: Due to the congestion of their hedge fund investor base, crowded stocks tend to be more volatile and are vulnerable to mass liquidation. In addition, consensus hedge fund bets have underperformed in the past.

Identifying Hedge Fund Crowding

This piece follows the approach of our earlier articles on fund crowding: We created a position-weighted portfolio (HF Aggregate) consisting of popular long U.S. equity holdings of all hedge funds with medium to low turnover that are tractable from quarterly position filings. We then analyzed HF Aggregate’s risk relative to U.S. Market (Russell 3000) using AlphaBetaWorks’ Statistical Equity Risk Model to identify sources of crowding. More background information and explanations of the terms used below are available in those earlier articles.

Hedge Fund Aggregate’s Risk

The Q4 2014 HF Aggregate had 3.0% estimated future annual tracking error relative to U.S. Market. Risk was primarily due to factor (systematic) bets:

The components of HF Aggregate’s relative risk on 12/31/2014 were the following:

 Source

Volatility (%)

Share of Variance (%)

Factor

2.23

56.32

Residual

1.96

43.68

Total

2.97

100.00

Systematic risk increased by a tenth from the previous quarter. We will see the factors behind this increase below.

With an estimated future tracking error near 3%, HF Aggregate continues to be nearly passive. HF Aggregate will have a very hard time earning a typical fee. Investors in a broadly diversified portfolio of long-biased hedge funds will likely struggle also.

Hedge Fund Factor (Systematic) Crowding

Below are HF Aggregate’s principal factor exposures (in red) relative to U.S. Market’s (in gray) as of 12/31/2014:

Chart of the factor exposures contributing most to the relative factor (systematic) risk of U.S. Hedge Fund Aggregate

Factor Exposures Contributing Most to the Relative Risk of U.S. Hedge Fund Aggregate

Of these bets, Market (Beta) and Oil are responsible for over 80% of the factor risk relative to U.S. Market. These are the main components of the 2.23% Factor Volatility in the first table:

Chart of the factors contributing most to the relative factor (systematic) variance of U.S. Hedge Fund Aggregate

Factors Contributing Most to Relative Factor Variance of U.S. Hedge Fund Aggregate

HF Aggregate has become more systematically crowded since Q3 2014. The following factors were the top contributors to the relative systematic risk on 12/31/2014:

Factor

Relative Exposure (%)

Portfoio Variance (%²)

Share of Systematic Variance (%)

Market

13.26

3.10

62.37

Oil Price

2.23

1.01

20.32

Finance

-7.49

0.43

8.65

Industrial

9.53

0.35

7.04

Utilities

-3.36

0.26

5.23

Other Factors -0.18

-3.62

Total 4.97

100.00

The increased factor risk during Q4 2014 was primarily due to a 2% increase in U.S. Market Exposure (Beta). After adding long oil exposure in Q3 2014 as the energy sector selloff intensified, hedge funds kept it steady through Q4.

Hedge Fund Residual (Idiosyncratic) Crowding

Turning to HF Aggregate’s residual variance relative to U.S. Market, eight stocks were responsible for over half of the relative residual risk:

Chart of the stocks contributing most to the relative residual (idiosyncratic) variance of U.S. Hedge Fund Aggregate

Stocks Contributing Most to Relative Residual Variance of U.S. Hedge Fund Aggregate

These stocks will be the primary drivers of HF Aggregate’s and of the most crowded firms’ returns. They will also be affected by the vagaries of capital flows into and out of hedge funds. Investors should be ready for seemingly inexplicable volatility in these names. They may be wonderful individual investments, but history is not on their side, since crowded bets have historically underperformed.

The list is mostly unchanged from the previous quarter:

Symbol

Name

Exposure (%)

Share of Idiosyncratic Variance (%)

LNG

Cheniere Energy, Inc.

1.70

15.73

AGN

Allergan, Inc.

3.53

9.51

VRX

Valeant Pharmaceuticals International, Inc.

2.35

9.18

CHTR

Charter Communications, Inc. Class A

1.80

3.88

HTZ

Hertz Global Holdings, Inc.

1.37

3.35

EBAY

eBay Inc.

1.91

3.27

MU

Micron Technology, Inc.

1.08

3.21

BIDU

Baidu, Inc. Sponsored ADR Class A

1.22

3.14

PCLN

Priceline Group Inc

1.29

2.43

SUNE

SunEdison, Inc.

0.63

2.29

When investing in these crowded names, investors should perform particularly thorough due-diligence, since any losses will be magnified when hedge funds rush for the exits.

Historically, consensus bets have done worse than a passive portfolio with the same risk. Consequently, fund allocators should thoroughly investigate hedge fund managers’ crowding to avoid investing in a pool of undifferentiated bets destined for disappointment.

AlphaBetaWorks’ analytics assist in both tasks: Our sector crowding reports identify hedge fund herding in each equity sector. Our fund reports measure hedge fund differentiation and skills that are strongly predictive of future performance.

Summary

  • There is both factor (systematic/market) and residual (idiosyncratic/security-specific) crowding of hedge funds’ long U.S. equity portfolios.
  • Hedge funds have become more systematically crowded during Q4 2014, primarily by increasing their Beta.
  • The main sources of idiosyncratic crowding are: LNG, AGN, VRX, CHTR, HTZ, EBAY, and MU.
  • The crowded hedge fund portfolio has historically underperformed its passive alternative. Investors would have made more by taking the same risk passively – hedge fund investors should pay close attention to crowding before allocating capital.
The information herein is not represented or warranted to be accurate, correct, complete or timely.
Past performance is no guarantee of future results.
Copyright © 2012-2015, AlphaBetaWorks, a division of Alpha Beta Analytics, LLC. All rights reserved.
Content may not be republished without express written consent.

Large Hedge Fund Survivor Bias

Why Size Isn’t Everything

Hedge fund survivor bias is especially insidious for the largest firms. Large hedge fund survivor bias overstates expected performance of the biggest firms by nearly half and their risk adjusted return from security selection (stock picking) by 80%. It is impossible to predict the largest funds of the future, but one doesn’t have to – robust skill analytics identify funds that will do even better in the future than tomorrow’s largest.

Past Performance of Today’s Largest Hedge Funds

We follow the approach of our earlier piece on hedge fund survivor (survivorship) bias, which analyzed firms’ long U.S. equity portfolios (HF Aggregate). This dataset spans the long portfolios of all hedge funds active over the past 10 years that are tractable using 13F filings.

We compare group returns to Factor Portfolio – a portfolio with matching factor (systematic) risk. Factor Portfolio captures the return of investing passively in ETFs and index futures with the same risk as the group. This comparison reveals security selection (stock picking) performance, or αReturn – outperformance relative to the Factor Portfolio and the return that would have been generated if markets had been flat.

The following chart compares the performance of the 20 largest U.S. equity hedge fund long portfolios (Large HFs, green) to the Factor Portfolio (black). The security selection performance, or αReturn (blue), is the difference between the two. This is the average past performance of the 20 largest funds of 2015:

Chart of the past total, factor, and residual returns of long U.S. equity portfolios of the 20 largest hedge funds of 2015

Current Largest Hedge Funds: Past Total, Factor, and Residual Long U.S. Equity Returns

Returns (%)

Annualized

10-year Cum.

Total

11.48

215.26

Factor

9.33

154.29

Total – Factor

2.15

60.97

Firms that have grown the largest over the past 10 years have performed exceptionally well: Including the effect of compounding, their long portfolios generated 61% higher return than their passive equivalents. If markets had been flat for the past 10 years, their long equity portfolios would have appreciated by nearly 25%.

The allure of this past performance arouses fund-following, guru-tracking, and billionaire portfolio strategies. But there is one problem: Today’s largest funds represent a top-performing sliver of the thousands of funds active in the past. Of the thousands of funds, some truly are skilled, but many simply got lucky on aggressive bets and became large as a result, irrespective of their skill. This constitutes large hedge fund survivor bias. This performance does not persist and tends to mean-revert.

Future Performance of Yesterday’s Largest Hedge Funds

Most billionaire and guru-following strategies make the assumption that the largest funds are likely to continue generating strong returns. To test this, we tracked the 20 largest long U.S. equity hedge fund portfolios of 2005. Below is the unappealing picture of their average performance:

Chart of the future total, factor, and residual returns of long U.S. equity portfolios of the 20 largest hedge funds of 2005

2005 Largest Hedge Funds: Future Total, Factor, and Residual Long U.S. Equity Returns

Returns (%)

Annualized

10-year Cum.

Total

7.70

116.05

Factor

8.68

138.11

Total – Factor

-0.97

-22.05

The 2005 Large HF Aggregate tracked Factor Portfolio closely until 2010 and has struggled since. Hence, including the effects of compounding, large hedge fund survivor bias overstated security selection returns by 80%.

Size does not always signal quality, nor does it guarantee future performance. Between 2005 and 2015, the forward-looking performance of the largest long hedge fund portfolios of 2005 was just over half the backward-looking performance of 2015’s largest. Why then would the largest hedge funds of 2015 perform differently than the poor showing of the 2005 vintage?

Predicting Top Future Hedge Funds: Stock Picking Skill

Absent a time machine, investors cannot know who will be the future stars. However, they need not despair. Instead of focusing on the largest or top-performing funds of the past, they can turn to those showing the highest evidence of skill. The following chart tracks the long U.S. equity portfolios of 20 hedge funds with the highest 3-year αReturn as of 12/31/2005:

Chart of the future total, factor, and residual returns of long U.S. equity portfolios of the 20 best stock picker hedge funds of 2005

Best 2005 Stock Picker Hedge Funds: Future Total, Factor, and Residual Long U.S. Equity Returns

Returns (%)

Annualized

10-year Cum.

Total

12.60

252.58

Factor

9.11

148.70

Total – Factor

3.49

103.88

The funds above were the best stock pickers of 2005, not the largest. If markets had been flat for the past 10 years, the top stock pickers of 2005 would have returned 40%. For a variety of reasons (scalability constraints, lifestyle preferences), many have not become the largest or best known, but their risk-adjusted returns are strong.

Since active management skills persist, skilled stock pickers of the past continue to generate strong nominal and risk-adjusted returns. The same analysis identifies today’s top stock pickers who will be tomorrow’s outperformers – and without the cost of a time machine!

Conclusions

  • Hedge fund survivor bias is larger for the largest hedge funds.
  • Between 2005 and 2015, large hedge fund survivor bias overstated expected nominal performance by nearly 100% and security selection performance by 80%.
  • Chasing large hedge funds is unnecessary and detrimental. Selecting a fund using robust skill analytics, as illustrated by αReturn, is superior to flawed results hampered by large hedge fund survivor bias.
The information herein is not represented or warranted to be accurate, correct, complete or timely.
Past performance is no guarantee of future results.
Copyright © 2012-2015, 
AlphaBetaWorks, a division of Alpha Beta Analytics, LLC. All rights reserved.
Content may not be republished without express written consent.