Tag Archives: hedge fund clustering

Hedge Fund Clustering in Q4 2015

Crowding consists of large capital pools chasing related strategies. Within the hedge fund industry, long equity portfolios crowd into several clusters with similar systematic (factor) and idiosyncratic (residual) bets. This hedge fund clustering is the internal structure of crowding. We illustrate the large-scale hedge fund clustering and crowded bets within the largest cluster. Allocators and fund followers without a handle on this phenomenon may be investing in an undifferentiated portfolio prone to liquidation, or paying high active fees for consensus factor exposures.

Hedge Fund Crowding and Hedge Fund Clustering

Our articles on hedge fund crowding analyze the factor (systematic) and residual (idiosyncratic) exposures of HF Aggregate, which consists of the long equity holdings of all U.S. hedge fund portfolios tractable from regulatory filings. Most analyses of crowding overlook bets shared by fund groups within the aggregate. To explore this internal structure of hedge fun crowding, in 2014 AlphaBetaWorks pioneered research on hedge fund clustering. Here we update this analysis with Q4 2015 holdings data.

Hedge Fund Clusters

Note that simplistic analysis of holdings overlap fails to measure fund similarity. Since their variance is overwhelmingly systematic, two funds with no overlapping positions but similar factor exposures can track each other closely. To identify clusters of funds without these deficiencies, we analyze factor and residual exposures of every portfolio relative to every other portfolio using the AlphaBetaWorks’ Statistical Equity Risk Model, a proven tool for forecasting portfolio risk and future performance. For each portfolio pair we estimate the future relative volatility (tracking error). The lower the expected relative tracking error between two funds, the more similar they are to each other.

Once each hedge fund pair is analyzed – hundreds of thousands of factor-based risk analyses – we find funds with similar exposures and build clusters (related to phylogenic trees, or family trees) of funds. We use agglomerative hierarchical clustering with estimated future relative tracking error as the metric of differentiation or dissimilarity. The resulting clusters capture similarities of all analyzable U.S. hedge fund long equity portfolios:

Chart of hedge fund clustering for U.S. long equity portfolios in Q4 2015

Clusters of U.S. Hedge Funds’ Long Equity Portfolios in Q4 2015

The largest cluster contains approximately 40 funds. It and other large clusters warrant careful scrutiny by allocators: those invested in a portfolio of clustered funds may be paying high active fees for a handful of consensus factor and stock-specific bets.

The AQR-Adage Hedge Fund Cluster

The AQR-Adage Cluster, named after two of its large and similar members, has recently been the largest cluster of hedge funds’ long equity portfolios:

Chart of hedge fund clustering within the largest cluster of U.S. Hedge Funds’ Q4 2015 Long Equity Portfolios

The Largest Hedge Fund Long Equity Portfolio Cluster in Q4 2015

A flat diagram illustrates the distances (estimated future tracking errors) between its members:

Chart of the flat view of clustering within the AQR-Adage cluster of U.S. Hedge Funds’ Q4 2015 Long Equity Portfolios

The AQR-Adage Long Equity Portfolio Cluster in Q4 2015

This cluster’s aggregate portfolio is similar to the U.S. equity market. We estimate only 1.8% tracking error of the AQR-Adage Cluster relative to the Russell 3000 Index.

Source Volatility (ann. %) Share of Variance (%)
Factor 1.26 48.23
Residual 1.31 51.77
Total 1.82 100.00

Put differently, we expect this cluster’s aggregate annual long portfolio return to differ from the market by more than 1.8% only about a third of the time.

AQR-Adage Cluster’s Factor (Systematic) Crowding

Below are this cluster’s significant factor exposures (in red) relative to the Russell 3000’s exposures (in gray):

Chart of exposures to the risk factors contributing most to the risk of the Q4 2015 AQR-Adage hedge fund long equity portfolio cluster relative to the U.S. Market

Factor Exposures of the AQR-Adage Hedge Fund Cluster in Q4 2015

Market (high-beta) and Size (small-cap) are the primary sources of the relative factor risk:

Chart of contributions to the relative factor (systematic) variance of the risk factors contributing most to the risk of the Q4 2015 AQR-Adage hedge fund long equity portfolio cluster relative to the U.S. Market

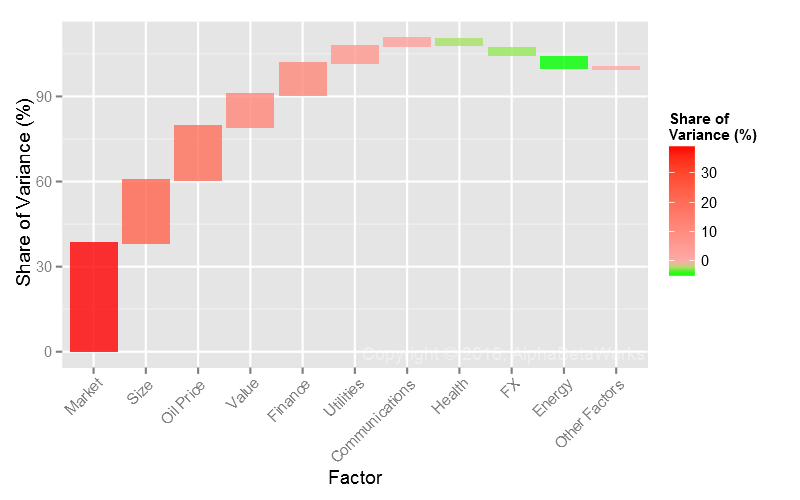
Factors Contributing Most to Relative Variance of the AQR-Adage Hedge Fund Cluster in Q4 2015

Factor Relative Exposure Factor Volatility Share of Relative Factor Variance Share of Relative Total Variance
Market 5.31 12.46 38.20 18.42
Size -8.23 8.09 22.14 10.68
Oil Price 1.42 29.43 18.84 9.09
Value -3.90 12.91 11.29 5.44
Finance -6.56 5.08 11.05 5.33
Utilities -2.21 11.28 6.05 2.92
Communications -1.18 11.98 2.79 1.35
Health -1.57 7.22 -2.97 -1.43
FX 1.50 7.28 -3.29 -1.59
Energy -2.07 11.77 -4.56 -2.20

(Relative exposures and relative variance contribution. All values are in %. Volatility is annualized.)

AQR-Adage Cluster’s Factor Crowding Stress Tests

AQR-Adage Cluster’s Maximum Outperformance

Given the AQR-Adage Cluster’s macroeconomic positioning (Long Market, Short Finance, Value, and Size), it would experience its highest outperformance in an environment similar to the 1999-2000 dot-com boom:

Chart of the cumulative factor (systematic) return for the historical scenario that would generate the larger relative outperformance for the AQR-Adage Hedge Fund Cluster in Q4 2015

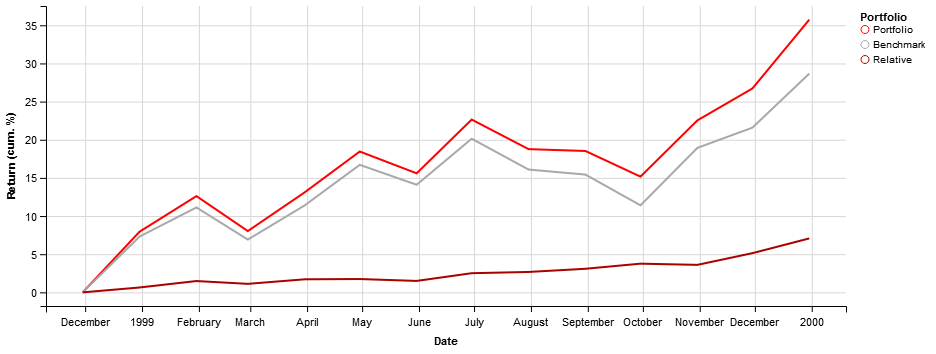
Historical Scenario that Would Generate the Highest Relative Performance for the AQR-Adage Hedge Fund Cluster in Q4 2015

Factor Return Portfolio Exposure Benchmark Exposure Relative Exposure Portfolio Return Benchmark Return Relative Return
Market 31.52 107.31 102.00 5.31 34.06 32.21 1.85
Finance -19.62 12.76 19.32 -6.56 -2.62 -3.95 1.33
Oil Price 128.16 0.42 -1.00 1.42 0.39 -0.93 1.32
Size -10.49 -9.11 -0.88 -8.23 0.96 0.09 0.87
Value -21.96 -4.05 -0.15 -3.90 0.90 0.03 0.87

AQR-Adage Cluster’s Maximum Underperformance

These exposures would deliver the AQR-Adage Cluster its highest underperformance in an environment similar to the 2000-2001 .com crash:

Chart of the cumulative factor (systematic) return for the historical scenario that would generate the larger relative underperformance for the AQR-Adage Hedge Fund Cluster in Q4 2015

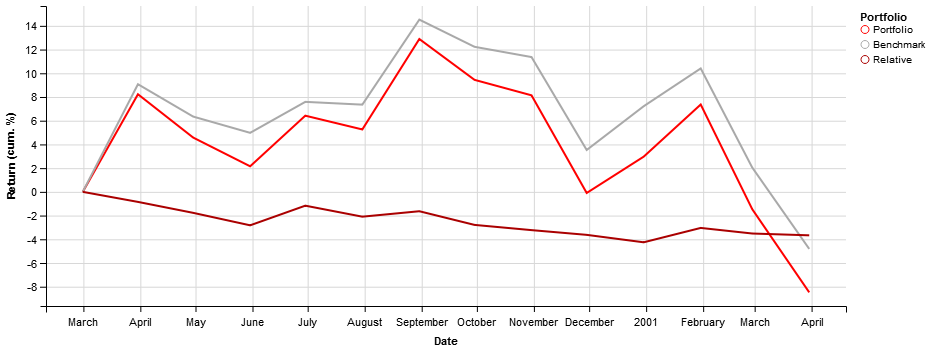
Historical Scenario that Would Generate the Lowest Relative Performance for the AQR-Adage Hedge Fund Cluster in Q4 2015

Factor Return Portfolio Exposure Benchmark Exposure Relative Exposure Portfolio Return Benchmark Return Relative Return
Finance 47.97 12.76 19.32 -6.56 5.39 8.24 -2.85
Value 86.46 -4.05 -0.15 -3.90 -2.67 -0.10 -2.57
Utilities 52.32 0.98 3.19 -2.21 0.45 1.46 -1.01
Market -14.21 107.31 102.00 5.31 -15.30 -14.51 -0.79
Energy 33.72 2.47 4.54 -2.07 0.77 1.43 -0.65

AQR-Adage Cluster Residual (Idiosyncratic) Crowding

The stock-specific bets of the AQR-Adage Cluster have grown more crowded as the idiosyncratic volatility of several crowded longs spiked recently. Four stocks account for most of its relative residual risk:

Chart of contributions to the relative residual (idiosyncratic) variance of the stocks contributing most to the risk of the Q4 2015 AQR-Adage hedge fund long equity portfolio cluster relative to U.S. Market

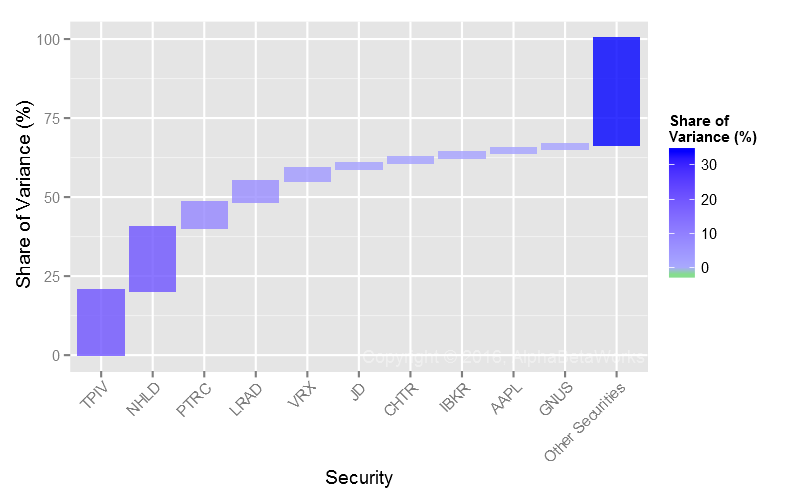
Stocks Contributing Most to Relative Residual Variance of the AQR-Adage Hedge Fund Cluster in Q4 2015

Symbol Name Relative Exposure Residual Volatility Share of Relative Residual Variance Share of Relative Total Variance
TPIV TapImmune Inc. 0.41 125.70 20.11 9.21
NHLD National Holdings Corporation 0.75 68.38 20.05 9.18
PTRC Petro River Oil Corp. 0.22 151.46 8.05 3.69
LRAD LRAD Corporation 0.76 38.81 6.69 3.06
VRX Valeant Pharmaceuticals International, Inc. 0.51 43.72 3.82 1.75
JD JD.com, Inc. Sponsored ADR Class A 0.49 31.91 1.86 0.85
CHTR Charter Communications, Inc. Class A 0.75 20.31 1.76 0.81
IBKR Interactive Brokers Group, Inc. Class A 0.71 19.64 1.47 0.67
AAPL Apple Inc. -0.81 16.25 1.33 0.61
GNUS Genius Brands International, Inc. 0.12 103.74 1.21 0.56

(Relative exposures and relative variance contribution. All values are in %. Volatility is annualized.)

Idiosyncratic crowding is not the main problem with this cluster, since the expected idiosyncratic tracking error is low (around 1.3%). However, it is vital for fund followers, as it helps explain unexpected volatility in the most crowded names. In fact, several of the crowded names above have shown signs of mass liquidation. It is also worth noting that the crowded names’ from earlier in 2015 presaged subsequent disasters. Valeant Pharmaceuticals (VRX), Micron, Inc. (MU), and Cheniere Natural Gas (LNG) were all featured in our crowding work.

Passivity is a bigger problem still, since allocators to diversified portfolios of hedge funds within this cluster may be paying high fees for a few consensus bets.

Summary

  • An analysis of the underlying structure of hedge fund crowding reveals hedge fund clustering – groups of portfolios with similar bets.
  • The largest cluster’s factor herding is towards Market (high-beta), short Size (small-cap), and four stock-specific bets (TPIV, NHLD, PTRC, and LRAD).
  • Allocators and fund followers unaware of clustering may find themselves in a nearly passive factor portfolio and a handful of consensus stock-specific bets.

The information herein is not represented or warranted to be accurate, correct, complete or timely.
Past performance is no guarantee of future results.
Copyright © 2012-2016, 
AlphaBetaWorks, a division of Alpha Beta Analytics, LLC. All rights reserved.
Content may not be republished without express written consent.

Hedge Fund Energy Clustering: Q2 2015

Fund crowding consists of investment bets shared by groups of funds. Long hedge fund portfolios crowd into clusters with similar systematic (factor) and idiosyncratic (residual) bets. This clustering exists for the aggregate market and for individual sectors; it is the internal structure of hedge fund crowding.

This piece surveys hedge fund clustering in the energy sector and examines the largest hedge fund energy cluster in which:

  • Factor crowding is due to high exposures to two factors;
  • Residual crowding is primarily due to six stock-specific bets.

Allocators who are unaware of hedge fund clustering and exposures within these clusters may be paying active fees for high passive risk. These investors will suffer in periods of stress.

Hedge Fund Crowding and Hedge Fund Clustering

Several of our earlier articles on hedge fund crowding analyzed the factor (systematic) and residual (idiosyncratic) bets of HF Aggregate, which consists of the equity holdings of long U.S. hedge fund portfolios tractable from regulatory filings.

Analysis of the overall hedge fund crowding does not address bets shared by fund groups within the aggregate, nor does it consider the crowding within market sectors. To explore this internal structure of hedge fun crowding we pioneered the study of hedge fund clustering. Our 2014 work proved predictive and invaluable to allocators. This piece dives deeper, focusing on hedge fund clustering in the energy sector in Q2 2015.

Hedge Fund Energy Clusters

To explore hedge fund energy clustering we analyze long energy sector portfolios of all hedge funds that are analyzable using regulatory filings. We then exclude funds with insignificant energy holdings. We use the AlphaBetaWorks Statistical Equity Risk Model, a proven tool for forecasting portfolio risk and performance. For each portfolio pair we estimate the future relative volatility (tracking error). The lower the expected relative tracking error between funds, the more similar they are to each other.

Once each hedge fund pair is analyzed we identify groups of funds with like exposures and build clusters (similar to phylogenic trees, or family trees) of the funds’ long portfolios. We use agglomerative hierarchical clustering with estimated future relative tracking error as the metric of differentiation or dissimilarity:

Chart of clustering of U.S. Hedge Funds’ Q2 2015 Long Equity Energy Sector Portfolios

Clusters of U.S. Hedge Funds’ Long Energy Sector Equity Portfolios: Q2 2015

The largest hedge fund energy sector cluster contains approximately 20 funds. Its members share similar systematic and idiosyncratic energy bets that we will now analyze in detail.

The Gateway-San Francisco Sentry Energy Cluster

The largest cluster is the Gateway-San Francisco Sentry Cluster, named after two of its large members with similar long energy bets: Gateway Investment Advisers LLC and San Francisco Sentry Investment Group:

Chart of clustering within the largest cluster of U.S. Hedge Funds’ Q2 2015 Long Equity Energy Sector Portfolios

The Largest Hedge Fund Long Energy Equity Portfolio Cluster: Q2 2015

A flat diagram of the cluster better illustrates the distances (estimated future tracking errors) among its members:

Chart of the flat view of the chart of clustering within the Gateway-San Francisco Sentry cluster of U.S. Hedge Funds’ Q2 2015 Long Energy Equity Portfolios

Flat View of the Gateway-San Francisco Sentry Long Energy Equity Portfolio Cluster: Q2 2015

About two thirds of this cluster’s risk relative to the (Market) Energy Aggregate (a capitalization-weighted portfolio of all U.S. energy stocks) comes from factor exposures:

Source Volatility (%) Share of Variance (%)
Factor 4.08 66.93
Residual 2.87 33.07
Total 4.99 100.00

We expect this cluster’s aggregate annual return to differ from the Energy Aggregate’s annual return by more than 5.0% only about a third of the time. We expect its factor (systematic) return to differ from the Energy Aggregate by more than 4.1% about a third of the time. In other words, this cluster will stand out from the Market Energy Portfolio little. When it does, this will be primarily due to high factor (systematic) risk that investors can purchase with cheap passive instruments. In fact, we show below that the cluster largely turns out to be a 1.2x levered version of the Market Energy Aggregate.

Gateway-San Francisco Sentry Energy Cluster’s Factor (Systematic) Crowding

Below are this cluster’s significant factor exposures (in red) relative to the Energy Aggregate (in gray):

Chart of exposures to the risk factors contributing most to the risk of the Gateway-San Francisco Sentry hedge fund long energy sector equity portfolio cluster relative to the U.S. Energy Sector Market Aggregate

Factor Exposures of the Gateway-San Francisco Sentry Energy Portfolio Cluster

Market (high market beta) and Energy (high energy sector beta) exposures are responsible for almost 90% of this cluster’s relative factor risk:

Chart of contributions to the relative factor (systematic) variance of the risk factors contributing most to the risk of the Gateway-San Francisco Sentry hedge fund long energy sector equity portfolio cluster relative to the U.S. Energy Sector Market Aggregate

Factors Contributing Most to Relative Variance of the Gateway-San Francisco Sentry Energy Portfolio Cluster

Factor Portfolio Relative Exposure (%) Factor Volatility (%) Portfolio Relative Factor Variance (%²) Share of Total Factor Variance (%)
Energy 18.56 12.63 7.83 47.01
Market 20.55 11.16 6.77 40.63
Oil Price 2.31 31.38 2.33 13.98
FX -3.54 7.71 0.76 4.58
Value 5.97 13.45 0.70 4.19
Size 2.63 8.00 -0.18 -1.06
Bond Index 23.48 3.37 -1.55 -9.32
Other Factors 0.00 0.00
Total 16.66 100.00

Funds in the cluster are currently taking and have tended to take 10-20% more sector risk and market risk than the Energy Aggregate. This is significant crowding towards higher systematic risk: The cluster will outperform when market and energy sector returns are positive simply due to high factor exposures. It will suffer in periods of stress.

Gateway-San Francisco Sentry Energy Cluster’s Residual (Idiosyncratic) Crowding

Six stocks in the Gateway-San Francisco Sentry Portfolio Cluster are responsible for over half of the relative residual risk. This crowding away from the majors (XOM and CVX) with low systematic risk and towards higher-risk independents helps explain high factor exposures:

Chart of contributions to the relative residual (idiosyncratic) variance of the stocks contributing most to the risk of the Gateway-San Francisco Sentry hedge fund long energy sector equity portfolio cluster relative to the U.S. Energy Sector Market Aggregate

Stocks Contributing Most to Relative Residual Variance of the Gateway-San Francisco Sentry Energy Portfolio Cluster

Symbol Name Relative Exposure (%) Residual Volatility (%) Portfolio Relative Residual Variance (%²) Share of Total Residual Variance (%)
XOM  Exxon Mobil Corporation -14.52 14.45 1.31 15.93
WLB  Westmoreland Coal Company 2.21 48.07 0.72 8.78
CHK  Chesapeake Energy Corporation 3.50 37.10 0.67 8.10
TSO  Tesoro Corporation 2.92 36.16 0.61 7.41
NBL  Noble Energy Inc. 4.54 27.04 0.48 5.81
SXCP  SunCoke Energy Partners LP 2.86 25.72 0.37 4.47
SXC  SunCoke Energy Inc. 2.60 36.02 0.37 4.46
VLO  Valero Energy Corporation -2.27 33.28 0.36 4.35
APC  Anadarko Petroleum Corporation 3.64 26.63 0.32 3.87
HFC  HollyFrontier Corporation 2.09 34.08 0.31 3.80
BBG  Bill Barrett Corporation 1.65 45.92 0.28 3.39
AR  Antero Resources Corporation 2.71 33.79 0.26 3.17
CVX  Chevron Corporation -6.39 17.84 0.26 3.14
OGZPY  Public Joint-Stock Company Gazprom 1.97 33.89 0.20 2.44
WPZ  Williams Partners L.P. -2.24 21.12 0.18 2.16
CVI  CVR Energy Inc. 1.14 41.06 0.15 1.84
AHGP  Alliance Holdings GP L.P. 2.07 21.94 0.15 1.76
EOG  EOG Resources Inc. -2.09 25.87 0.14 1.72
COP  ConocoPhillips -3.19 21.17 0.13 1.60
FANG  Diamondback Energy Inc. 1.45 35.29 0.09 1.07
 Other Positions -4.67 0.88 10.73
Total 8.23 100

Idiosyncratic crowding is not the main problem for investors in the cluster – systematic crowding into higher factor exposures is a bigger challenge: Allocators are at risk of paying high fees for mostly passive factor portfolios with high energy and market exposures.

Summary

  • An analysis of the underlying structure of hedge fund crowding reveals hedge fund clustering – groups of portfolios with similar bets.
  • Hedge fund clustering exists across aggregate and sector-specific portfolios.
  • The largest hedge fund energy cluster’s factor herding is towards high Market (high market beta) and high Energy (high energy sector beta) exposures.
  • This cluster’s residual herding is away from XOM and towards WLB, CHK, TSO, NBL, and SXCP.
  • Allocators unaware of their funds’ clustering may be exposed to unexpectedly high systematic risk due to factor crowding, costly in periods of stress.
The information herein is not represented or warranted to be accurate, correct, complete or timely.
Past performance is no guarantee of future results.
Copyright © 2012-2015, 
AlphaBetaWorks, a division of Alpha Beta Analytics, LLC. All rights reserved.
Content may not be republished without express written consent.


Hedge Fund Clustering: Q2 2015 Update

Fund crowding consists of investment bets shared by groups of funds – large pools of capital chasing similar strategies. Within the hedge fund industry, long equity portfolios crowd into several clusters with similar systematic (factor) and idiosyncratic (residual) bets. This hedge fund clustering is the internal structure of hedge fund crowding.

This piece illustrates the large-scale hedge fund clustering and examines the largest hedge fund cluster in which:

  • Factor crowding is due to two factors;
  • Residual crowding is moderate and four stock-specific bets stand out.

Allocators who are unaware of hedge fund clustering and hedge fund crowding may be invested in an undifferentiated portfolio, paying active fees for passive factor exposure.

Hedge Fund Crowding and Hedge Fund Clustering

Several of our earlier articles on hedge fund crowding analyzed the factor (systematic) and residual (idiosyncratic) bets of HF Aggregate, which consists of the popular equity holdings of all long U.S. hedge fund portfolios tractable from regulatory filings.

Analysis of overall industry crowding does not address bets shared by fund groups within the aggregate. To explore this internal structure of hedge fun crowding – clusters of funds with shared systematic (factor) and idiosyncratic (residual) bets – in 2014 we released pioneering research on hedge fund clustering. The 2014 work proved predictive and invaluable to allocators. This piece updates the analysis of hedge fund clustering with Q2 2015 holdings data.

Hedge Fund Clusters

To explore hedge fund clustering we analyze long portfolios of every pair of hedge funds analyzable using regulatory filings using the AlphaBetaWorks’ Statistical Equity Risk Model, a proven tool for forecasting portfolio risk and future performance. For each portfolio pair we estimate the future relative volatility (tracking error). The lower the expected relative tracking error between two funds, the more similar they are to each other.

Once each hedge fund pair is analyzed – hundreds of thousands of factor-based risk analyses – we identify groups of funds with similar factor and residual exposures and build clusters (similar to phylogenic trees, or family trees) of the funds’ long portfolios. We use agglomerative hierarchical clustering with estimated future relative tracking error as the metric of differentiation or dissimilarity. The result is a picture of clustering among all analyzable U.S. hedge funds’ long portfolios:

Chart of clustering of U.S. Hedge Funds’ Q2 2015 Long Equity Portfolios

Clusters of U.S. Hedge Funds’ Long Equity Portfolios: Q2 2015

The largest cluster contains approximately 50 funds. A number of portfolios had exposures that were so similar, we expect their relative annual volatility to be under 3% – their annual returns should differ from one another by less than 3% about two thirds of the time.

This is critical for allocators: if they are invested in clustered funds, they may be paying high active fees for a handful of passive factor bets and consensus stock picks.

The AQR-Adage Hedge Fund Cluster

The largest cluster is currently the AQR-Adage Cluster, named after two of its large members with similar long exposures:

Chart of clustering within the largest cluster of U.S. Hedge Funds’ Q2 2015 Long Equity Portfolios

The Largest Hedge Fund Long Equity Portfolio Cluster: Q2 2015

A flat diagram of the cluster better illustrates the distances (estimated future tracking errors) between its members:

Chart of the flat view of the chart of clustering within the AQR-Adage cluster of U.S. Hedge Funds’ Q2 2015 Long Equity Portfolios

Flat View of the AQR-Adage Long Equity Portfolio Cluster: Q2 2015

In aggregate, this cluster’s risk is very close to that of the U.S. equity market. We estimate the AQR-Adage Cluster’s expected tracking error relative to the Russell 3000 Index at 1.4%.

Source

Volatility (%)

Share of Variance (%)

Factor

0.97

48.18

Residual

1.01

51.82

Total

1.40

100.00

Put differently, we expect this cluster’s aggregate long portfolio return to differ from the market by more than 1.4% only about a third of the time.

AQR-Adage Cluster Factor (Systematic) Crowding

Below are this cluster’s significant factor exposures (in red) relative to the Russell 3000’s exposures (in gray):

Chart of exposures to the risk factors contributing most to the risk of the AQR-Adage hedge fund long equity portfolio cluster relative to the U.S. Market

Factor Exposures of the AQR-Adage Hedge Fund Cluster: Q2 2015

Market (high-beta) and Size (small-cap) exposures are responsible for most of this cluster’s relative factor risk:

Chart of contributions to the relative factor (systematic) variance of the risk factors contributing most to the risk of the AQR-Adage hedge fund long equity portfolio cluster relative to the U.S. Market

Factors Contributing Most to Relative Variance of the AQR-Adage Hedge Fund Cluster: Q2 2015

Factor

Relative Exposure (%)

Portfolio Variance (%²)

Share of Systematic Variance (%)

Market

5.18

0.44

46.48

Size

-4.65

0.16

16.46

Oil Price

0.90

0.15

15.38

Finance

-5.61

0.12

12.19

Utilities

-2.58

0.10

10.29

Other Factors

-0.03

-0.80

Total

0.94

100.00

AQR-Adage Cluster Residual (Idiosyncratic) Crowding

There is less residual crowding in the AQR-Adage Cluster than in HF Aggregate. For HF Aggregate, just three stocks were responsible for over half of the relative residual risk in Q2 2015. By contrast, in the AQR-Adage Cluster, four stocks are responsible for approximately a quarter of the relative residual risk:

Chart of contributions to the relative residual (idiosyncratic) variance of the stocks contributing most to the risk of the AQR-Adage hedge fund long equity portfolio cluster relative to the U.S. Market

Stocks Contributing Most to Relative Residual Variance of the AQR-Adage Hedge Fund Cluster: Q2 2015

Symbol Name

Exposure (%)

Share of Idiosyncratic Variance (%)

AAPL Apple Inc.

-1.67

8.34

CHTR Charter Communications, Inc. Class A

1.09

5.97

FOLD Amicus Therapeutics, Inc.

0.35

5.60

SBAC SBA Communications Corporation

1.40

3.57

PCRX Pacira Pharmaceuticals, Inc.

0.37

2.56

LBTYK Liberty Global Plc Class C

1.08

2.47

SQBG Sequential Brands Group, Inc.

0.09

2.16

BAC Bank of America Corporation

-0.73

1.71

VRX Valeant Pharmaceuticals International, Inc.

0.50

1.66

LVLT Level 3 Communications, Inc.

0.41

1.45

Crowding within the AQR-Adage Cluster may not affect AAPL, CHTR, FOLD, and SBAC. However, these consensus bets will be the key contributors to the active returns of the AQR-Adage Cluster and many members. These stocks will also be the key drivers of some allocators’ idiosyncratic performance.

Idiosyncratic crowding is not the main problem with the cluster, since the expected idiosyncratic tracking error is low. Passivity is a bigger problem: Allocators to diversified portfolios of hedge funds within this cluster may be paying high fees for what’s effectively an index fund of passive factor bets. Closet indexing may be practiced by 70% of “active” U.S. mutual fund capital, but the high fees charged by hedge funds make fund differentiation especially important.

Summary

  • An analysis of the underlying structure of hedge fund crowding reveals hedge fund clustering – groups of portfolios with similar bets.
  • The largest hedge fund cluster consists of approximately 50 funds with shared factor and residual exposures.
  • The largest cluster’s factor herding is towards Market (high-beta) and short Size (small-cap) exposures.
  • This cluster’s residual herding is away from AAPL and towards CHTR, FOLD, and SBAC.
  • Allocators unaware of the clustering of their funds may be paying active fees for an effectively passive factor portfolio.
The information herein is not represented or warranted to be accurate, correct, complete or timely.
Past performance is no guarantee of future results.
Copyright © 2012-2015, 
AlphaBetaWorks, a division of Alpha Beta Analytics, LLC. All rights reserved.
Content may not be republished without express written consent.