Tag Archives: beta

Hedge Fund Crowding – Q4 2014

Hedge funds share a few systematic and idiosyncratic bets. These crowded bets are the main sources of the industry’s relative performance and of many individual funds’ returns. We survey risk factors and stocks responsible for the majority of hedge fund long U.S. equity herding during Q4 2014.

Investors should treat crowded ideas with caution: Due to the congestion of their hedge fund investor base, crowded stocks tend to be more volatile and are vulnerable to mass liquidation. In addition, consensus hedge fund bets have underperformed in the past.

Identifying Hedge Fund Crowding

This piece follows the approach of our earlier articles on fund crowding: We created a position-weighted portfolio (HF Aggregate) consisting of popular long U.S. equity holdings of all hedge funds with medium to low turnover that are tractable from quarterly position filings. We then analyzed HF Aggregate’s risk relative to U.S. Market (Russell 3000) using AlphaBetaWorks’ Statistical Equity Risk Model to identify sources of crowding. More background information and explanations of the terms used below are available in those earlier articles.

Hedge Fund Aggregate’s Risk

The Q4 2014 HF Aggregate had 3.0% estimated future annual tracking error relative to U.S. Market. Risk was primarily due to factor (systematic) bets:

The components of HF Aggregate’s relative risk on 12/31/2014 were the following:

 Source

Volatility (%)

Share of Variance (%)

Factor

2.23

56.32

Residual

1.96

43.68

Total

2.97

100.00

Systematic risk increased by a tenth from the previous quarter. We will see the factors behind this increase below.

With an estimated future tracking error near 3%, HF Aggregate continues to be nearly passive. HF Aggregate will have a very hard time earning a typical fee. Investors in a broadly diversified portfolio of long-biased hedge funds will likely struggle also.

Hedge Fund Factor (Systematic) Crowding

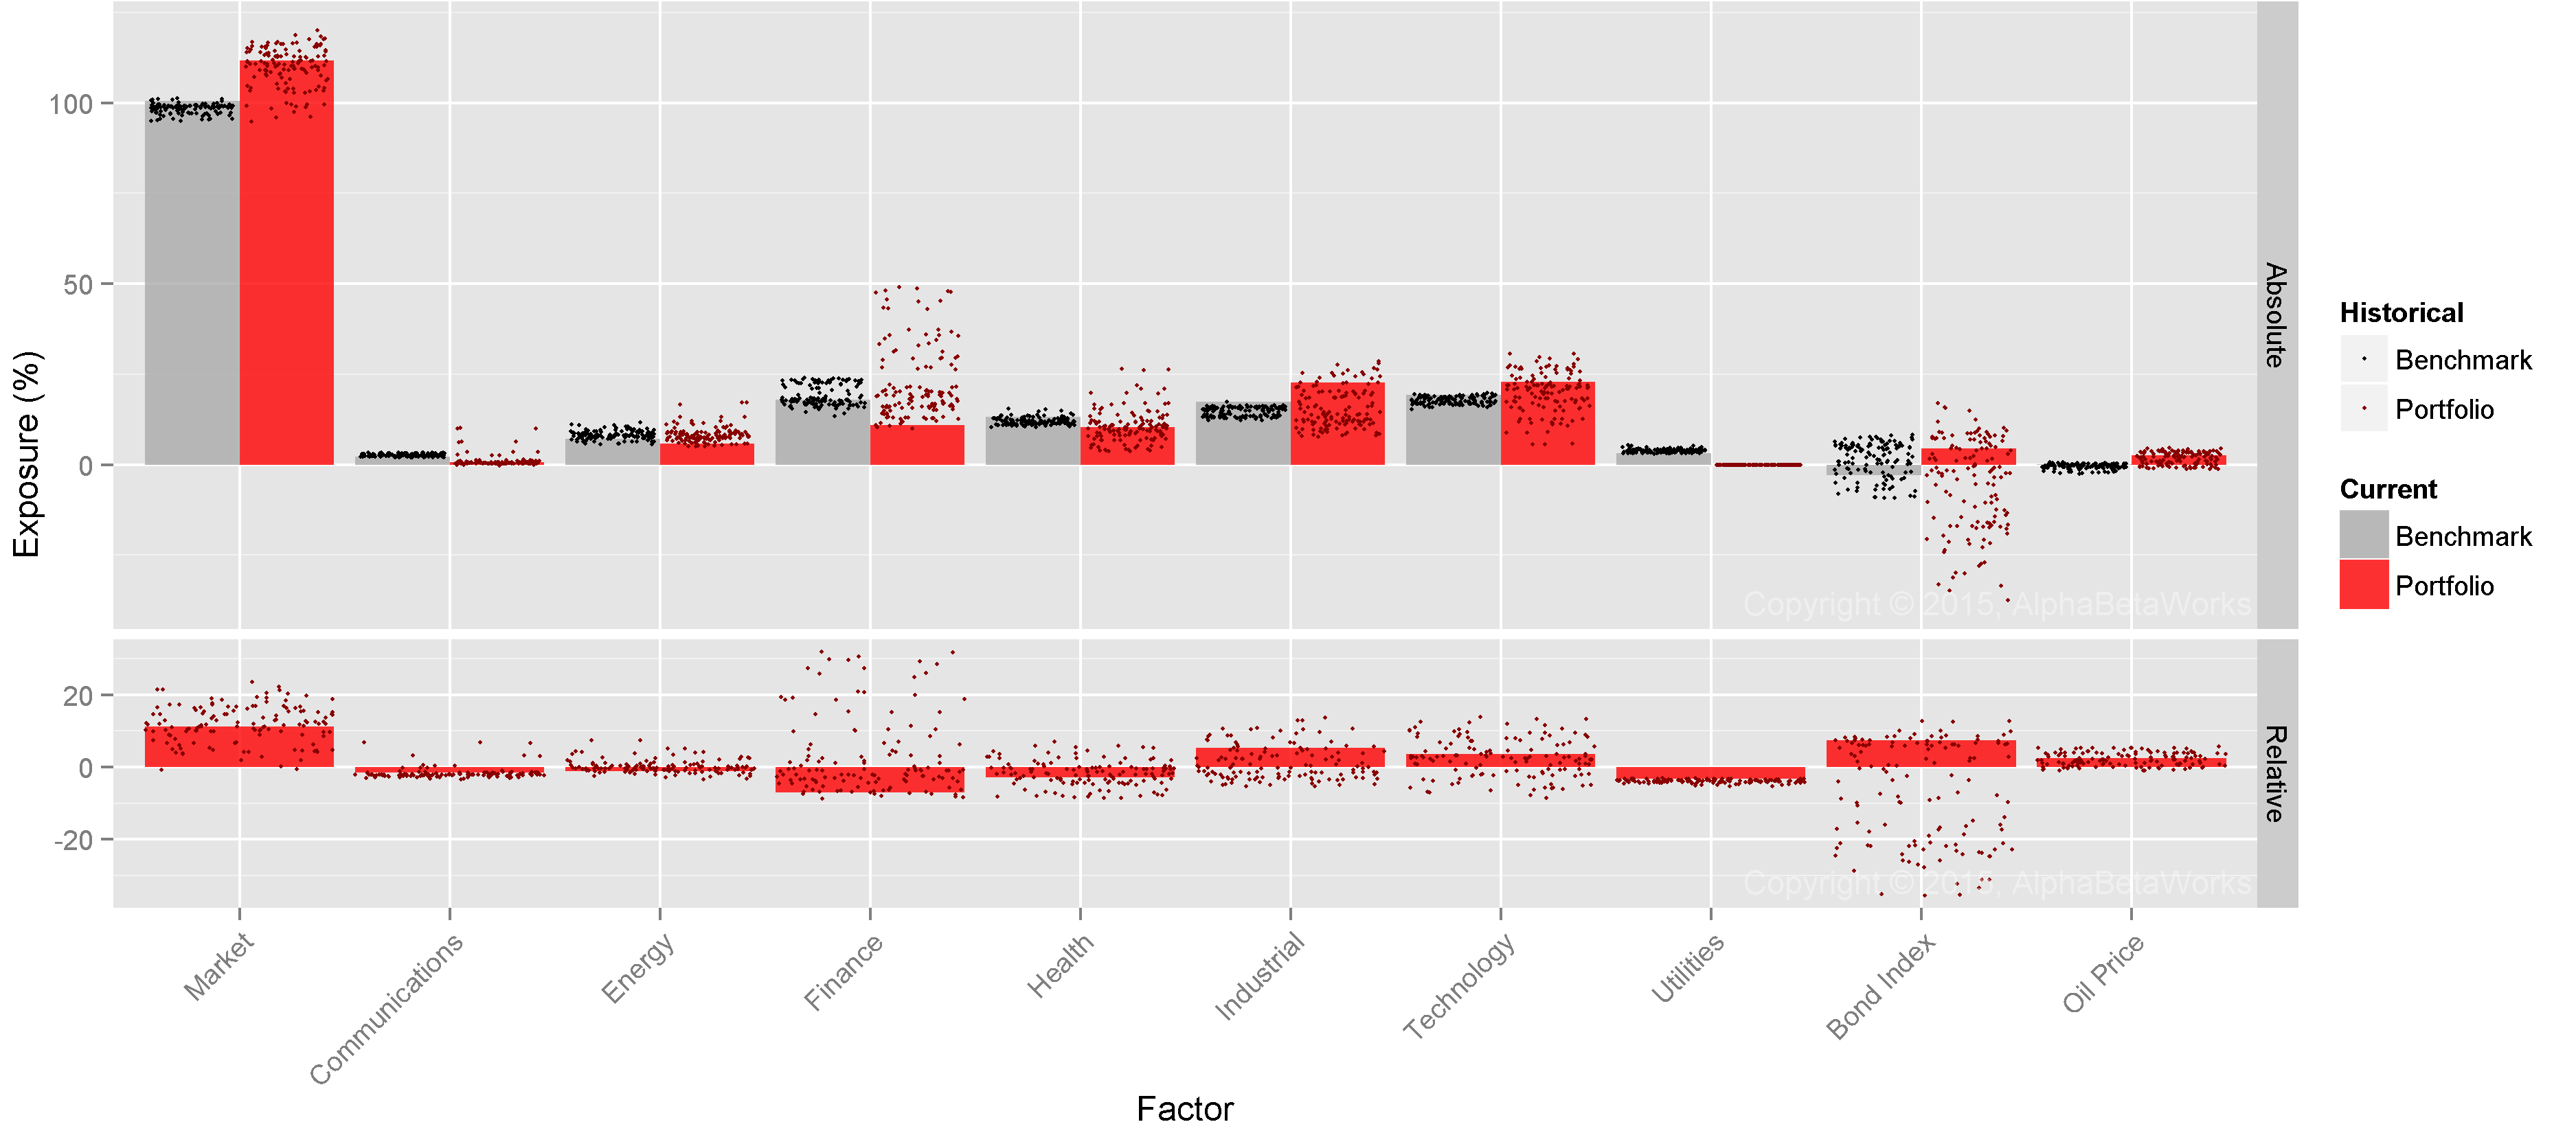
Below are HF Aggregate’s principal factor exposures (in red) relative to U.S. Market’s (in gray) as of 12/31/2014:

Chart of the factor exposures contributing most to the relative factor (systematic) risk of U.S. Hedge Fund Aggregate

Factor Exposures Contributing Most to the Relative Risk of U.S. Hedge Fund Aggregate

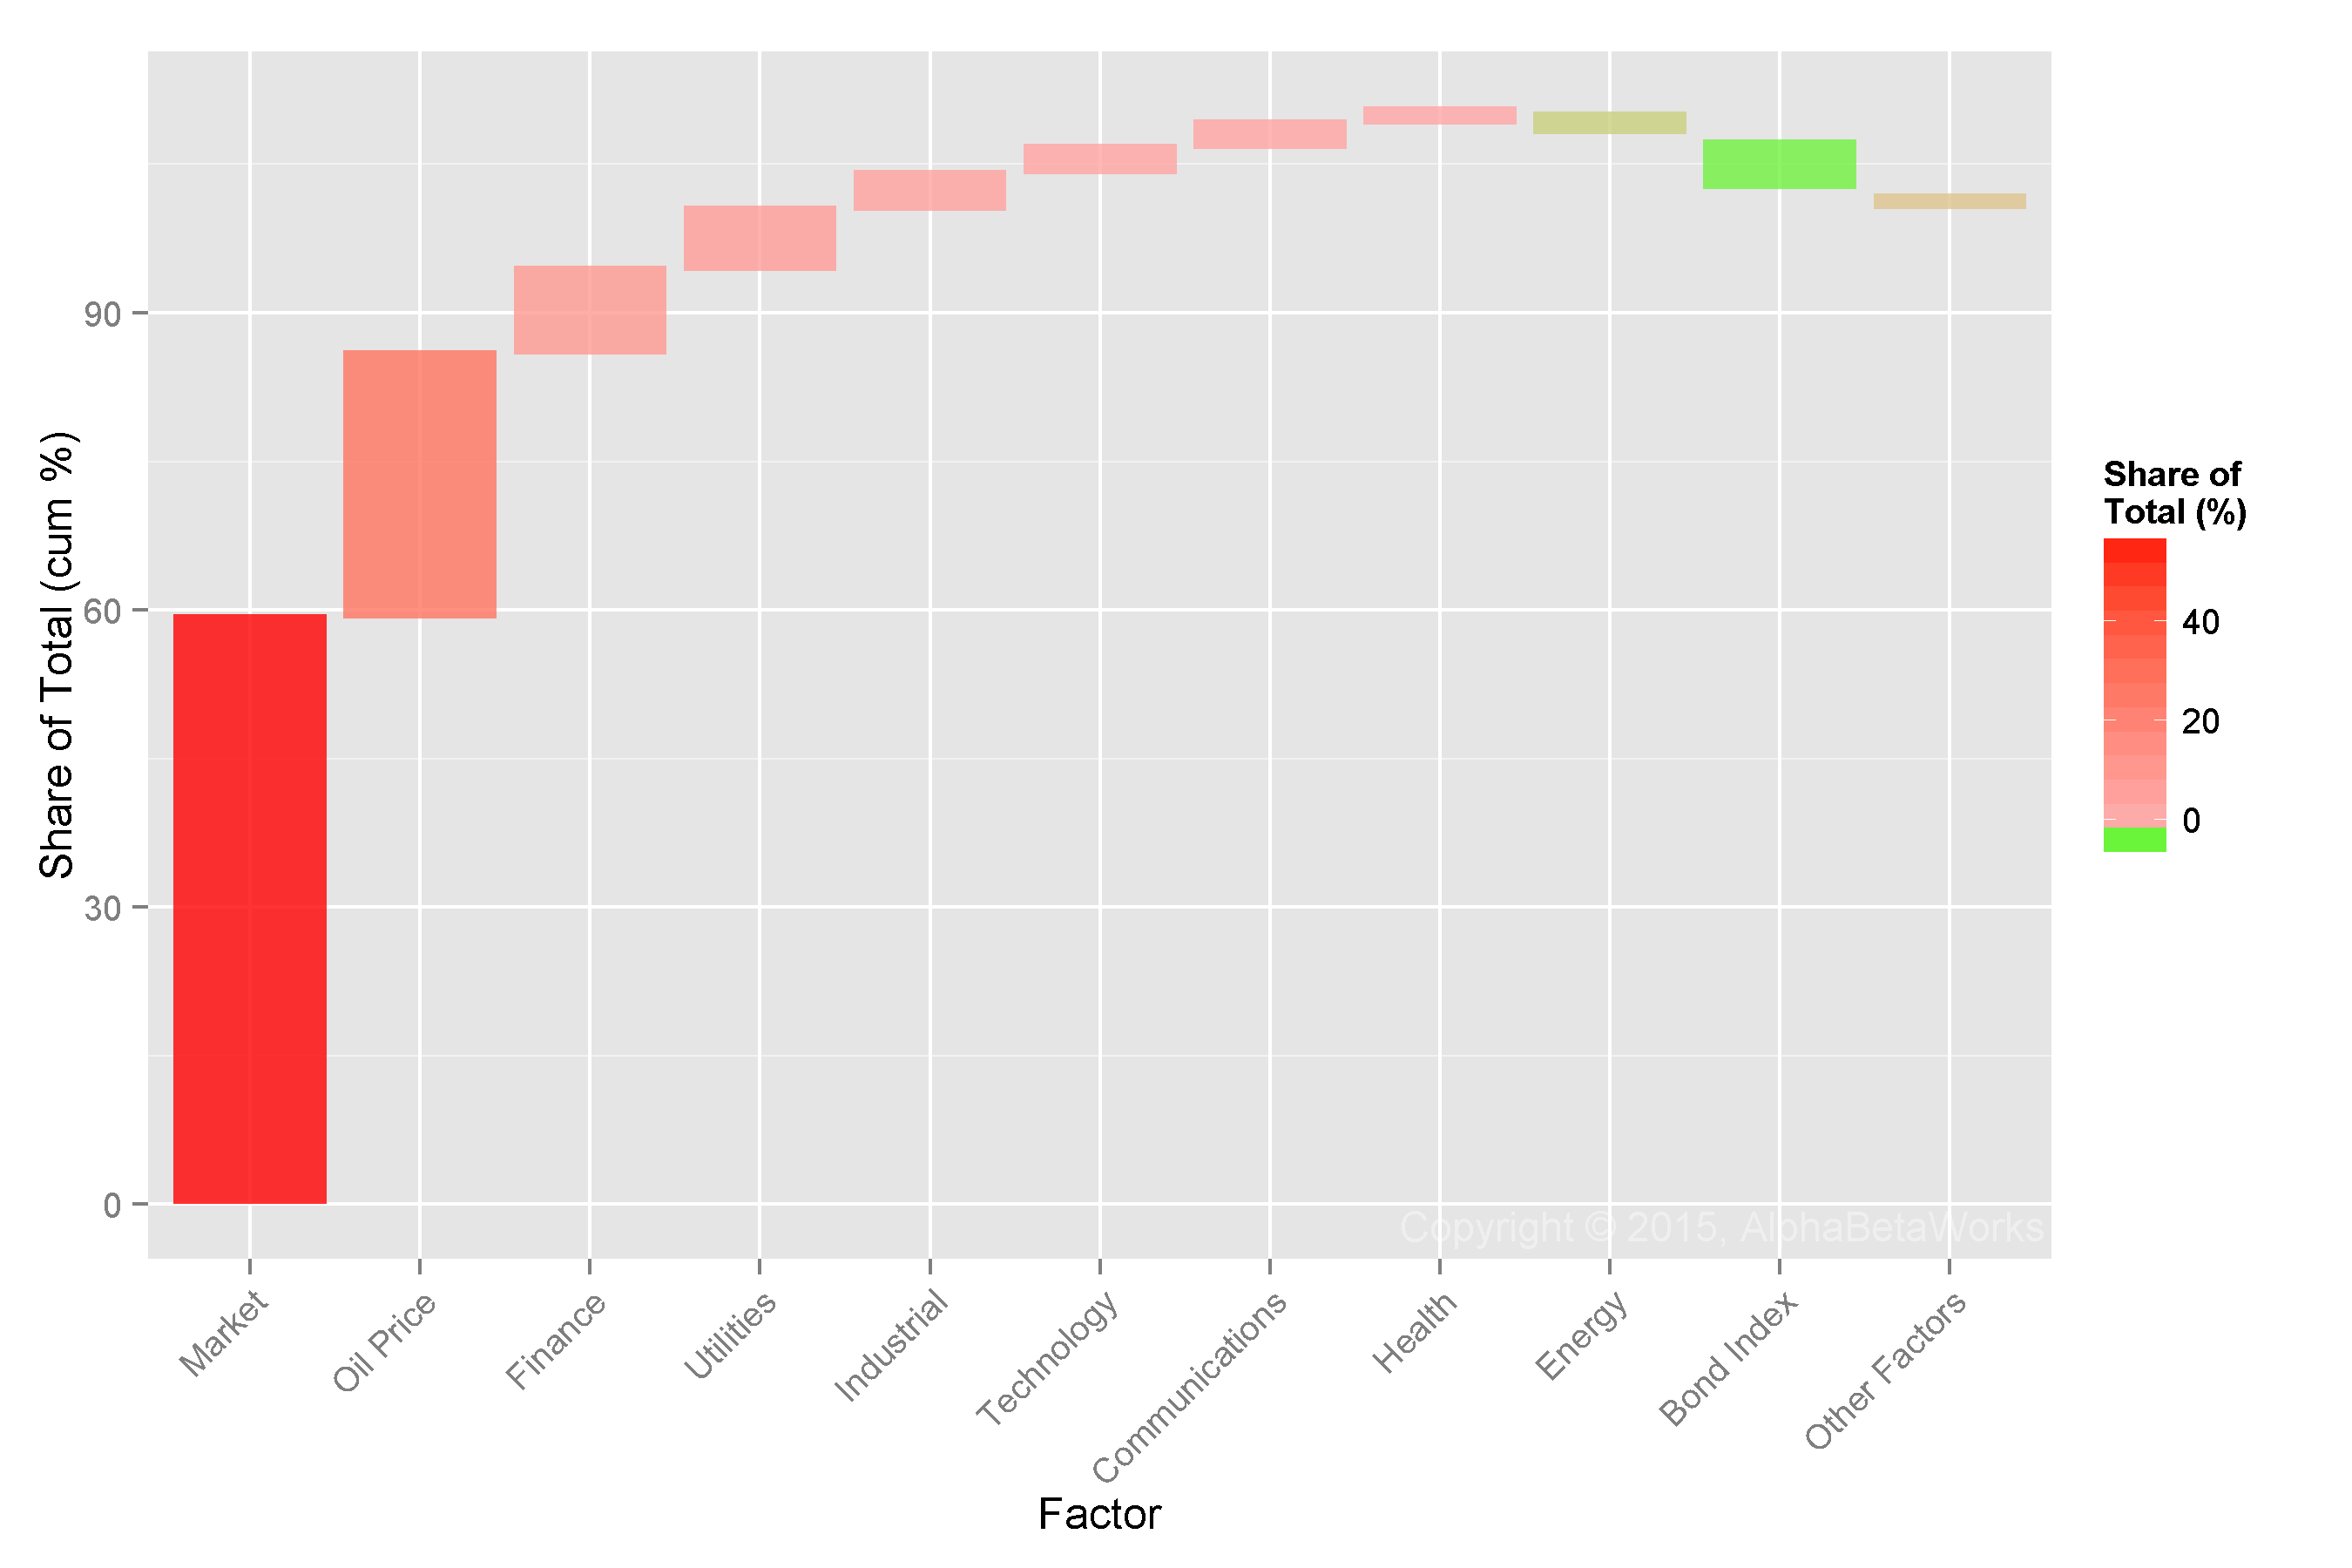
Of these bets, Market (Beta) and Oil are responsible for over 80% of the factor risk relative to U.S. Market. These are the main components of the 2.23% Factor Volatility in the first table:

Chart of the factors contributing most to the relative factor (systematic) variance of U.S. Hedge Fund Aggregate

Factors Contributing Most to Relative Factor Variance of U.S. Hedge Fund Aggregate

HF Aggregate has become more systematically crowded since Q3 2014. The following factors were the top contributors to the relative systematic risk on 12/31/2014:

Factor

Relative Exposure (%)

Portfoio Variance (%²)

Share of Systematic Variance (%)

Market

13.26

3.10

62.37

Oil Price

2.23

1.01

20.32

Finance

-7.49

0.43

8.65

Industrial

9.53

0.35

7.04

Utilities

-3.36

0.26

5.23

Other Factors -0.18

-3.62

Total 4.97

100.00

The increased factor risk during Q4 2014 was primarily due to a 2% increase in U.S. Market Exposure (Beta). After adding long oil exposure in Q3 2014 as the energy sector selloff intensified, hedge funds kept it steady through Q4.

Hedge Fund Residual (Idiosyncratic) Crowding

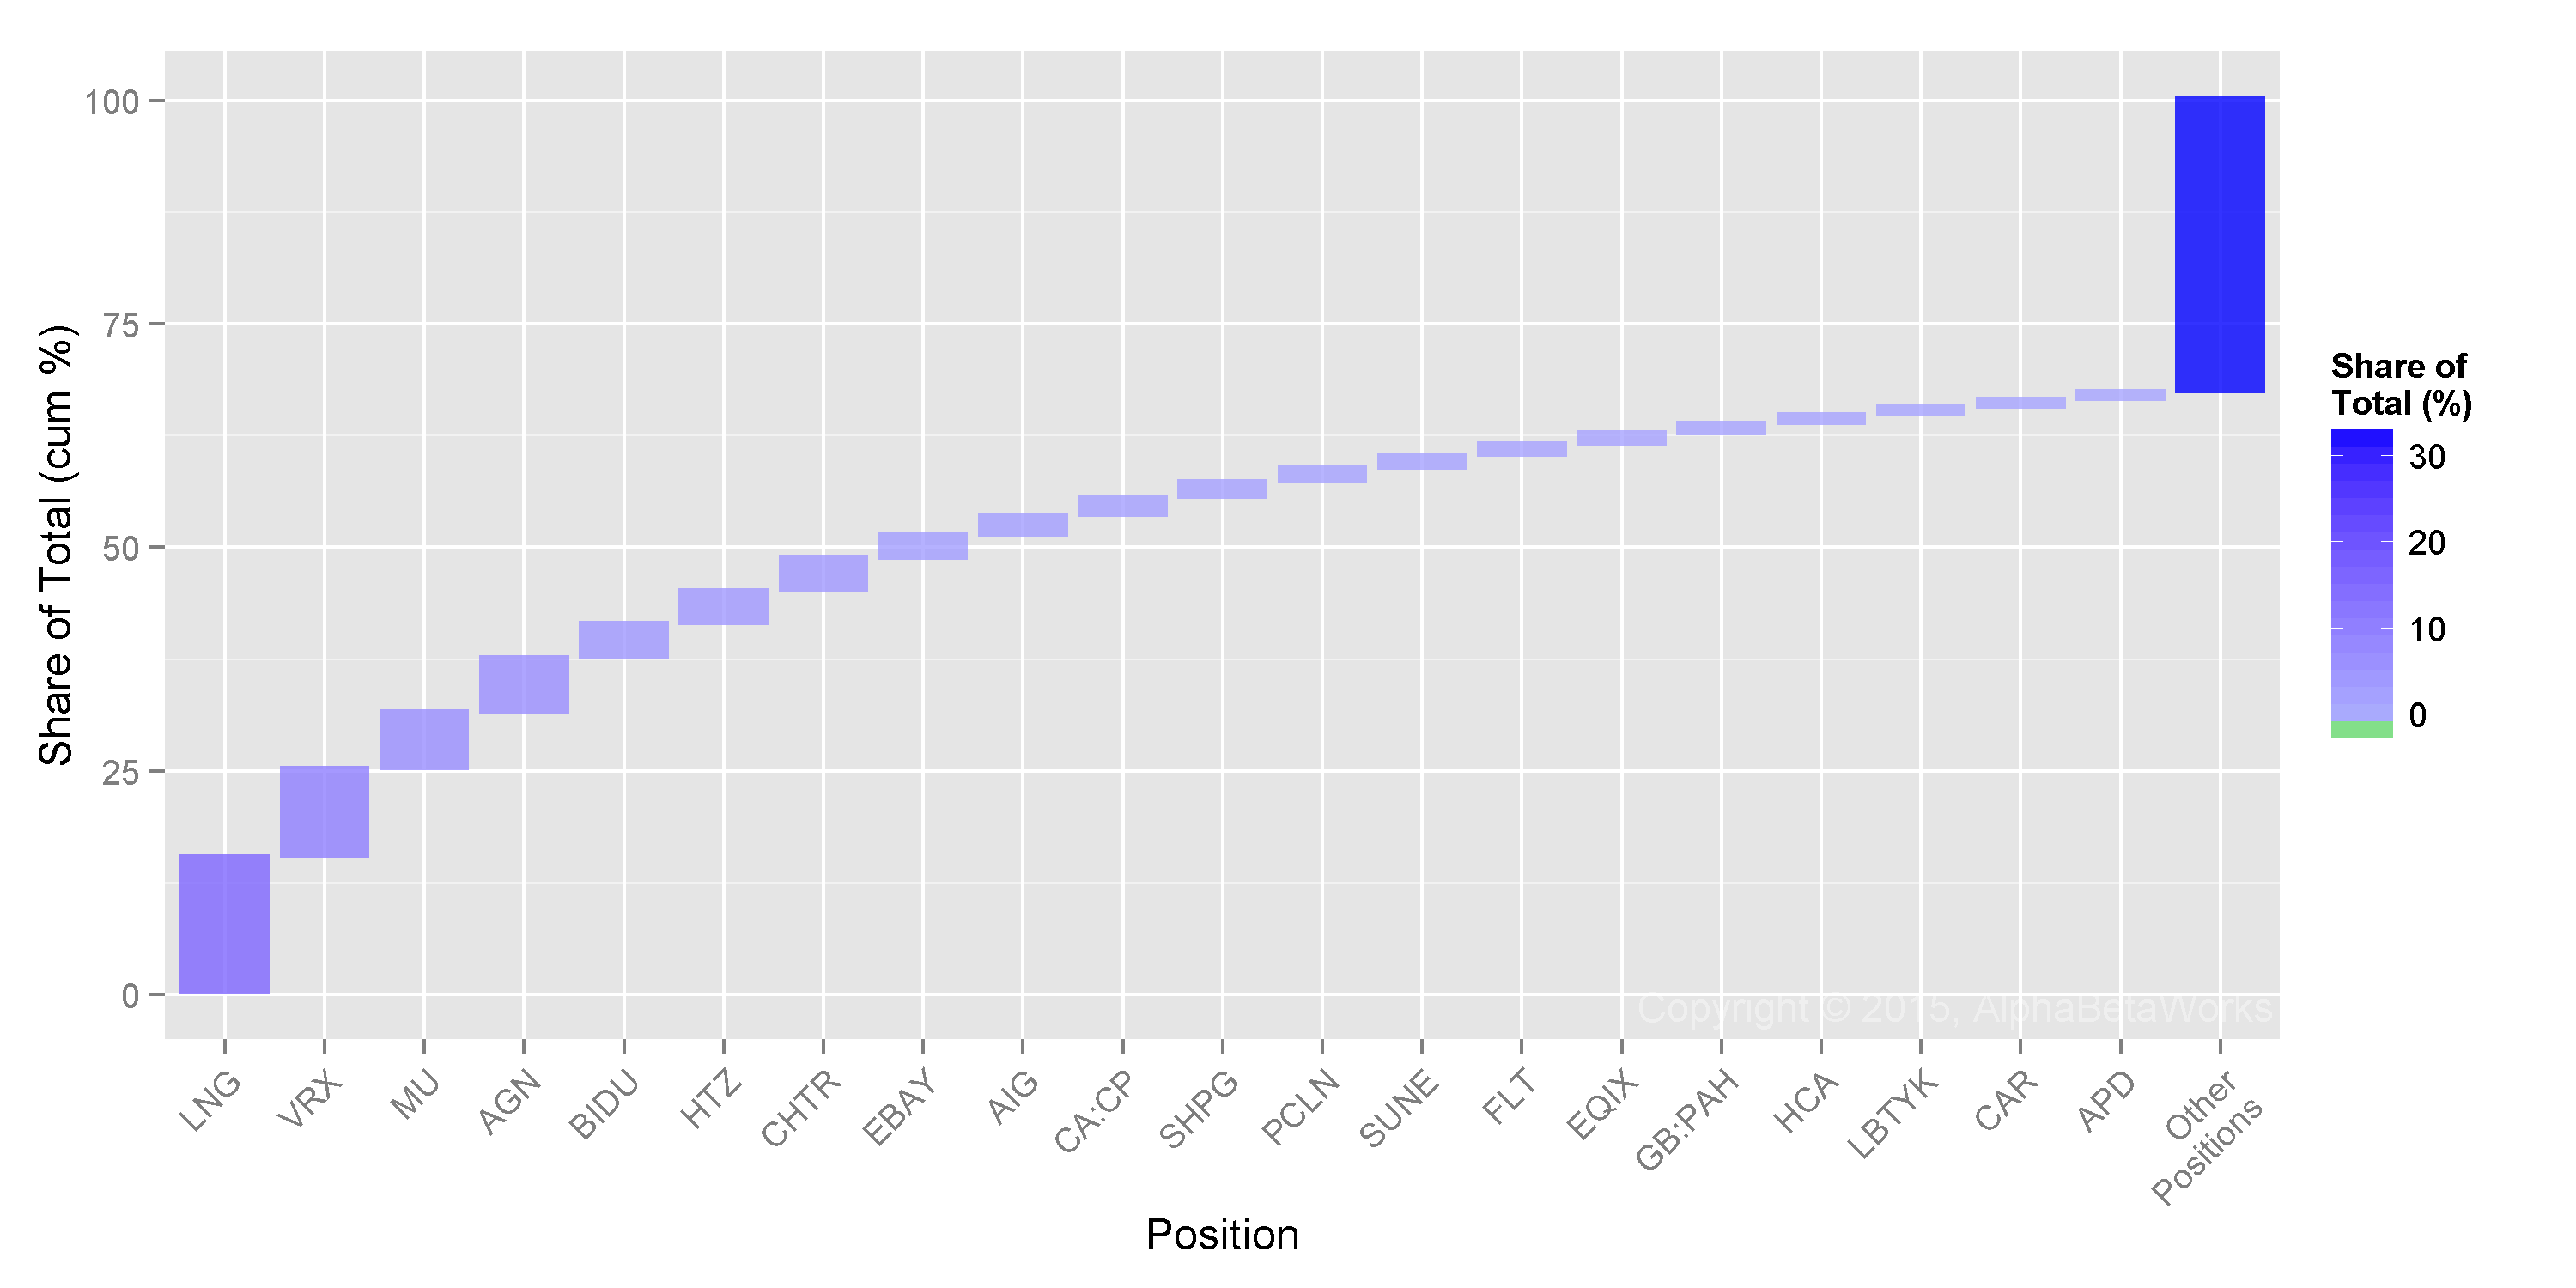
Turning to HF Aggregate’s residual variance relative to U.S. Market, eight stocks were responsible for over half of the relative residual risk:

Chart of the stocks contributing most to the relative residual (idiosyncratic) variance of U.S. Hedge Fund Aggregate

Stocks Contributing Most to Relative Residual Variance of U.S. Hedge Fund Aggregate

These stocks will be the primary drivers of HF Aggregate’s and of the most crowded firms’ returns. They will also be affected by the vagaries of capital flows into and out of hedge funds. Investors should be ready for seemingly inexplicable volatility in these names. They may be wonderful individual investments, but history is not on their side, since crowded bets have historically underperformed.

The list is mostly unchanged from the previous quarter:

Symbol

Name

Exposure (%)

Share of Idiosyncratic Variance (%)

LNG

Cheniere Energy, Inc.

1.70

15.73

AGN

Allergan, Inc.

3.53

9.51

VRX

Valeant Pharmaceuticals International, Inc.

2.35

9.18

CHTR

Charter Communications, Inc. Class A

1.80

3.88

HTZ

Hertz Global Holdings, Inc.

1.37

3.35

EBAY

eBay Inc.

1.91

3.27

MU

Micron Technology, Inc.

1.08

3.21

BIDU

Baidu, Inc. Sponsored ADR Class A

1.22

3.14

PCLN

Priceline Group Inc

1.29

2.43

SUNE

SunEdison, Inc.

0.63

2.29

When investing in these crowded names, investors should perform particularly thorough due-diligence, since any losses will be magnified when hedge funds rush for the exits.

Historically, consensus bets have done worse than a passive portfolio with the same risk. Consequently, fund allocators should thoroughly investigate hedge fund managers’ crowding to avoid investing in a pool of undifferentiated bets destined for disappointment.

AlphaBetaWorks’ analytics assist in both tasks: Our sector crowding reports identify hedge fund herding in each equity sector. Our fund reports measure hedge fund differentiation and skills that are strongly predictive of future performance.

Summary

  • There is both factor (systematic/market) and residual (idiosyncratic/security-specific) crowding of hedge funds’ long U.S. equity portfolios.
  • Hedge funds have become more systematically crowded during Q4 2014, primarily by increasing their Beta.
  • The main sources of idiosyncratic crowding are: LNG, AGN, VRX, CHTR, HTZ, EBAY, and MU.
  • The crowded hedge fund portfolio has historically underperformed its passive alternative. Investors would have made more by taking the same risk passively – hedge fund investors should pay close attention to crowding before allocating capital.
The information herein is not represented or warranted to be accurate, correct, complete or timely.
Past performance is no guarantee of future results.
Copyright © 2012-2015, AlphaBetaWorks, a division of Alpha Beta Analytics, LLC. All rights reserved.
Content may not be republished without express written consent.

Hedge Fund Crowding – Q3 2014

U.S. hedge funds share a few systematic and idiosyncratic long bets. These crowded bets are the main sources of aggregate hedge fund relative performance and of many individual funds’ returns. We survey the risk factors and the stocks behind most of Q3 2014 hedge fund herding.

Investors should treat crowded ideas with caution: Due to the congestion of their hedge fund investor base, crowded stocks tend to be more volatile and are vulnerable to mass selling. In addition, the risk-adjusted performance of consensus bets has been disappointing.

Identifying Crowding

This piece follows the approach of our earlier articles on fund crowding: We created an aggregate position-weighted portfolio (HF Aggregate) consisting of popular securities held by approximately 500 U.S. hedge funds with medium to low turnover. We then evaluated the HF Aggregate risk relative to the U.S. Market (Russell 3000) using AlphaBetaWorks’ Statistical Equity Risk Model and looked for evidence of crowding. Finally, we analyzed risk and calculated each fund’s tracking error relative to HF Aggregate to see which most closely resembled it.

Hedge Fund Aggregate Risk

The Q3 2014 HF Aggregate had 2.7% estimated future tracking error relative to the Market. Risk was evenly split between factor (systematic) and residual (idiosyncratic) bets:

 Source Volatility (%) Share of Variance (%)
Factor 1.99 52.64
Residual 1.89 47.36
Total 2.74 100

This 2.7% tracking error estimate decreased by a fifth since our Q2 2014 estimate of 3.3%.

The HF Aggregate is nearly passive and will have a very hard time earning a typical fee. Because of this, investing in a broadly diversified portfolio of long-biased hedge funds is almost certainly a bad idea.

Hedge Fund Factor (Systematic) Crowding

Below are HF Aggregate’s (red) most significant factor exposures relative to the U.S. Market (gray):

Chart of the current and historical exposures of U.S. Hedge Fund Aggregate to factors contributing most to its risk relative to the U.S. Market.

Factors Contributing Most to the Relative Risk for U.S. Hedge Fund Aggregate

We now consider the sources of HF Aggregate’s factor (systematic) variance relative to the U.S. Market. These are the components of the Factor Volatility in the above table. Market (higher beta) and Oil bets are responsible for over 80% of the factor risk relative to the U.S. Market:

Chart of the variance contribution for factors contributing most to the relative risk of the U.S. Hedge Fund Aggregate

Factors Contributing Most to Relative Factor Variance of U.S. Hedge Fund Aggregate

The HF Aggregate has become considerably more systematically crowded since Q2 2014: The following factors are the top contributors to the Q3 2014 relative systematic risk:

Factor HF Relative Exposure (%) Portfolio Variance (%²) Share of Systematic Variance (%)
Market 11.23 2.34 59.10
Oil Price 2.52 1.05 26.66
Finance -7.04 0.33 8.46
Utilities -3.19 0.24 6.11
Industrial 5.27 0.14 3.64
Other Factors -0.14 -3.97
Total 3.96 100.00

The following were the top contributors to the Q2 2014 relative systematic risk:

Factor HF Relative Exposure (%) Portfoio Variance (%²) Share of Systematic Variance (%)
Market 14.64 4.01 65.41
Size -9.93 0.90 14.61
Utilities -3.40 0.32 5.25
Technology 6.46 0.27 4.44
Oil Price 0.62 0.23 3.68
Other Factors 0.40 6.61
Total 6.13 100.00

Note that, following the poor performance of this factor throughout 2014, the short Size (small-cap) bet has been liquidated. Instead, hedge funds increased their long oil exposure by almost 2%. This crowded long oil bet has been another costly mistake.

Hedge Fund Residual (Idiosyncratic) Crowding

Turning to HF Aggregate’s residual variance relative to the U.S. Market, just seven stocks are responsible for half of the relative residual (idiosyncratic) risk:

Chart of the contribution to relative residual variance of the most significant residual (stock-specific) bets of the U.S. Hedge Fund Aggregate

Stocks Contributing Most to Relative Residual Variance of U.S. Hedge Fund Aggregate

These stocks may be wonderful individual investments, but they have a lot of sway in the way HF Aggregate and individual funds closely matching it will move. They will also be affected by the whims of capital allocation into hedge funds as an asset class. Investors should be ready for seemingly inexplicable volatility in these names. The list is mostly unchanged from the previous quarter:

Symbol Name Exposure (%) Share of Idiosyncratic Variance (%)
LNG Cheniere Energy, Inc. 1.61 15.28
VRX Valeant Pharmaceuticals International, Inc. 2.36 9.76
MU Micron Technology, Inc. 1.45 6.34
AGN Allergan, Inc. 2.82 6.08
BIDU Baidu, Inc. Sponsored ADR Class A 1.30 3.83
HTZ Hertz Global Holdings, Inc. 1.36 3.68
CHTR Charter Communications, Inc. Class A 1.68 3.67
EBAY eBay Inc. 1.62 2.58
AIG American International Group, Inc. 1.37 2.17
CA:CP Canadian Pacific Railway 1.74 2.02
SHPG Shire PLC Sponsored ADR 1.28 1.70

Investors should be especially careful and perform particularly thorough due-diligence when investing in crowded names, since any losses will be magnified when hedge funds rush for the exits. Fund allocators should thoroughly investigate hedge fund managers’ crowding to avoid investing in a pool of undifferentiated bets.

AlphaBetaWorks assists in both tasks: Our sector crowding reports identify hedge fund herding in each equity sector. Our hedge fund crowding data identifies manager skill and differentiation and is predictive of future performance.

Summary

  • There is both factor (systematic/market) and residual (idiosyncratic/security-specific) crowding of long hedge fund portfolios.
  • Hedge funds have become more crowded and more passive in Q3 2014.
  • The main sources of factor crowding are: Market (higher beta) and Oil.
  • The main sources of residual crowding are: LNG, AGN, VRX, MU, BIDU, and AIG.
  • Our research reveals that, collectively, hedge funds’ long U.S. equity portfolios tend to generate negative risk-adjusted returns. Crowded bets tend to disappoint and hedge fund investors should pay close attention to crowding before allocating capital.
The information herein is not represented or warranted to be accurate, correct, complete or timely.
Past performance is no guarantee of future results.
Copyright © 2012-2015, AlphaBetaWorks, a division of Alpha Beta Analytics, LLC. All rights reserved.
Content may not be republished without express written consent.