Tag Archives: survivor bias

Large Hedge Fund Survivor Bias

Why Size Isn’t Everything

Hedge fund survivor bias is especially insidious for the largest firms. Large hedge fund survivor bias overstates expected performance of the biggest firms by nearly half and their risk adjusted return from security selection (stock picking) by 80%. It is impossible to predict the largest funds of the future, but one doesn’t have to – robust skill analytics identify funds that will do even better in the future than tomorrow’s largest.

Past Performance of Today’s Largest Hedge Funds

We follow the approach of our earlier piece on hedge fund survivor (survivorship) bias, which analyzed firms’ long U.S. equity portfolios (HF Aggregate). This dataset spans the long portfolios of all hedge funds active over the past 10 years that are tractable using 13F filings.

We compare group returns to Factor Portfolio – a portfolio with matching factor (systematic) risk. Factor Portfolio captures the return of investing passively in ETFs and index futures with the same risk as the group. This comparison reveals security selection (stock picking) performance, or αReturn – outperformance relative to the Factor Portfolio and the return that would have been generated if markets had been flat.

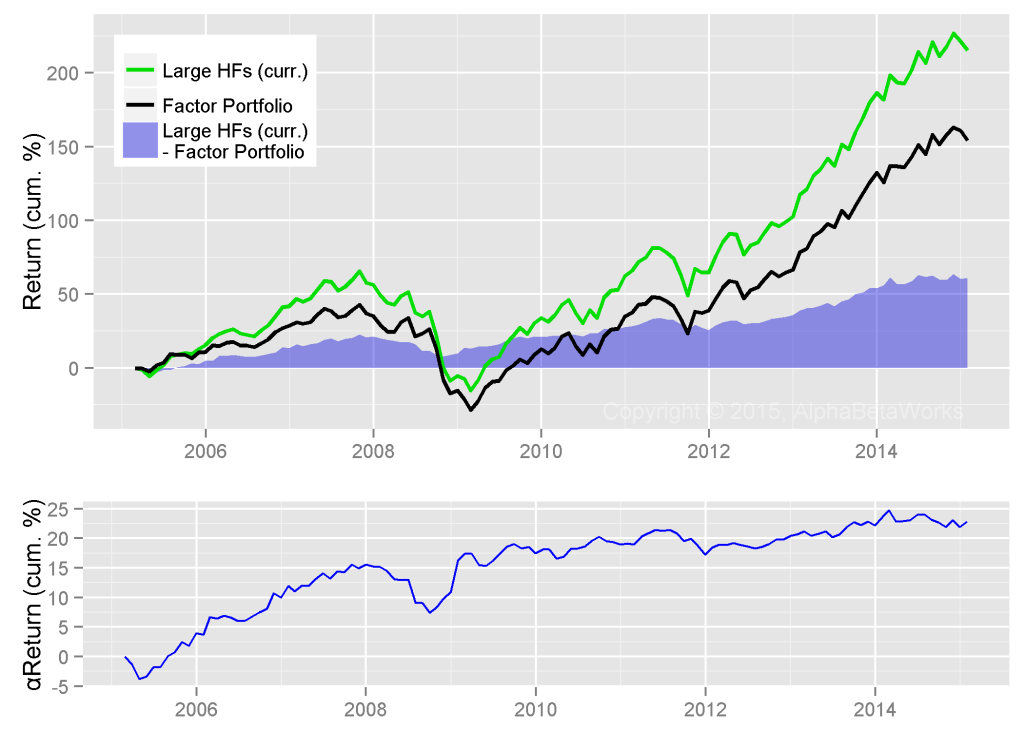
The following chart compares the performance of the 20 largest U.S. equity hedge fund long portfolios (Large HFs, green) to the Factor Portfolio (black). The security selection performance, or αReturn (blue), is the difference between the two. This is the average past performance of the 20 largest funds of 2015:

Chart of the past total, factor, and residual returns of long U.S. equity portfolios of the 20 largest hedge funds of 2015

Current Largest Hedge Funds: Past Total, Factor, and Residual Long U.S. Equity Returns

Returns (%)

Annualized

10-year Cum.

Total

11.48

215.26

Factor

9.33

154.29

Total – Factor

2.15

60.97

Firms that have grown the largest over the past 10 years have performed exceptionally well: Including the effect of compounding, their long portfolios generated 61% higher return than their passive equivalents. If markets had been flat for the past 10 years, their long equity portfolios would have appreciated by nearly 25%.

The allure of this past performance arouses fund-following, guru-tracking, and billionaire portfolio strategies. But there is one problem: Today’s largest funds represent a top-performing sliver of the thousands of funds active in the past. Of the thousands of funds, some truly are skilled, but many simply got lucky on aggressive bets and became large as a result, irrespective of their skill. This constitutes large hedge fund survivor bias. This performance does not persist and tends to mean-revert.

Future Performance of Yesterday’s Largest Hedge Funds

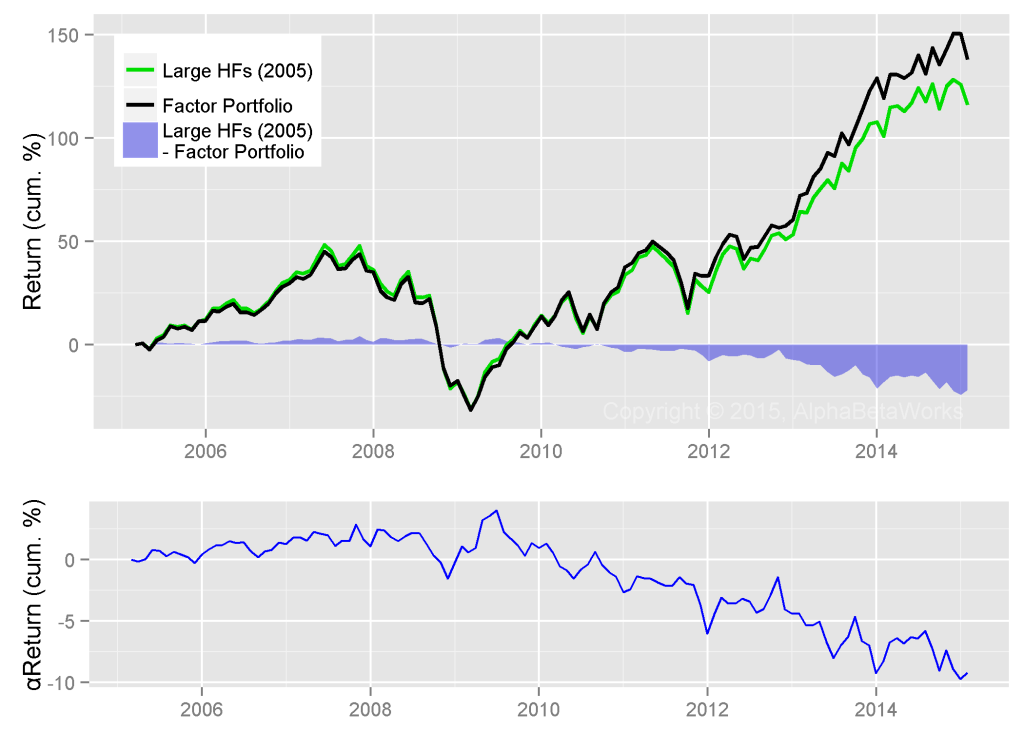
Most billionaire and guru-following strategies make the assumption that the largest funds are likely to continue generating strong returns. To test this, we tracked the 20 largest long U.S. equity hedge fund portfolios of 2005. Below is the unappealing picture of their average performance:

Chart of the future total, factor, and residual returns of long U.S. equity portfolios of the 20 largest hedge funds of 2005

2005 Largest Hedge Funds: Future Total, Factor, and Residual Long U.S. Equity Returns

Returns (%)

Annualized

10-year Cum.

Total

7.70

116.05

Factor

8.68

138.11

Total – Factor

-0.97

-22.05

The 2005 Large HF Aggregate tracked Factor Portfolio closely until 2010 and has struggled since. Hence, including the effects of compounding, large hedge fund survivor bias overstated security selection returns by 80%.

Size does not always signal quality, nor does it guarantee future performance. Between 2005 and 2015, the forward-looking performance of the largest long hedge fund portfolios of 2005 was just over half the backward-looking performance of 2015’s largest. Why then would the largest hedge funds of 2015 perform differently than the poor showing of the 2005 vintage?

Predicting Top Future Hedge Funds: Stock Picking Skill

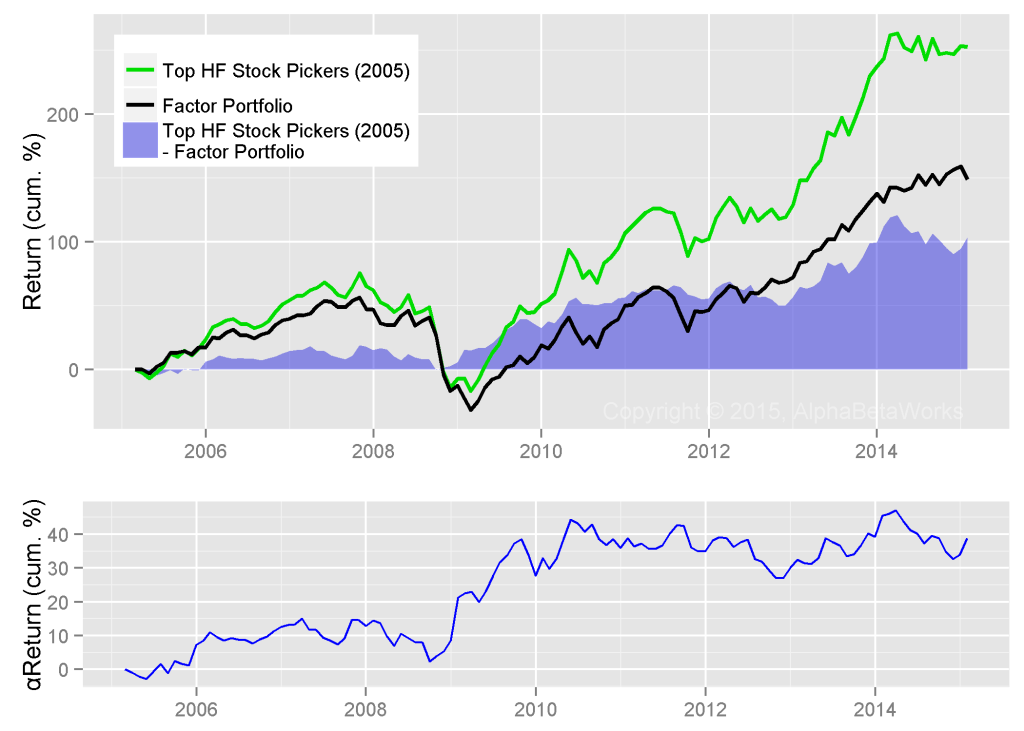
Absent a time machine, investors cannot know who will be the future stars. However, they need not despair. Instead of focusing on the largest or top-performing funds of the past, they can turn to those showing the highest evidence of skill. The following chart tracks the long U.S. equity portfolios of 20 hedge funds with the highest 3-year αReturn as of 12/31/2005:

Chart of the future total, factor, and residual returns of long U.S. equity portfolios of the 20 best stock picker hedge funds of 2005

Best 2005 Stock Picker Hedge Funds: Future Total, Factor, and Residual Long U.S. Equity Returns

Returns (%)

Annualized

10-year Cum.

Total

12.60

252.58

Factor

9.11

148.70

Total – Factor

3.49

103.88

The funds above were the best stock pickers of 2005, not the largest. If markets had been flat for the past 10 years, the top stock pickers of 2005 would have returned 40%. For a variety of reasons (scalability constraints, lifestyle preferences), many have not become the largest or best known, but their risk-adjusted returns are strong.

Since active management skills persist, skilled stock pickers of the past continue to generate strong nominal and risk-adjusted returns. The same analysis identifies today’s top stock pickers who will be tomorrow’s outperformers – and without the cost of a time machine!

Conclusions

  • Hedge fund survivor bias is larger for the largest hedge funds.
  • Between 2005 and 2015, large hedge fund survivor bias overstated expected nominal performance by nearly 100% and security selection performance by 80%.
  • Chasing large hedge funds is unnecessary and detrimental. Selecting a fund using robust skill analytics, as illustrated by αReturn, is superior to flawed results hampered by large hedge fund survivor bias.
The information herein is not represented or warranted to be accurate, correct, complete or timely.
Past performance is no guarantee of future results.
Copyright © 2012-2015, 
AlphaBetaWorks, a division of Alpha Beta Analytics, LLC. All rights reserved.
Content may not be republished without express written consent.

Hedge Fund Survivor Bias

And The Flaws of Blind Fund-Following Strategies

Numerous financial data and analytics vendors peddle hedge fund tracking strategies and content. Much of this data is hazardous to investors – Hedge fund survivor bias, a special case of the pervasive survivorship bias, is its key flaw. This artifact overstates nominal fund returns by a fifth and conceals mediocre risk-adjusted performance records.

This post is technical, but it illustrates an important phenomenon and sets up the foundation for upcoming articles. We analyze the long equity portfolios of approximately 1,000 medium and lower turnover non-quantitative hedge funds active over the past 10 years (HF Aggregate). This dataset spans the long portfolios of all non-quantitative hedge funds active over the past 10 years that are tractable using 13F filings.

HF Aggregate consists of two approximately equal sub-sets: HF Surviving Aggregate and HF Defunct Aggregate. HF Surviving Aggregate, similar to the datasets of many vendors, gives a deeply misleading picture of average hedge fund performance. Our HF Aggregate corrects this by including HF Defunct Aggregate – funds that stopped filing 13Fs as their U.S. assets dropped below $100 million.

All Hedge Fund Performance

We compare HF Aggregate to Factor Portfolio – a portfolio with matching factor (systematic) risk. Factor Portfolio captures the return investors would have realized if they had passively invested in ETFs and index futures with the same risk as HF Aggregate. We do this to calculate security selection (stock picking) returns of HF Aggregate.

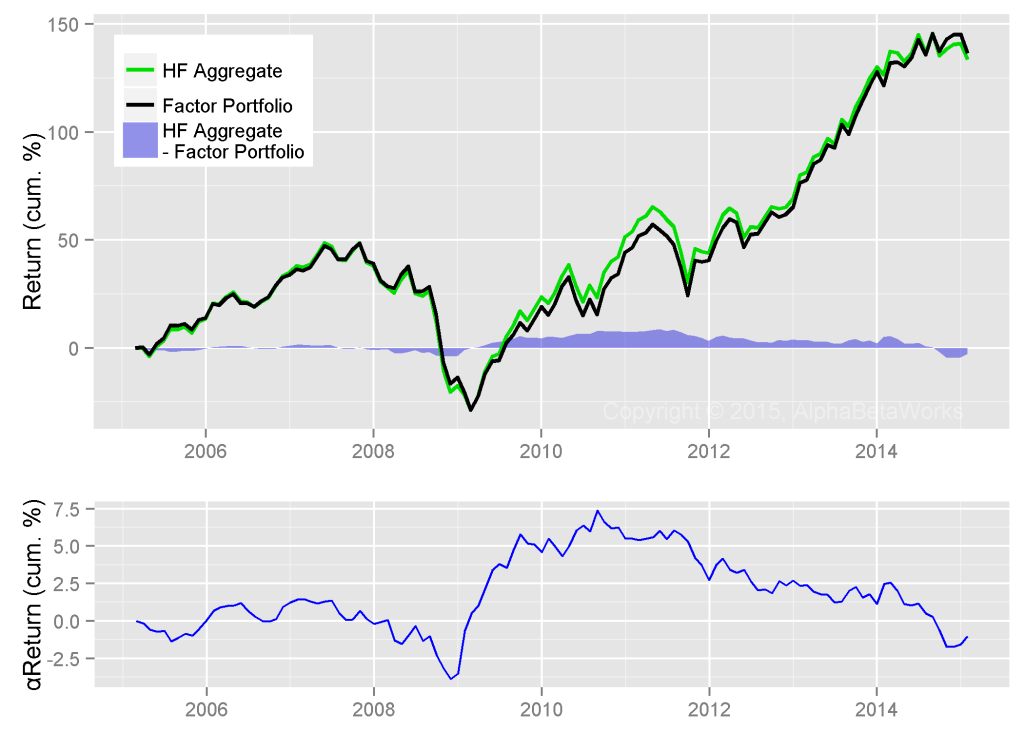
With the exception of the 2009-2011 period, HF Aggregate generated negative returns from security selection. AlphaBetaWorks’ measure of security selection performance is αReturn – outperformance relative to the Factor Portfolio. αReturn is also the return HF Aggregate would have generated if markets were flat. Since 2011, HF Aggregate’s αReturn was -2%. If markets had been flat, the average medium-turnover long hedge fund portfolio would have lost 2% from its long portfolio. Including the effects of compounding with factor returns, αReturn was -3%.

Putting these elements together, the chart below compares HF Aggregate’s performance (green) to the Factor Portfolio (black). The security selection performance, or αReturn (blue), is the difference between the two. This is the true long performance of the average hedge fund:

Chart of the cumulative total, factor, and residual/security selection performance of all medium turnover hedge fund U.S. equity portfolios, free from hedge fund survivor bias

All Medium Turnover U.S. Hedge Fund Long Portfolios: Factor, Residual, and Total Returns

Performance (%)

Annualized

10-year
Total

8.48

133.57

Factor

8.60

136.39

Total – Factor

-0.12

-2.82

Survivor Hedge Fund Performance – Survivorship Bias in Action

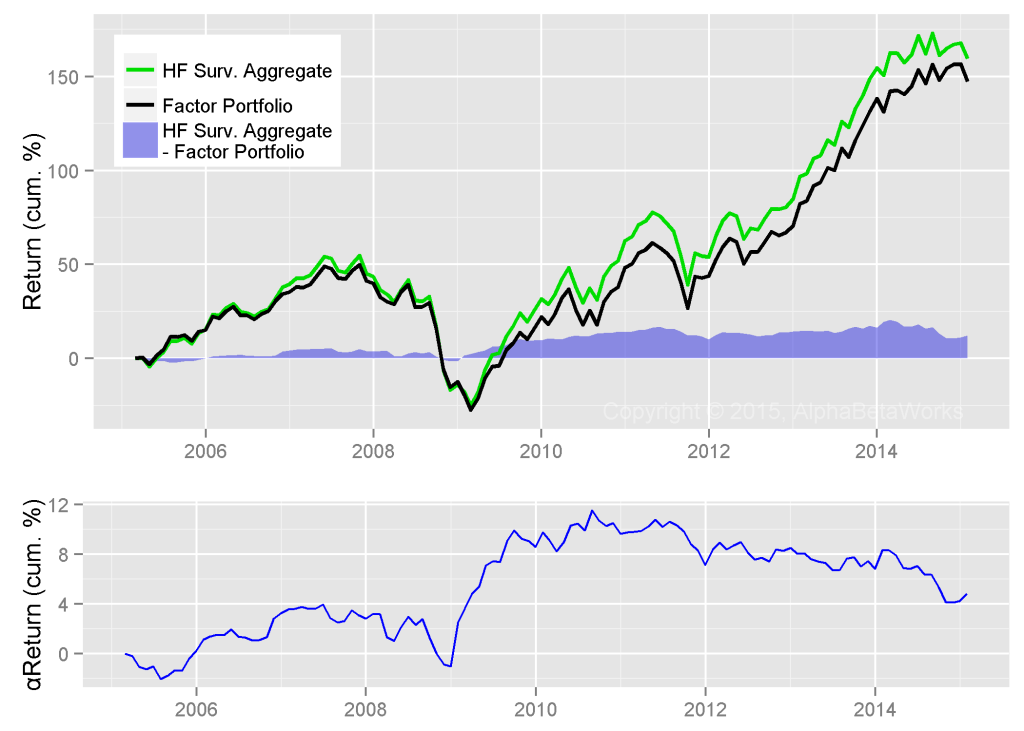
The figures above contrast with those promoted by many data vendors and analytics providers. They typically consider (or provide data on) the survivors only – those funds that are still around, active, and reporting their holdings – HF Surviving Aggregate.

Indeed, the performance of surviving hedge funds is superior: their nominal return is 26% higher than HF Aggregate’s and their security selection performance is positive. Not surprisingly, surviving funds have consistently generated positive risk-adjusted returns from security selection, outperforming the replicating Factor Portfolio. This is the performance investors typically see:

Chart of the cumulative total, factor, and residual/security selection performance of surviving medium turnover hedge fund U.S. equity portfolios, affected by the hedge fund survivor bias

Surviving Medium Turnover U.S. Hedge Fund Long Portfolios: Factor, Residual, and Total Returns

Performance (%)

Annualized

10-year

Total

9.54

159.57

Factor

9.06

147.37

Total – Factor

0.48

12.20

Defunct Hedge Fund Performance

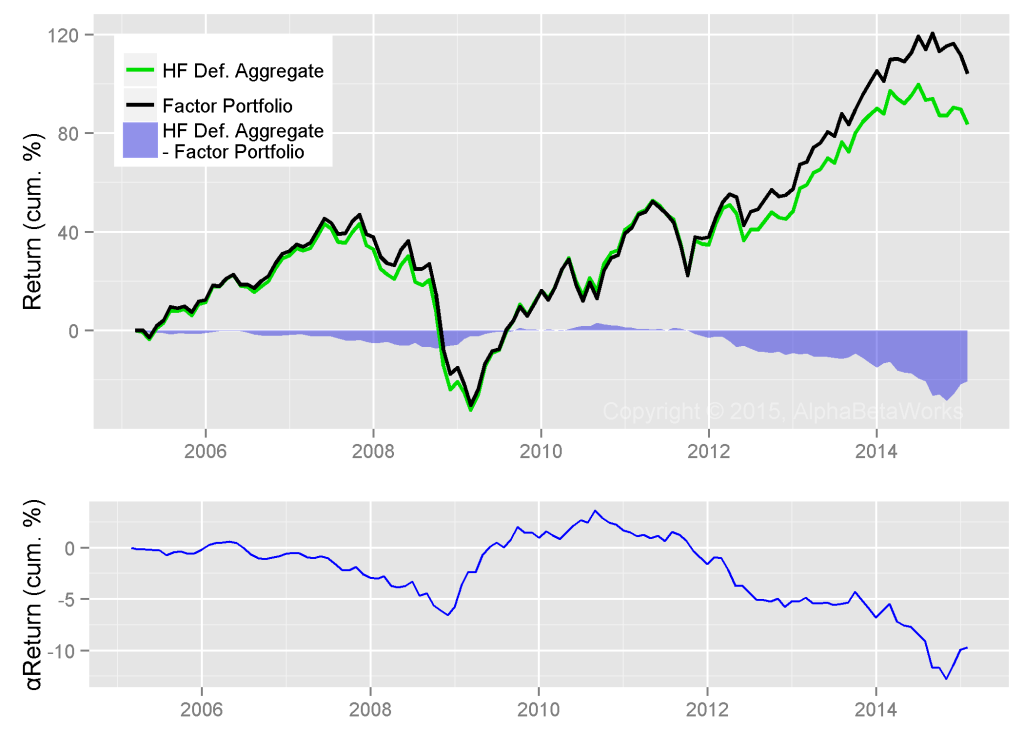
The disconnect between these two pictures of average hedge fund performance is due to survivor bias. Of the approximately 1,000 medium turnover hedge funds tractable using 13Fs that have been active filers over the past 10 years, only half remain. The defunct half dropped out of many databases and out of HF Surviving Aggregate. HF Defunct Aggregate struggled under low factor returns and poor security selection. This is the under-performance swept under the rug:

Chart of the cumulative total, factor, and residual/security selection performance of defunct medium turnover hedge fund U.S. equity portfolios, excluded to cause hedge fund survivor bias

Defunct Medium Turnover U.S. Hedge Fund Long Portfolios: Factor, Residual, and Total Returns

Performance (%)

Annualized

10-year

Total

6.07

83.52

Factor

7.14

104.12

Total – Factor

-1.06

-20.60

The difference in performance between surviving and defunct funds is especially dramatic post-2008:

  • Surviving and defunct hedge funds’ long portfolios show similar nominal returns through 2008. Surviving hedge funds are slightly ahead with a 5% higher αReturns.
  • The 2008 draw-down for surviving and defunct hedge funds is similar. Both groups generate negative αReturns: widespread portfolio liquidation devastates crowded hedge fund bets across both groups.
  • From 2009 the survivors decouple from the defunct: Defunct funds trim exposures. Surviving funds boost exposures.
  • Since 2009 HF Surviving Aggregate outperforms HF Defunct Aggregate by over 70%. Approximately half is due to higher systematic risk and half is due to security selection.
  • Survival is mostly a matter of exposure and stock picking.

Absent a time machine, investors and fund followers cannot know who will be the future survivors. HF Defunct Aggregate consists of survivors that did well enough to last until 2005, but subsequently perished. Unfortunately, many strategies are built on a swampy foundation – the assumption that the average hedge fund is the same as the average surviving hedge fund. True fund performance is a fifth lower.

Consequently, robust skill analytics developed with the understanding of hedge fund survivor bias are critical to keep investors out of yesterday’s winners that tend to become tomorrow’s losers.

Conclusions

  • Historical performance of surviving hedge funds overstates actual average returns by a fifth.
  • Hedge fund survivor bias boosts 10-year nominal returns by 26%, primarily post-2008.
  • Hedge fund survivor bias boosts 10-year security selection returns by approximately 15%.
  • Fund performance and holdings studies that ignore survivor bias will deliver misleading conclusions and disappointing performance.
The information herein is not represented or warranted to be accurate, correct, complete or timely.
Past performance is no guarantee of future results.
Copyright © 2012-2015, 
AlphaBetaWorks, a division of Alpha Beta Analytics, LLC. All rights reserved.
Content may not be republished without express written consent.