The Effect of ESG Constraints on Systematic Risk
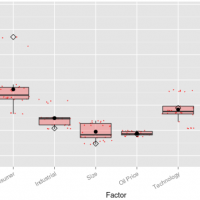
The Explanatory Power of Sectors and Style
technique that explains and forecasts security returns. The factor models prevalent
in academic circles (Fama-French, Carhart) tend to
rely heavily on the size and value style
factors. Meanwhile, effective industry models often attribute
risk to sector and industry factors before style. Which approach is more
effective? Though claims that style
explains […]
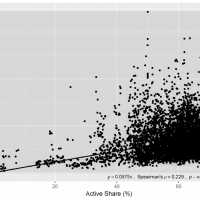
The Predictive Power of Active Share
U.S. Smart Beta Crowding
Hedge Fund Crowding Update – Q2 2017
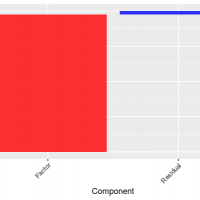
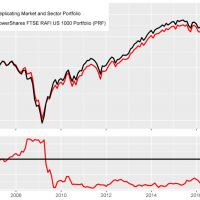
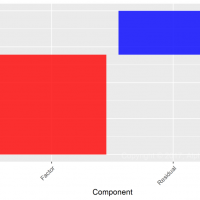
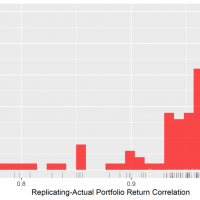
Replicating Fundamental Indexing with Factor Tilts
Hedge Fund Crowding Update – Q1 2017
Residual, idiosyncratic, or stock-specific bets now account for less than a third of hedge fund crow[…]
Performance of the Top U.S. Stock Pickers in 2016
Though 2016 was a poor year for most institutional portfolio managers, it was a satisfactory year for the most skilled ones. Security selection returns of the top U.S. stock pickers in 2016 were positive. When hedged to match market risk, a consensus portfolio of the top intuitional U.S. stock pickers outperformed the Market by approximately 2%.
This article dem[…]
Hedge Fund Crowding Update – Q4 2016
[…]
Hedge Fund Crowding Update – Q3 2016
What Fraction of International Smart Beta is Dumb Beta?
It turns out that international smart beta ETFs are e[…]
What Fraction of Smart Beta is Dumb Beta?
Hedge Fund Crowding Update – Q2 2016
Hedge Fund Finance Sector Crowding
Hedge Fund Crowding Update – Q1 2016
Performance Persistence within International Style Boxes
The Top U.S. Stock Pickers’ Industrials Performance
The challenges of identifying good investors and distilling their skill obscure the top stock pickers’ consistently strong performance. For instance, contrary to popular wisdom 2015 was a good year for stock picking. These results also generally apply to large market sub-segments such as the Industrials sector. In this piece we use a robust risk model[…]
How Did the Top U.S. Stock Pickers Do in 2015?
Contrary to popular wisdom, 2015 was a good year for stock picking. The problem is that few know who the good stock pickers are. Further, good stock pickers may be poor risk managers. In this article we use a robust risk model to track the top U.S. stock pickers and to distill their skill.
Since genuine investment skill persists, top U.S. stock pickers tend t[…]
Hedge Fund Clustering in Q4 2015
Hedge Fund Crowding Update – Q4 2015
Performance Persistence within Style Boxes
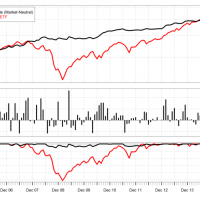
Are Momentum ETFs Delivering Momentum Returns?
Best and Worst Hedge Fund Long Stock Pickers
The five top hedge fund long stock pickers with long U.S. equity AUM over $3 billion produced 10.7% average annual alpha in the past three years (through October 2015). The five bottom hedge fund long U.S. equity stock pickers had negative alpha averaging -6.5% during the same period. Both lists contain well-known and well-followed managers with a combined long U.S. eq[…]
Hedge Fund Crowding Update – Q3 2015
Asset Flows and Hedge Fund Crowding
Hedge Fund Crowding has cost investors $12 billion in the first 10 months of 2015, and $9 billion in the August-October 2015 rout. That is to say, tractable hedge funds’ long U.S. equity portfolios have suffered severely negative active return from security selection (alpha, or αReturn) this year, and the liquidation has accelerated. Even ignoring fees,[…]
The Risk Impact of Valeant on Sequoia Fund
The Sequoia Fund’s (SEQUX) hefty sizing of Valeant Pharmaceuticals (VRX) dramatically changed the fund’s risk profile from historical norms. With the proper tools, allocators would have noticed this style drift back in Q2 2015 when Sequoia’s key factor exposures moved two to three times beyond historical averages. What’s more, allocators would have noticed a predicted[…]
Hedge Fund Crowding Costs: Q3 2015
Mutual Fund Closet Indexing: 2015 Update
Hedge Fund Closet Indexing: 2015 Update
Hedge Fund Energy Clustering: Q2 2015
This piece surveys hedge fund clustering in the energy sector and examines the large[…]
Hedge Fund Clustering: Q2 2015 Update
This piece illustrates the large-scale hedge fun[…]
Hedge Fund Semiconductor Sector Crowding
Hedge Fund Crowding Update – Q2 2015
Investors should treat consensus ideas with caution: Crowded stocks are prone to mass liquidation. Crowded hedge fund b[…]
Liquidation of Crowded Hedge Fund Energy Positions
Crowded hedge fund oil and gas producers underperformed their sector peers by over 20% since 2013 as fund energy books wer[…]
Property and Casualty Industry Crowding
Identifying Property and Casualty Industry Crowding
This analysis of property and casualty (P&C) insurance industry portfo[…]
Hedge Fund Crowding Update – Q1 2015
Investors should treat crowded ideas with caution: Crowded stocks are more volatile and vulnerable to mass liq[…]
The Impact of Fund Mean Reversion
Common return measures fail to predict future hedge fund performance. More important, under typical allocation and withdrawal constraints, these failures due to mean reversion become more severe:
Portfolios based on top nominal returns and win/loss ratios tend to under-perform.
Portfolios based on to[…]
Hedge Fund Mean Reversion
Hedge Fund Crowding – Q4 2014
Investors should treat crowded ideas with caution: Due to the congestion of their hedge fund investor […]
Large Hedge Fund Survivor Bias
Hedge fund survivor bias is especially insidious for the largest firms. Large hedge fund survivor bias overstates expected performance of the biggest firms by nearly half and their risk adjusted return from security selection (stock picking) by 80%. It is impossible to predict the largest funds of the future, but one doesn’t have to – robust skill analytics identify fund[…]
Hedge Fund Survivor Bias
Numerous financial data and analytics vendors peddle hedge fund tracking strategies and content. Much of this data is hazardous to investors – Hedge fund survivor bias, a special case of the pervasive survivorship bias, is its key flaw. This artifact overstates nominal fund returns by a fifth and conceals mediocre risk-adjusted performance records.[…]
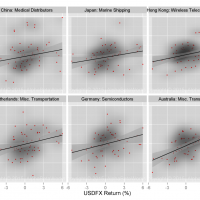
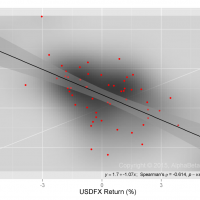
Foreign Sectors Exposed to Strong USD
For U.S. exporters hurt by strong USD: Do foreign competitors benefit, exhibiting the opposite (positive) USD exposure?
For U.S. retailers and distributors aided by strong USD: Do foreign suppliers benefit, exhibiting similar[…]
Berkshire’s Energy Investment Skills
Berkshire Hathaway’s year-end 2014 Form 13F showed the liquidation of the approximately $4 billion Exxon Mobil (XOM) position. This sale has generated considerable discussion. Absent data on Berkshire’s Energy Sector record, the sale is uninformative; we provide this data here.
Investors typically treat all ideas of excellent managers with equal defer[…]
Sectors Most Exposed to USD FX
Hedge Funds’ Best and Worst Sectors
While crowded hedge fund ideas[…]
Hedge Fund Crowding – Q3 2014
Investors should treat crowded ideas with caution: Due to the congestion of their hedge fund investor base, crowded sto[…]
Smart Beta and Market Timing
Smart beta (SB) strategies tend to vary market beta and other factor exposures (systematic risk) over time. Consequently, market timing is an important source of their risk-adjusted returns, at times more significant than security selection. We have previously discussed that returns-based style analysis (RBSA) and similar methods f[…]
Returns-Based Style Analysis – Overfitting and Collinearity
Returns-based style analysis (RBSA) is a common approach to investment risk analysis, performance attribution, and skill evaluation. Returns-based techniques perform regressions of returns over one or more historical periods to compute portfolio betas (exposures to system[…]
When “Smart Beta” is Simply High Beta
Many “smart beta” funds are merely high-beta, delivering no value over traditional index funds. On the other hand, some smart beta strategies are indeed exceptional and worth their fees.
Most analyses of enhanced index funds and smart beta strategies lack a rigorous approach to risk evaluation and pe[…]
Upgrading Fund Active Returns
Maybe your fund took extra risk to keep up with its benchmark. Maybe your fund should have made more – much more – given the risks it took. By the time market volatility reveals underlying exposures, it may be too late to avoid severe losses. There is a better way: Investors can continuously monitor a fund’s risk, the returns it should be generating, and the value it creates. […]
Hedge Fund E&P Crowding – Q2 2014
Crowding is costly to investors, fu[…]
Top-Performing Hedge Fund Profile – Pershing Square
Not all outperformance is true outperformance. There are many funds whose performance looks spectacular on the surface, but whose risk-adjusted performance is poor. This article takes a closer look at Pershing Square Capital Management, nominally one of the top performing funds throughout 2014 and over the long-term. We show that […]
Hedge Fund Energy Crowding – Q2 2014
Sectors Most Exposed to Oil Price
Hedge Fund Clustering
Hedge fund crowding has internal structure – clusters of funds with shared systematic (factor) and idiosyncratic (residual) bets. We examine the largest hedge fund cluster in which:
two risk factors cause most o[…]
Hedge Fund Crowding Trends
We examined the evolution of systematic, idiosyncratic, and total risk of long equity hedge fund portfolios relative to each other. We found decreasing differentiation and increasing herding over time. In summary, over the past 10 years total differentiation declined by 30% while systematic (factor) differentiation declined by 39%. As capital […]
Hedge Fund Crowding – Q2 2014
U.S. hedge funds share a few systematic and stock-specific long bets. These crowded bets are the main sources of aggregate long hedge fund relative performance as well as many individual funds’ returns. Two risk factors and six stocks are behind most of this herding. The crowded stocks may experience elevated volatility due to the conges[…]
Industry-Specific Security Selection – Paulson & Co
Investors typically treat all ideas of excellent managers with equal deference. This is a mistake. Most skilled managers achieve positive risk-adjusted performance in a few specific areas, and under-perform in others. This article continues the series surveying specific skills of widely-followed investment managers.
Paulson &[…]
The “Small-Cap Large-Cap Funds”
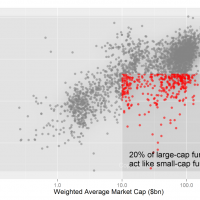
Using the market capitalization of holdings, common in rudimentary forms of style-box analysis, provides an incorrect picture of style and risk for as much as a fifth of large- and mega-cap funds. In practice, these funds have the risk and return profiles of small-cap funds. Misidentifying such “Small-Cap Large-Cap Funds” distorts the risk […]
Hidden Bond Exposures in Equity Portfolios
This year, equity fund investors have been reading – and will soon read more – quarterly letters lamenting volatility and poor performance. The true reasons are rarely identified. Portfolio managers themselves may not fully understand the causes. The hidden bond exposure in equity portfolios is often the culprit.
Hidden B[…]
Industry-Specific Security Selection – Greenlight Capital
Investors typically treat all ideas of excellent managers with equal deference. This is usually a mistake – even the most skilled managers are seldom equally skilled in all areas. Skilled managers may derive all of their risk-adjusted performance from a few specific areas, and under-perform in others.
Greenlight Capital – Lon[…]
Hedge Fund Closet Indexing
To generate active returns in excess of its fees, an active fund must take some active risk. However, some managers passively manage their funds but charge active fees. Others become less active as they accumulate assets. This problem of closet indexing is not confined to mutual funds. Over a third of the long capital of U.S. hedge funds is invest[…]
Mutual Fund Closet Indexing – Part 3
An actively managed fund must take risk sufficient to generate active returns in excess of the fees that it charges. However, as skilled managers accumulate assets, they tend to become less active. Skilled managers who took sufficient active risk to earn their fees in the past may be closet indexing today. Consequently, over two thirds of […]
Mutual Fund Closet Indexing – Part 2
To be worth the fees it charges, an actively managed fund must take some active risk, rather than merely mirror passive market exposures. However, over a quarter of “active” medium and lower turnover US mutual funds take so little active risk, they are unlikely to earn their management fees. In this article, we build on our earlier work and estimate th[…]
Sector Performance – First Half 2014
Market noise obscures the true relationships among individual sectors and true industry-specific performance. By stripping away market and broad macroeconomic effects, we can derive the returns of pure sector factors. Without proper analysis of these factors, accurate risk management, performance attribution, and manager skill evaluation are impossible. Invest[…]
Mutual Fund Closet Indexing – Part 1
Closet indexing may be practiced by 20% to 50% of “active” medium and lower turnover US mutual funds. To make this case, we improve on traditional holdings- and returns-based closet indexing metrics. Simply by testing for closet indexing, investors can save billions in management fees each year.
Closet Indexing
A 2009 study introduced the conce[…]
Three Holdings-Based Style Analysis Tests
This article is part of an ongoing series exploring flaws in popular investment risk and skill evaluation techniques. We focus on the most common pitfalls that have been particularly costly for asset managers and fund investors over the years.
The two primary approaches to investment risk and skill evaluation are returns-based sty[…]
The Flaws of Returns-Based Style Analysis
Investment risk and skill evaluation frequently relies on returns-based style analysis, and returns-based performance attribution. These techniques perform regressions […]

