Tag Archives: skill

Hedge Funds’ Best and Worst Sectors

Due to the congestion of their investor base, crowded hedge fund stocks are volatile and vulnerable to mass selling. The risk-adjusted performance of consensus bets tends to disappoint. In two past pieces we illustrated the toll of crowding on exploration and production as well as internet companies. We also reviewed two specific crowded bets: SanDisk and eHealth.

While crowded hedge fund ideas do poorly most of the time, they don’t always. Market efficiency varies across sectors, and some industries are more analytically tractable than others. In this article we survey the sectors with the best and worst hedge fund performance records. We will illustrate when investors should stay clear of crowded ideas and when they can embrace them.

Analyzing Hedge Fund Performance and Crowding

To explore performance and crowding we analyze hedge fund sector holdings (HF Sector Aggregate) relative to the Sector Market Portfolio (Sector Aggregate). HF Sector Aggregate is position-weighted, and Sector Aggregate is capitalization-weighted. This follows the approach of our earlier articles on aggregate and sector-specific hedge fund crowding.

Hedge Funds’ Worst Sector: Miscellaneous Metals and Mining

Historical Hedge Fund Performance: Miscellaneous Metals and Mining

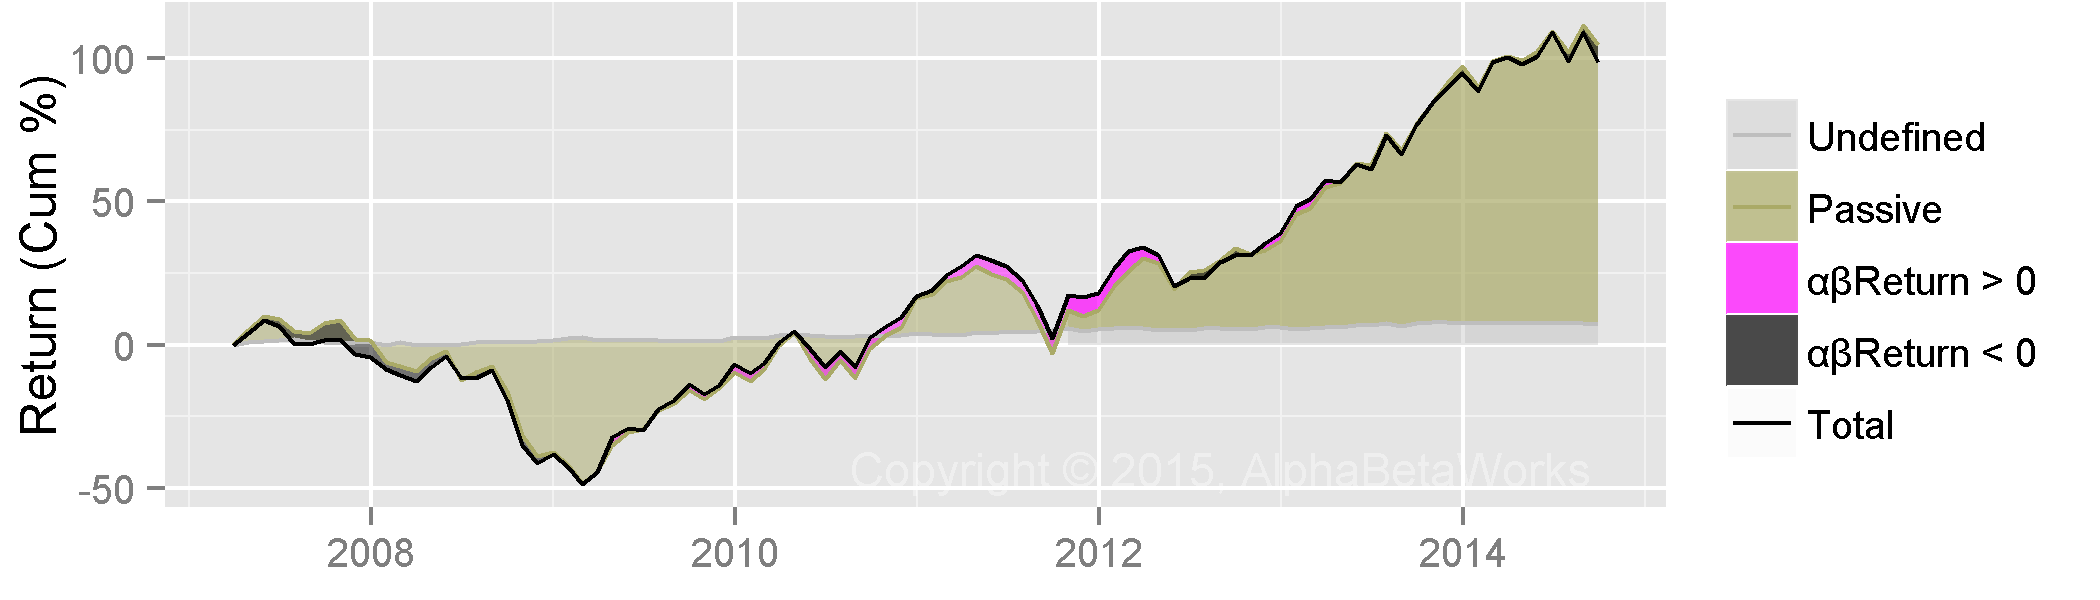
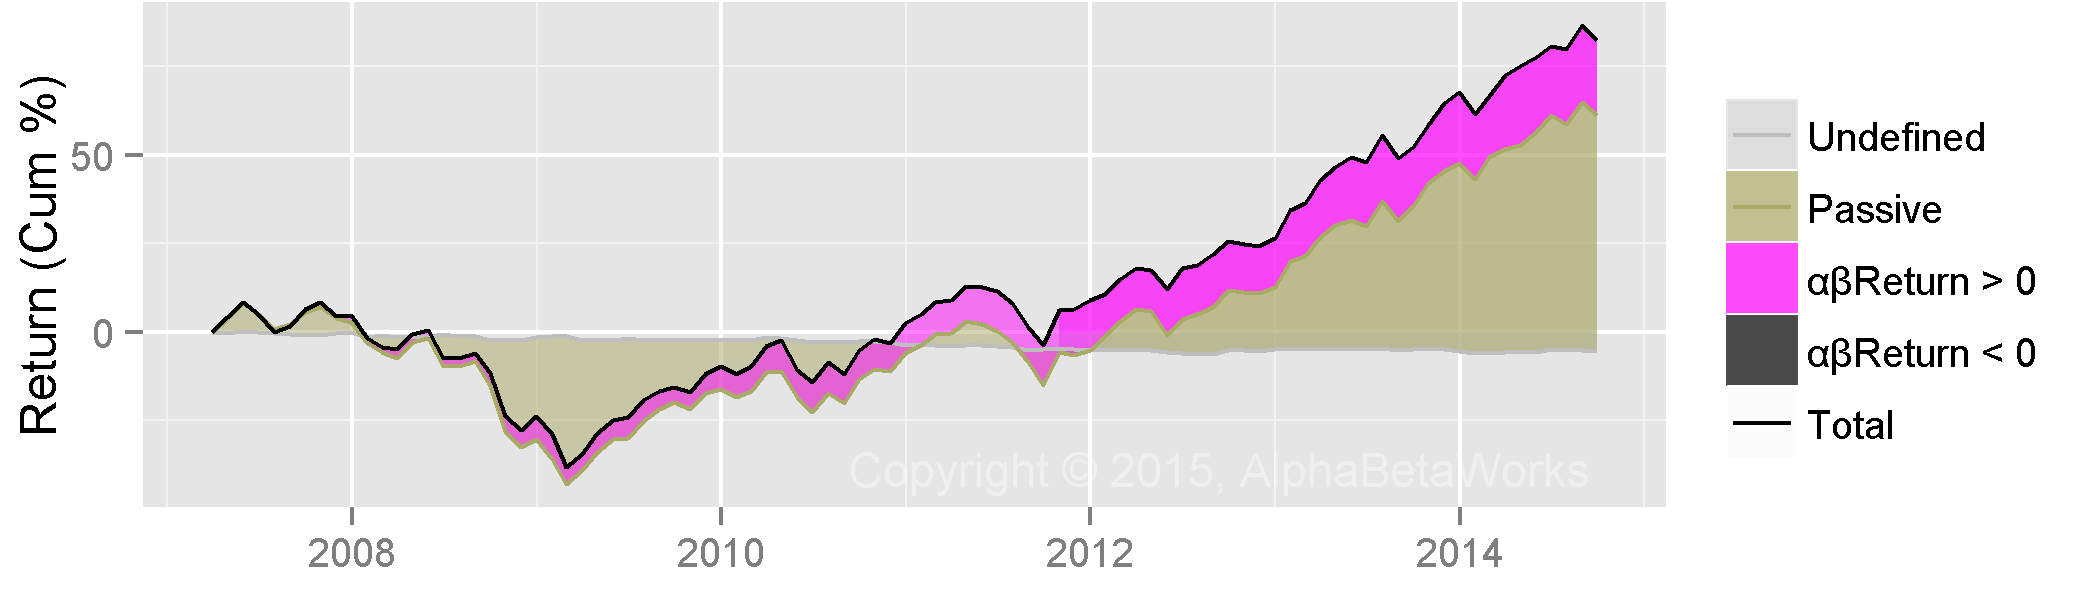
Hedge funds’ worst security selection performance for the past ten years has been in the Miscellaneous Metals and Mining sector. The figure below plots historical HF Miscellaneous Metals and Mining Aggregate’s return. Factor return is due to systematic (market) risk. It is the return of a portfolio that replicates HF Sector Aggregate’s market risk. The blue area represents positive and the gray area represents negative risk-adjusted returns from security selection (αReturn).

Chart of the historical total, factor, and security selection performance of the Hedge Fund Miscellaneous Metals and Mining Sector Aggregate

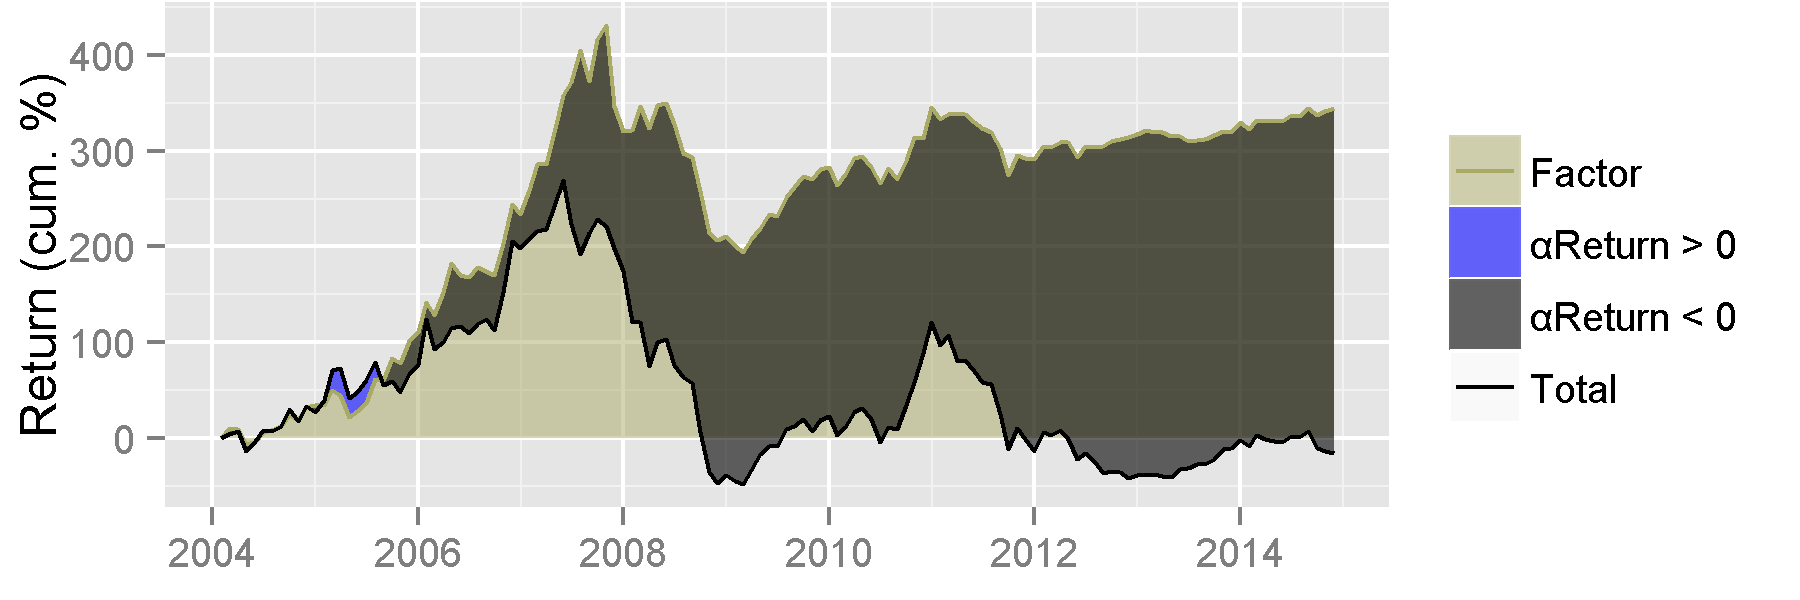
Hedge Fund Miscellaneous Metals and Mining Sector Aggregate Historical Performance

Even without adjusting for risk, crowded bets have done poorly. They consistently underperformed the factor portfolio, missing out on over 300% in gains.

The HF Sector Aggregate’s risk-adjusted return from security selection (αReturn) is the return it would have generated if markets were flat – all market effects on performance have been eliminated. This idiosyncratic performance of the crowded portfolio is a decline of 87%. Crowded bets in this sector are especially dangerous, given their persistently poor performance:

Chart of the historical security selection performance of the Hedge Fund Miscellaneous Metals and Mining Sector Aggregate

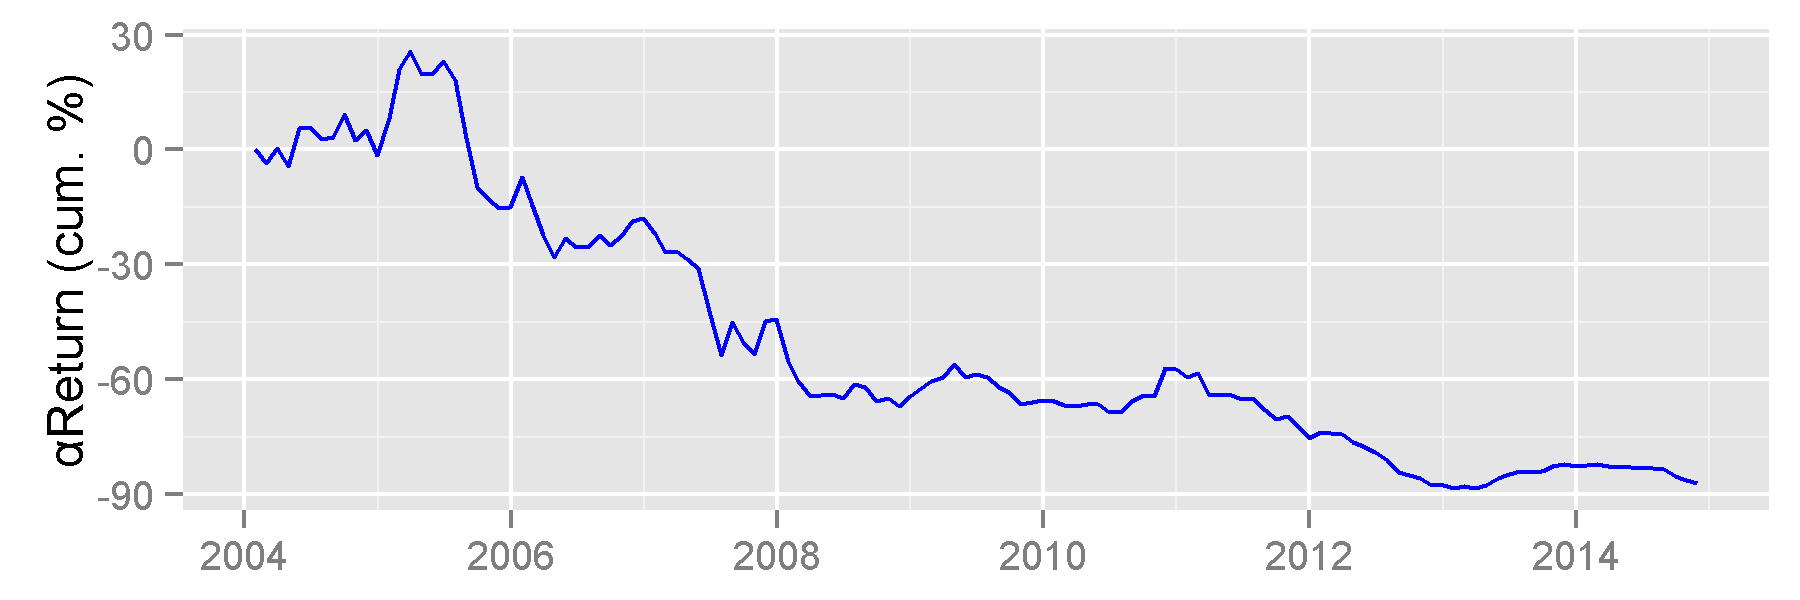
Hedge Fund Miscellaneous Metals and Mining Sector Aggregate Historical Security Selection Performance

In this sector, hedge funds lost $900 million to other market participants. In commodity industries, the recipients of this value transfer are usually private investors and insiders.

Current Hedge Fund Bets: Miscellaneous Metals and Mining

The following stocks contributed most to the relative residual (security-specific) risk of the HF Miscellaneous Metals and Mining Sector Aggregate as of Q3 2014. Blue bars represent long (overweight) exposures relative to the Sector Aggregate. White bars represent short (underweight) exposures. Bar height represents contribution to relative stock-specific risk:

Chart of the top contributors' contribution to the Hedge Fund Miscellaneous Metals and Mining Sector Aggregate's risk

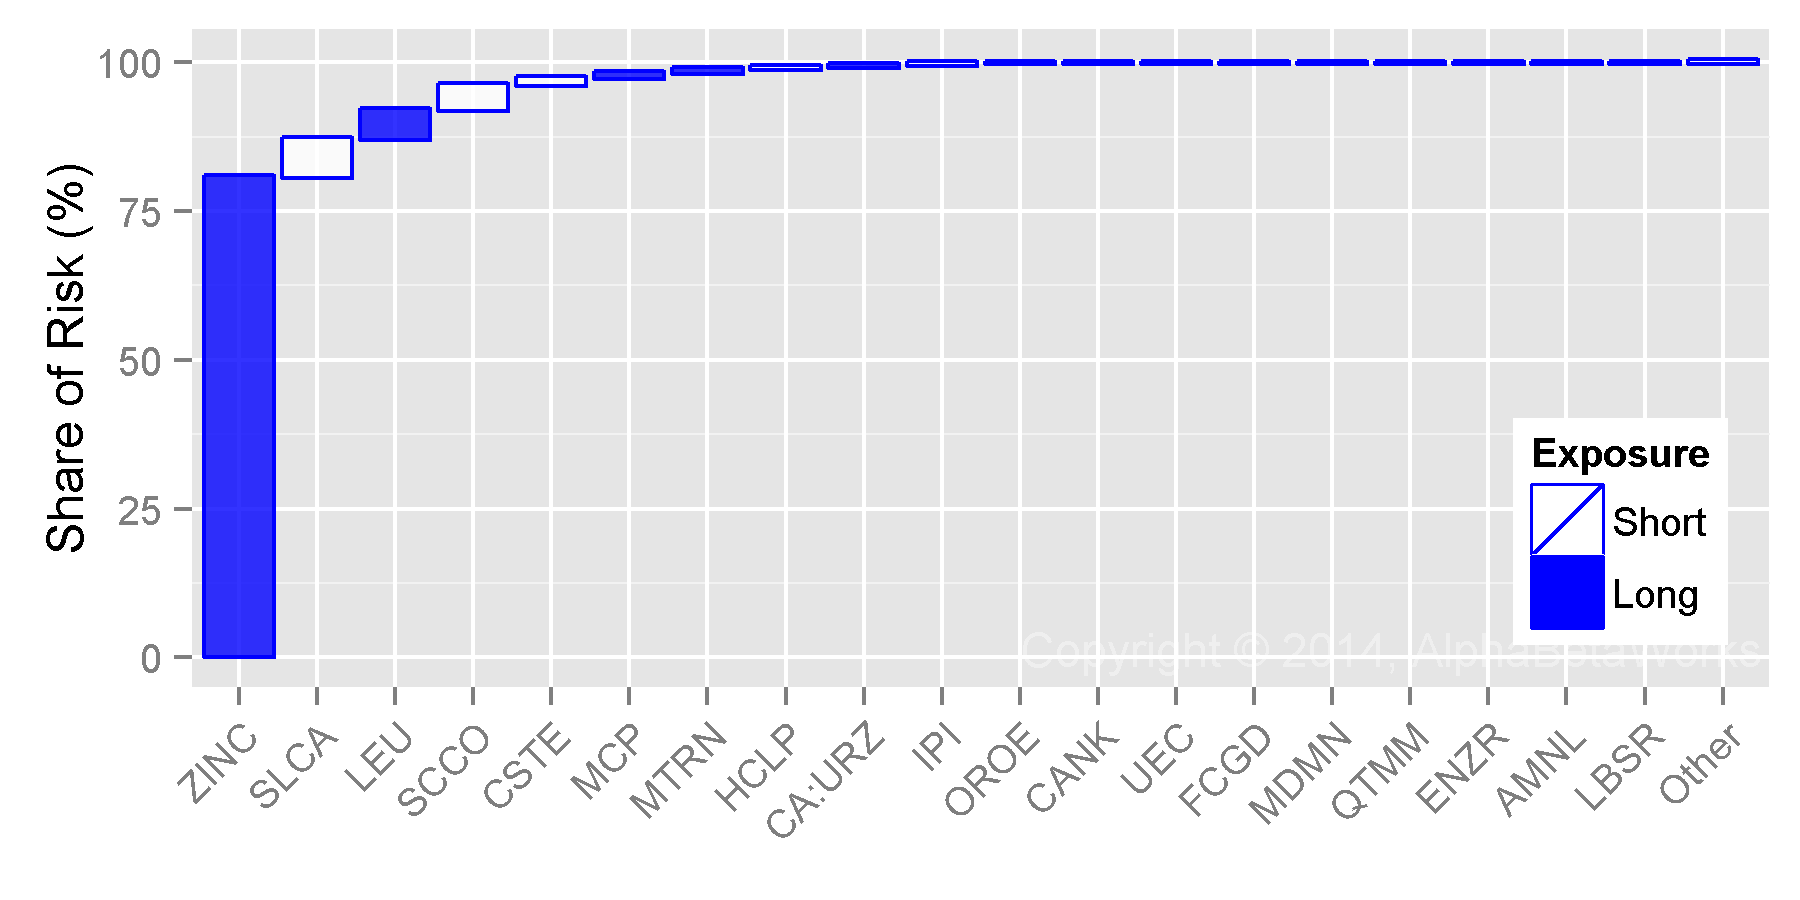
Crowded Hedge Fund Miscellaneous Metals and Mining Sector Bets

The following table contains detailed data on these crowded bets. Large and illiquid long (overweight) bets are most at risk of volatility, mass liquidation, and underperformance:

Exposure (%) Net Exposure Share of Risk (%)
HF Sector Aggr. Sector Aggr. % $mil Days of Trading
ZINC Horsehead Holding Corp. 72.74 2.41 70.33 148.5 15.6 80.55
SLCA U.S. Silica Holdings, Inc. 0.30 9.68 -9.39 -19.8 -0.2 6.45
LEU Centrus Energy Corp. Class A 4.54 0.22 4.32 9.1 17.2 4.85
SCCO Southern Copper Corporation 7.69 70.19 -62.51 -132.0 -2.3 4.18
CSTE CaesarStone Sdot-Yam Ltd. 0.00 5.18 -5.18 -10.9 -0.8 1.14
MCP Molycorp, Inc. 3.84 0.84 3.01 6.3 1.7 0.92
MTRN Materion Corporation 7.15 1.82 5.33 11.3 2.1 0.69
HCLP Hi-Crush Partners LP 0.49 2.90 -2.41 -5.1 -0.2 0.35
CA:URZ Uranerz Energy Corporation 2.00 0.27 1.72 3.6 11.7 0.29
IPI Intrepid Potash, Inc. 0.36 3.38 -3.02 -6.4 -0.5 0.22
OROE Oro East Mining, Inc. 0.00 0.52 -0.52 -1.1 -39.9 0.05
CANK Cannabis Kinetics Corp. 0.00 0.10 -0.10 -0.2 -2.7 0.05
UEC Uranium Energy Corp. 0.00 0.33 -0.33 -0.7 -0.4 0.02
FCGD First Colombia Gold Corp. 0.00 0.09 -0.09 -0.2 -19.0 0.02
MDMN Medinah Minerals, Inc. 0.00 0.16 -0.16 -0.3 -4.8 0.01
QTMM Quantum Materials Corp. 0.00 0.13 -0.13 -0.3 -6.3 0.00
ENZR Energizer Resources Inc. 0.00 0.12 -0.12 -0.3 -11.7 0.00
AMNL Applied Minerals, Inc. 0.00 0.20 -0.20 -0.4 -18.5 0.00
LBSR Liberty Star Uranium and Metals Corp. 0.00 0.03 -0.03 -0.1 -4.9 0.00
Other Positions 0.61 0.21
Total 100.00

Hedge Funds’ Best Sector: Real Estate Development

Historical Hedge Fund Performance: Real Estate Development

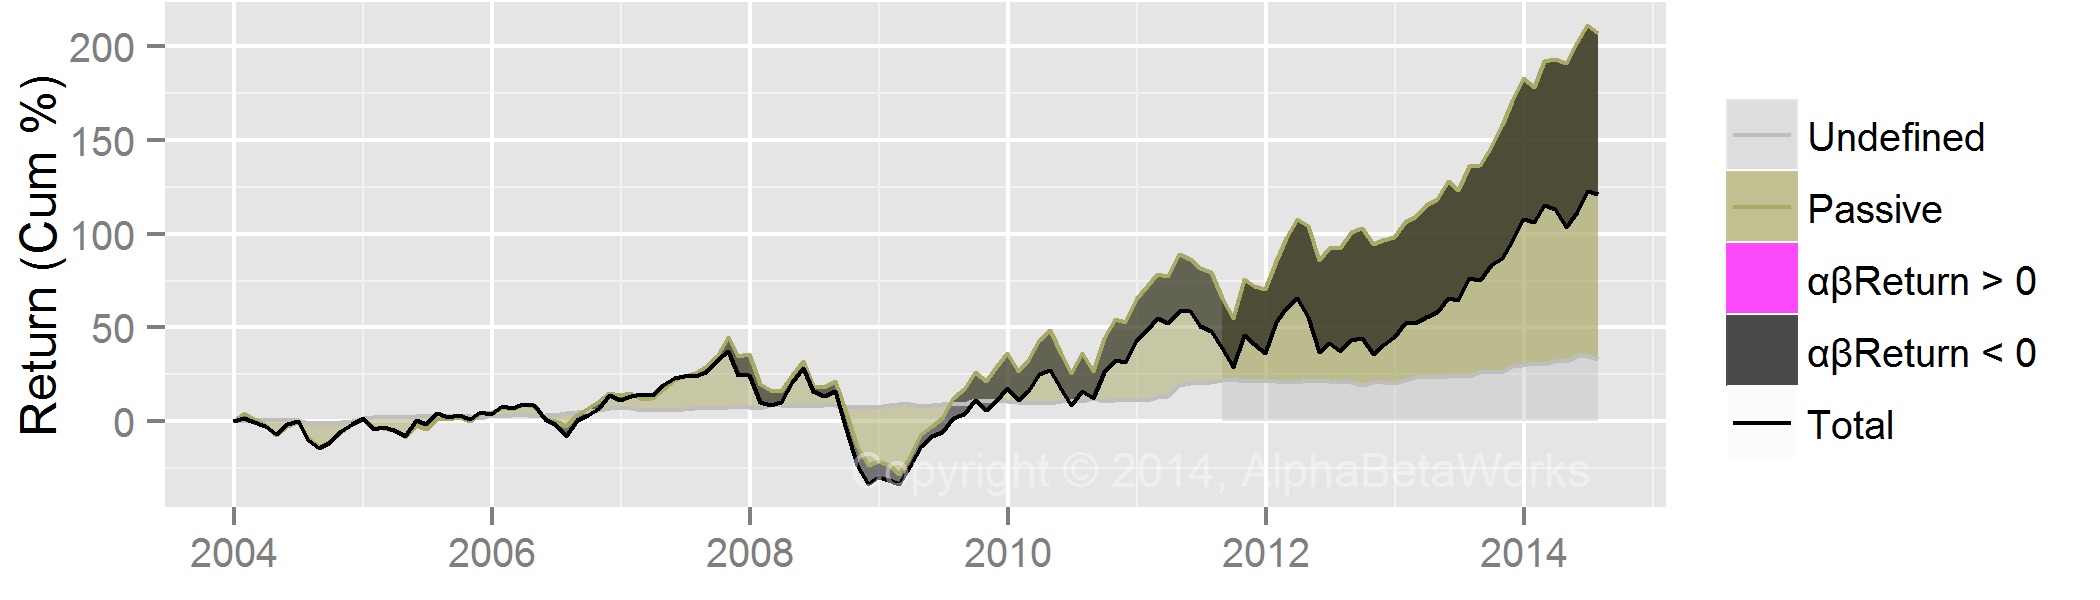
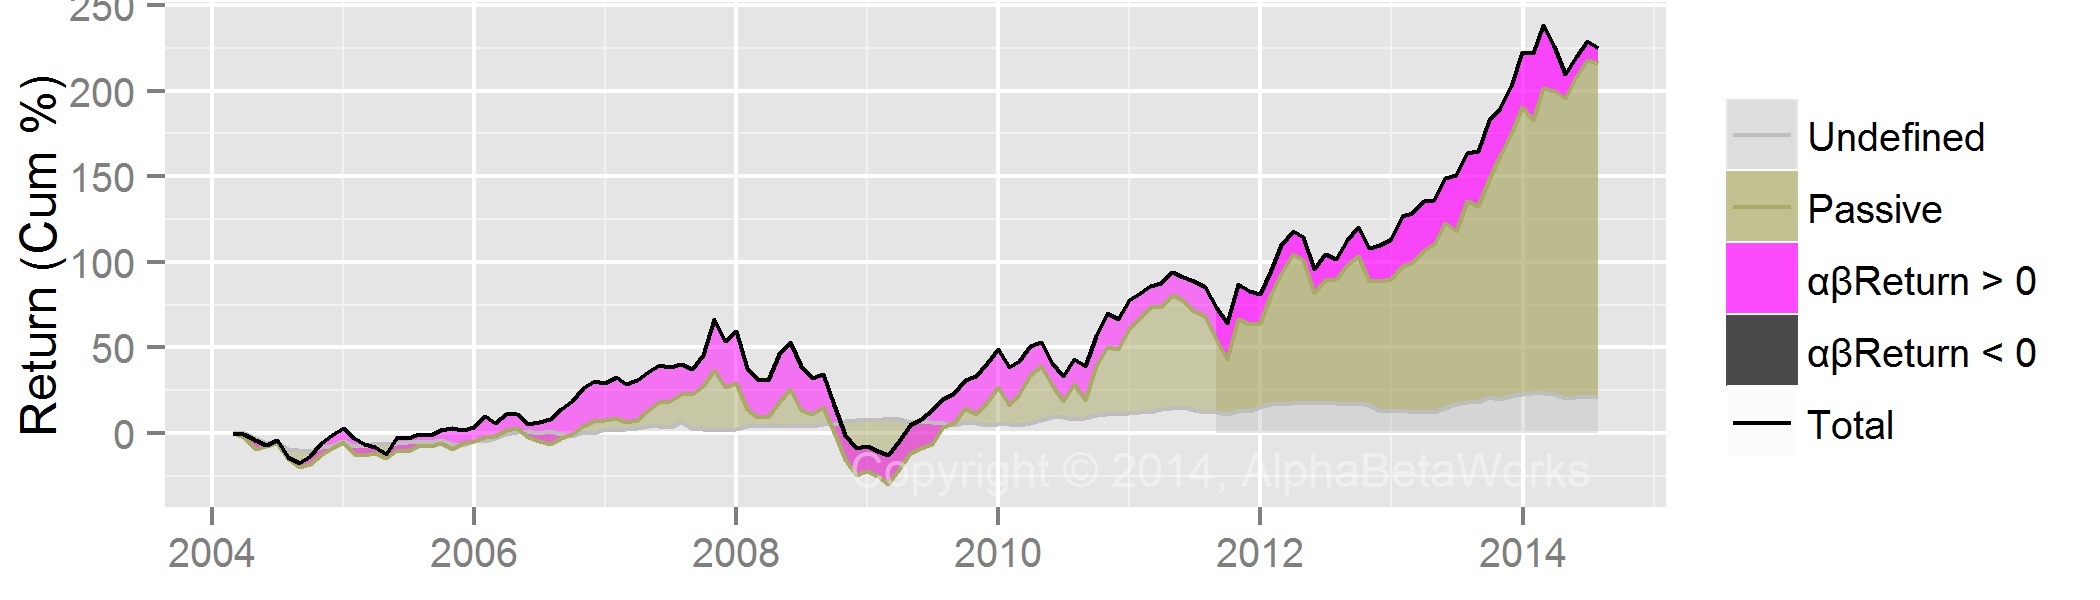
Hedge funds’ best security selection performance has been in the Real Estate Development Sector. The figure below plots the historical return of HF Real Estate Development Aggregate. Factor return and αReturn are defined as above:

Chart of the historical total, factor, and security selection returns of the Hedge Fund Real Estate Development Sector Aggregate

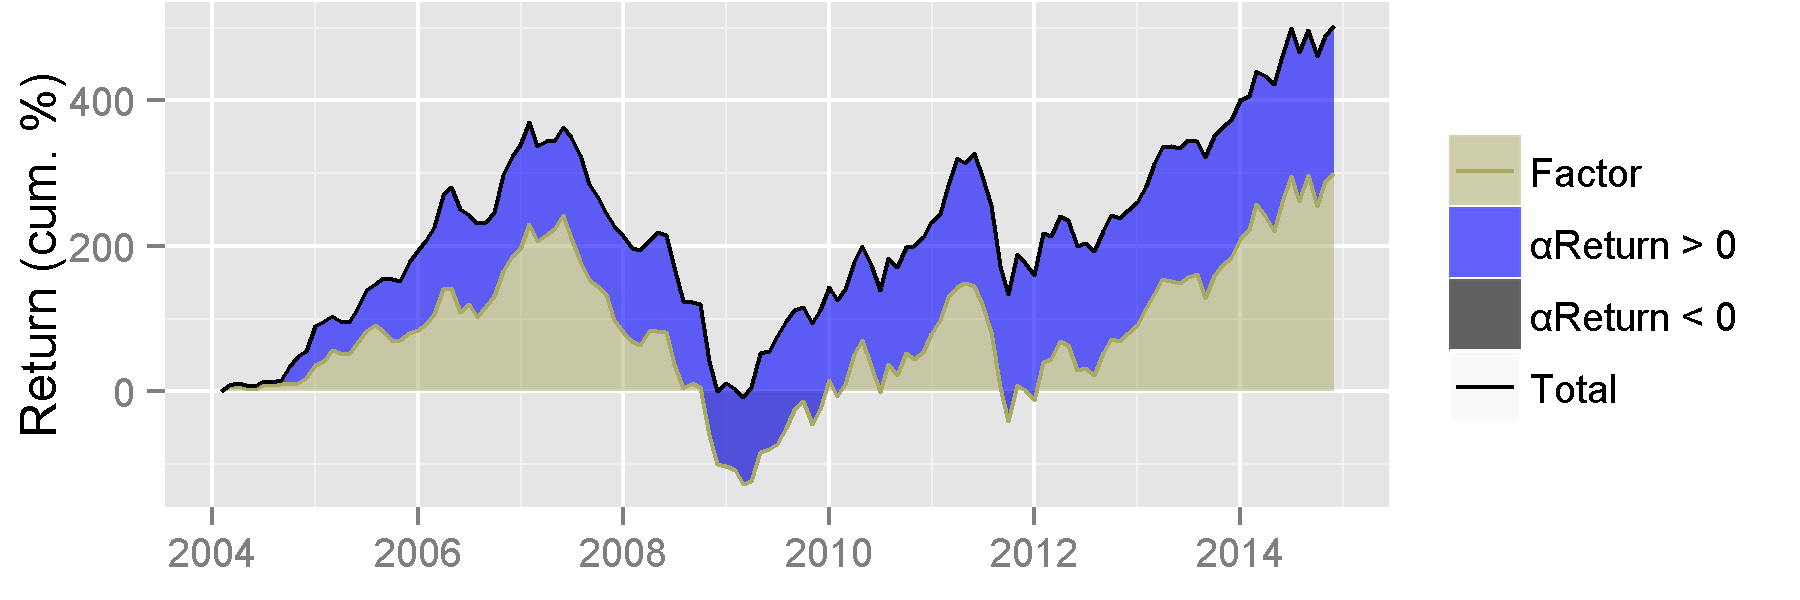
Hedge Fund Real Estate Development Sector Aggregate Historical Performance

Since 2004, the HF Sector Aggregate outperformed the portfolio with equivalent market risk by approximately 200%. In a flat market, HF Sector Aggregate would have gained approximately 180%:

Chart of the historical security selection (residual) return of the Hedge Fund Real Estate Development Sector Aggregate

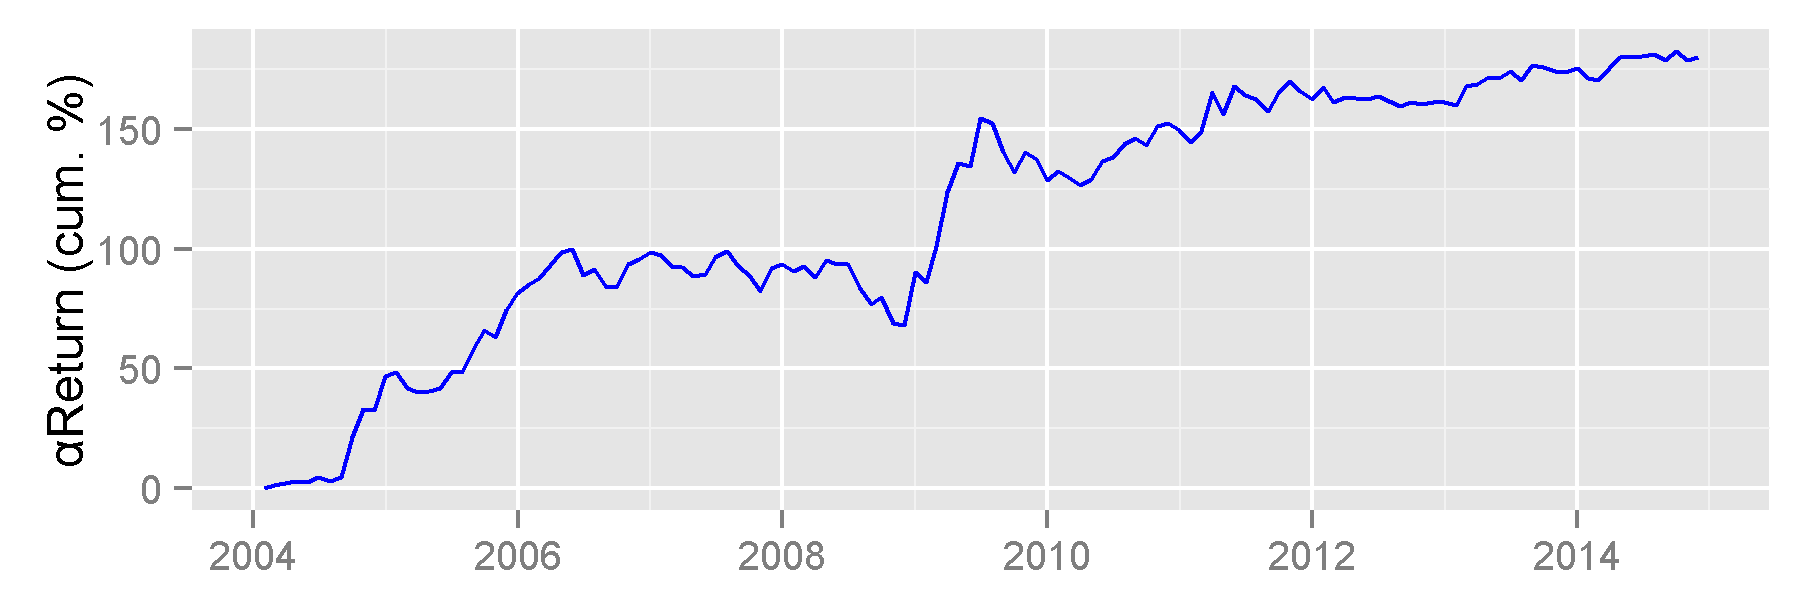
Hedge Fund Real Estate Development Sector Aggregate Historical Security Selection Performance

In this sector, hedge funds gained $1 billion at the expense of other market participants. The Real Estate Development Sector appears less efficient but tractable, providing hedge funds with consistent stock picking gains.

Current Hedge Fund Real Estate Development Bets

The following stocks contributed most to the relative residual (security-specific) risk of the HF Real Estate Development Sector Aggregate as of Q3 2014:

Chart of the contribution to the residual (stock-specific) risk of the various hedge fund Crowded Hedge Fund Real Estate Development Sector bets

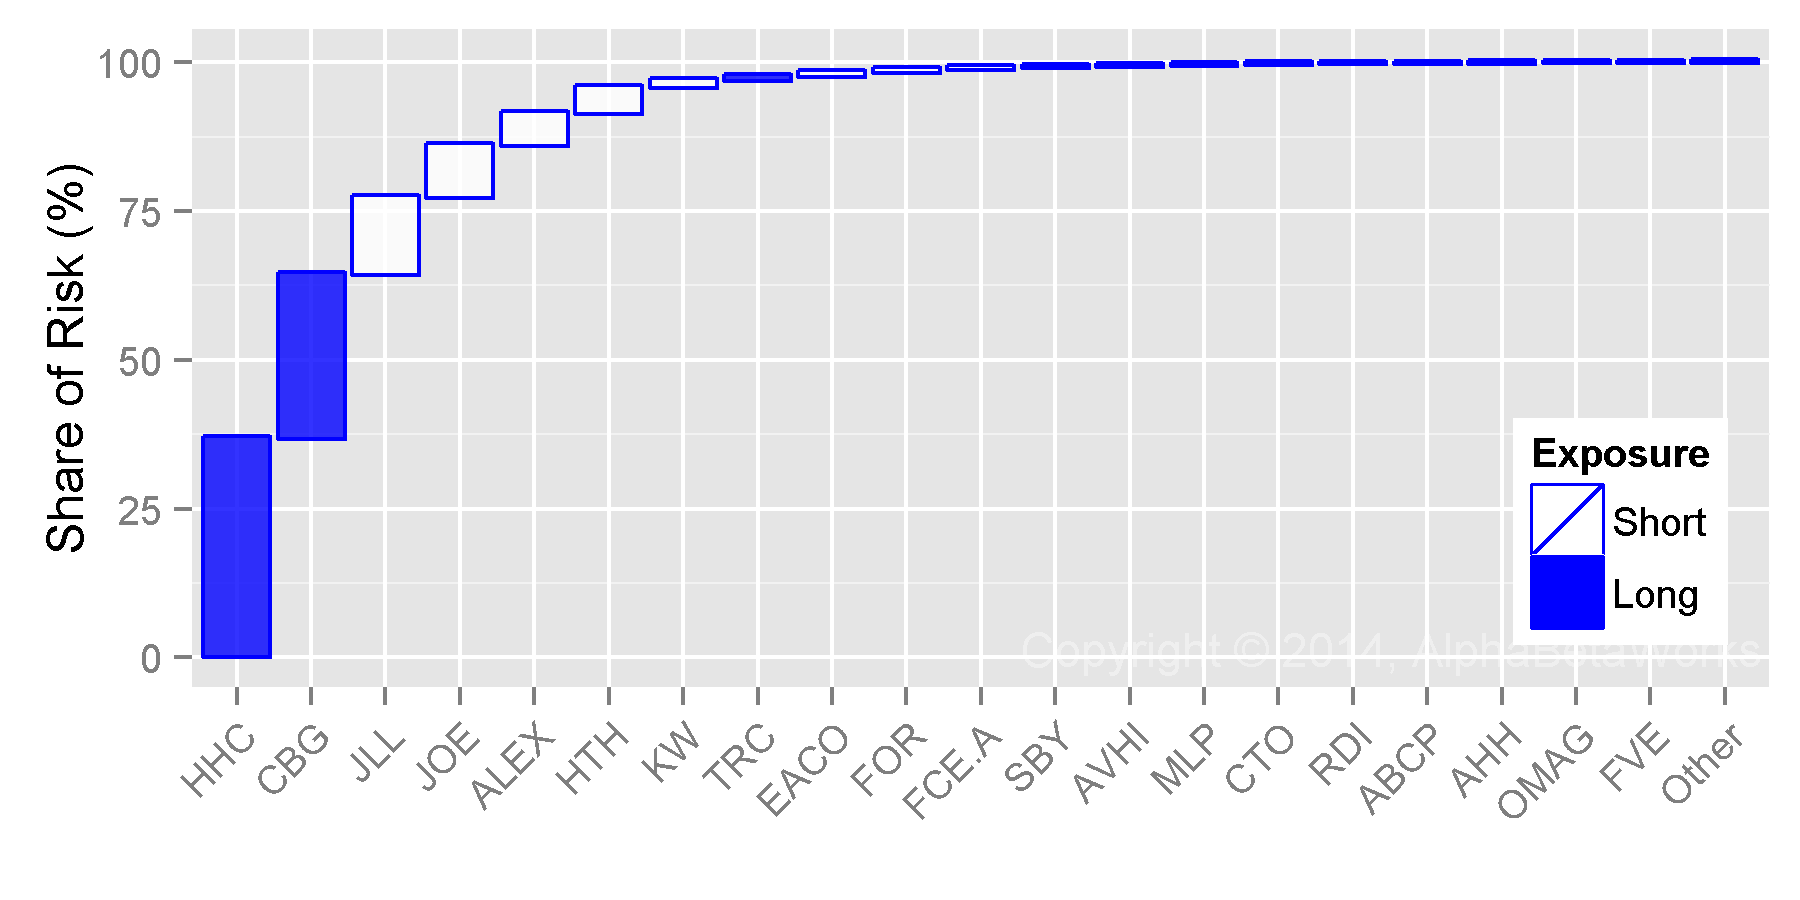
Crowded Hedge Fund Real Estate Development Sector Bets

The following table contains detailed data on these crowded bets. Since in this sector hedge funds are “smart money,” large long (overweight) bets are most likely to outperform and large short (underweight) bets at most likely to do poorly:

Exposure (%) Net Exposure Share of Risk (%)
HF Sector Aggr. Sector Aggr. % $mil Days of Trading
HHC Howard Hughes Corporation 28.47 15.98 12.49 326.5 17.5 36.73
CBG CBRE Group, Inc. Class A 52.28 26.54 25.74 672.7 10.8 27.58
JLL Jones Lang LaSalle Incorporated 0.14 15.21 -15.07 -393.9 -8.5 12.86
JOE St. Joe Company 0.04 4.94 -4.91 -128.2 -13.5 8.82
ALEX Alexander & Baldwin, Inc. 0.00 4.71 -4.71 -123.2 -13.5 5.38
HTH Hilltop Holdings Inc. 1.35 4.86 -3.51 -91.8 -18.3 4.29
KW Kennedy-Wilson Holdings, Inc. 3.60 6.11 -2.51 -65.6 -7.6 1.19
TRC Tejon Ranch Co. 3.36 1.55 1.81 47.2 37.9 0.77
EACO EACO Corporation 0.00 0.22 -0.22 -5.7 -436.1 0.65
FOR Forestar Group Inc. 0.62 1.66 -1.05 -27.3 -5.3 0.42
FCE.A Forest City Enterprises, Inc. Class A 8.78 10.56 -1.78 -46.5 -1.9 0.35
SBY Silver Bay Realty Trust Corp. 0.07 1.68 -1.61 -42.0 -8.4 0.23
AVHI A V Homes Inc 0.26 0.87 -0.61 -15.8 -28.7 0.20
MLP Maui Land & Pineapple Company, Inc. 0.00 0.29 -0.29 -7.5 -132.0 0.10
CTO Consolidated-Tomoka Land Co. 0.16 0.77 -0.61 -15.9 -24.5 0.09
RDI Reading International, Inc. Class A 0.02 0.54 -0.52 -13.7 -14.2 0.08
ABCP AmBase Corporation 0.00 0.15 -0.15 -3.8 -130.1 0.06
AHH Armada Hoffler Properties, Inc. 0.00 0.59 -0.59 -15.5 -9.4 0.06
OMAG Omagine, Inc. 0.00 0.07 -0.07 -1.9 -24.7 0.05
FVE Five Star Quality Care, Inc. 0.26 0.49 -0.23 -6.1 -5.1 0.04
Other Positions 0.01 0.07
Total 100.00

Real Estate Development is not the only sector where hedge funds excel. Crowded Coal, Hotels, and Forest Product sector ideas have also done well. Skills vary within each sector: The most skilled funds persistently generate returns in excess of the crowd, while the least skilled funds persistently fall short. Performance analytics built on robust risk models help investors and allocators reliably identify each.

Conclusions

  • With proper data, attention to hedge fund crowding prevents “unexpected” volatility and losses.
  • Market efficiency and tractability vary across sectors – crowded hedge fund bets do poorly in most sectors, but do well in some.
  • Investors should avoid crowded ideas in sectors of persistent hedge fund underperformance, such as Miscellaneous Metals and Mining.
  • Investors can embrace crowded ideas in sectors of persistent hedge fund outperformance, such as Real Estate Development.
  • Funds with significant and persistent stock picking skills exist in most sectors, even those with generally poor hedge fund performance. AlphaBetaWorks’ Skill Analytics identify best overall and sector-specific stock pickers.
The information herein is not represented or warranted to be accurate, correct, complete or timely.
Past performance is no guarantee of future results.
Copyright © 2012-2015, AlphaBetaWorks, a division of Alpha Beta Analytics, LLC. All rights reserved.
Content may not be republished without express written consent.

Returns-Based Style Analysis – Overfitting and Collinearity

Plagued by overfitting and collinearity, returns-based style analysis frequently fails, confusing noise with portfolio risk.

Returns-based style analysis (RBSA) is a common approach to investment risk analysis, performance attribution, and skill evaluation. Returns-based techniques perform regressions of returns over one or more historical periods to compute portfolio betas (exposures to systematic risk factors) and alphas (residual returns unexplained by systematic risk factors). The simplicity of the returns-based approach has made it popular, but it comes at a cost – RBSA fails for active portfolios. In addition, this approach is plagued by the statistical problems of overfitting and collinearity, frequently confusing noise with systematic portfolio risk. 

Returns-Based Style Analysis – Failures for Active Portfolios

In an earlier article we illustrated the flaws of returns-based style analysis when factor exposures vary, as is common for active funds:

  • Returns-based analysis typically yields flawed estimates of portfolio risk.
  • Returns-based analysis may not even accurately estimate average portfolio risk.
  • Errors will be most pronounced for the most active funds:
    • Skilled funds may be deemed unskilled.
    • Unskilled funds may be deemed skilled.

These are not the only flaws. We now turn to the subtler and equally critical issues – failures in the underlying regression analysis itself. We use a recent Morningstar article as an example.

iShares Core High Dividend ETF (HDV) – Returns-Based Style Analysis

A recent Seeking Alpha article provides an excellent illustration of problems created by overfitting and collinearity. In this article, Morningstar performed a returns-based style analysis of iShares Core High Dividend ETF (HDV).

Morningstar estimated the following factor exposures for HDV using the Carhart model:

Morningstar: Returns-Based Analysis of the iShares Core High Dividend ETF (HDV) Using the Carhart Model

iShares Core High Dividend ETF (HDV) – Estimated Factor Exposures Using the Carhart Model – Source: Morningstar

The Mkt-RF coefficient, or loading, is HDV’s estimated market beta. A beta value of 0.67 means that given a +1% change in the market HDV is expected to move by +0.67%, everything else held constant.

The article then performs RBSA using an enhanced Carhart + Quality Minus Junk (QMJ) model:

Morningstar: Returns-Based Analysis of iShares Core High Dividend ETF (HDV) Using the Carhart + Quality Minus Junk (QMJ) Model

iShares Core High Dividend ETF (HDV) – Estimated Factor Exposures Using the Carhart + Quality Minus Junk (QMJ) Model – Source: Morningstar

With the addition of the QMJ factor, the market beta estimate increased by a third from 0.67 to 0.90. Both estimates cannot be right. Perhaps the simplicity of the Carhart model is to blame and the more complex 5-factor RBSA is more accurate?

iShares Core High Dividend ETF (HDV) – Historical Factor Exposures

Instead of Morningstar’s RBSA approach, we analyzed HDV’s historical holdings using the AlphaBetaWorks’ U.S. Equity Risk Model. For each month, we estimated the U.S. Market exposures (betas) of individual positions and aggregated these into monthly estimates of portfolio beta:

Chart of the historical market exposure (beta) of iShares Core High Dividend ETF (HDV)

iShares Core High Dividend ETF (HDV) – Historical Market Exposure (Beta)

Over the past 4 years, HDV’s market beta varied in a narrow range between 0.50 and 0.62.

Both of the above returns-based analyses were off, but the simpler Carhart model did best. It turns out the simpler and a less sophisticated returns-based model is less vulnerable to the statistical problems of multicollinearity and overfitting. Notably, the only way to find out that returns-based style analysis failed was to perform the more advanced holdings-based analysis using a multi-factor risk model.

Statistical Problems with Returns-Based Analysis

Multicollinearity

Collinearity (Multicollinearity) occurs when risk factors used in returns-based analysis are highly correlated with each other. For instance, small-cap stocks tend to have higher beta than large-cap stocks, so the performance of small-cap stocks relative to large-cap stocks is correlated to the market.

Erratic changes in the factor exposures for various time periods, or when new risk factors are added, are signs of collinearity. These erratic changes make it difficult to pin down factor exposures and are signs of deeper problems:

A principal danger of such data redundancy is that of overfitting in regression analysis models.
-Wikipedia

Overfitting

Overfitting is a consequence of redundant data or model over-complexity. These are common for returns-based analyses which usually attempt to explain a limited number of return observations with a larger number of correlated variable observations.

An overfitted returns-based model may appear to describe data very well. But the fit is misleading – the exposures may be describing noise and will change dramatically under minor changes to data or factors. A high R squared from returns-based models may be a sign of trouble, rather than a reassurance.

As we have seen with the HDV example above, exposures estimated by RBSA may bear little relationship to portfolio risk. Therefore, all dependent risk and skill data will be flawed.

Conclusions

  • When a manager does not vary exposures to the market, sector, and macroeconomic factors, returns-based style analysis (RBSA) using a parsimonious model can be effective.
  • When a manager varies bets, RBSA typically yields flawed estimates of portfolio risk.
  • Even when exposures do not vary, returns-based style analysis is vulnerable to multicollinearity and overfitting:
    • The model may capture noise, rather than the underlying factor exposures.
    • Factor exposures may vary erratically among estimates.
    • Estimates of portfolio risk will be flawed.
    • Skilled funds may be deemed unskilled.
    • Unskilled funds may be deemed skilled.
  • Holdings-based analysis using a robust multi-factor risk model is superior for quantifying fund risk and performance.
The information herein is not represented or warranted to be accurate, correct, complete or timely.
Past performance is no guarantee of future results.
Copyright © 2012-2015, AlphaBetaWorks, a division of Alpha Beta Analytics, LLC. All rights reserved.
Content may not be republished without express written consent.

When “Smart Beta” is Simply High Beta

WisdomTree Mid Cap Earnings Fund (EZM) vs. PowerShares Dynamic Large Cap Value Portfolio (PWV)

Many “smart beta” funds are merely high-beta, delivering no value over traditional index funds. On the other hand, some smart beta strategies are indeed exceptional and worth their fees.

Most analyses of enhanced index funds and smart beta strategies lack a rigorous approach to risk evaluation and performance attribution. Consequently, risky and mediocre funds are mislabeled as excellent, while conservative and exceptional funds are wrongly considered mediocre. Investors relying on simplistic analyses may end up with mediocre funds, hidden risks, and subpar performance.

The Not-So-Smart Beta

Some smart beta funds deliver consistent outperformance with high liquidity and low tracking error. Others merely deliver high market beta or high exposures to other common risk factors. Analyses of these funds’ performance are usually simplistic, failing to differentiate between the two groups.

Enhanced indexing and smart beta strategies are usually more active than the underlying indices. This can cause their risk to vary dramatically over time. For instance, a fund’s market beta can vary by 40-50% over a few years. This variation makes it difficult to determine whether a particular strategy is smart or merely risky. When a market correction arrives, risky funds suffer outsized losses.

Many estimate the beta of a fund by fitting its returns to the market or a benchmark using a regression, a technique known as returns-based style analysis. This is a flawed approach, which fails to accurately estimate the risk of active strategies. We discussed the flaws of returns-based style analysis in earlier articles.

A robust approach to estimating a fund’s historical risk and risk-adjusted performance is to evaluate its holdings over time. At each period, the risk of individual holdings is aggregated to estimate the risk of the fund. This is AlphaBetaWorks’ approach, implemented in our Performance Analytics Platform. Our analysis reveals that many “smart beta” funds are merely high-beta. These funds deliver no value over traditional index funds. On the other hand, some smart beta strategies are indeed exceptional and worth the fees they charge.

WisdomTree Mid Cap Earnings Fund (EZM) – Historical Risk

On the surface, the returns of the WisdomTree Mid Cap Earnings Fund (EZM) appear strong. The fund has dramatically outperformed its broad benchmark, the Russell Midcap Index (IWR):

Chart of the Cumulative Return of WisdomTree Mid Cap Earnings Fund (EZM) and of the Benchmark (IWR)

Cumulative Return of WisdomTree Mid Cap Earnings Fund (EZM) vs the Benchmark (IWR)

However, this is nominal outperformance, not risk-adjusted outperformance.

The main source of security risk and return is market risk, or beta. With this in mind, we analyzed the holdings of EZM and IWR during each historical period, calculated their holdings’ risk, and calculated the total risk of each fund. Not surprisingly, IWR’s beta has been stable, averaging 1.09 (109% of the risk of U.S. Market). Meanwhile, EZM’s beta has varied in a wide range, averaging 1.18 (118% of the risk of U.S. Market):

Chart of the historical beta of the WisdomTree Mid Cap Earnings Fund (EZM) compared to the historical beta of the Benchmark (IWR)

Historical Beta of WisdomTree Mid Cap Earnings Fund (EZM) vs the Benchmark (IWR)

EZM had higher returns, but it also consistently took more market risk. With greater risk comes greater volatility, and a down cycle will affect EZM more.

To determine its risk-adjusted return, we must compare the performance of EZM to the performance of a passive portfolio with the same factor exposures.  Below are EZM’s current and historical factor exposures:

Chart of the historical and current factor exposures of the WisdomTree Mid Cap Earnings Fund (EZM)

Historical Factor Exposures of WisdomTree Mid Cap Earnings Fund (EZM)

WisdomTree Mid Cap Earnings Fund (EZM) – Risk-Adjusted Performance

Instead of owning EZM, investors could have owned a passive portfolio with similar risk (a passive replicating portfolio). If EZM had profitably timed the market (varied its risk) or selected securities, it should have outperformed.

EZM’s risk-adjusted performance closely matches a passive replicating portfolio. Relative to its passive equivalent, EZM has generated negligible active return (abReturn in the following chart):

Chart of the historical passive and active returns of the WisdomTree Mid Cap Earnings Fund (EZM)

Historical Passive and Active Return of WisdomTree Mid Cap Earnings Fund (EZM)

PowerShares Dynamic Large Cap Value Portfolio (PWV) – Risk-Adjusted Performance

Let’s contrast the performance of EZM with the results of another smart beta option: PowerShares Dynamic Large Cap Value Portfolio (PWV).

PWV has also varied U.S. Market exposure by approximately 40%:

Chart of the historical and current factor exposures of the PowerShares Dynamic Large Cap Value Portfolio (PWV)

Historical Factor Exposures of PowerShares Dynamic Large Cap Value Portfolio (PWV)

PWV has consistently outperformed its passive replicating portfolio and produced strong active returns due to market timing and security selection:

Chart of the historical passive and active returns of the PowerShares Dynamic Large Cap Value Portfolio (PWV)

Historical Passive and Active Return of PowerShares Dynamic Large Cap Value Portfolio (PWV)

Conclusion

Performance evaluation tools lacking accurate insights into risk may rank the better-performing but riskier EZM ahead of PWV, which produced superior active returns. The accurate picture of their relative active performance emerges once both funds’ historical holdings are examined with a multi-factor risk model and their excess returns distilled.

Unsuspecting investors relying on simplistic analysis may conclude that a risky and mediocre fund is excellent while a conservative and exceptional fund is mediocre. At best, they will face higher-than-anticipated risks. At worst, they will get a nasty surprise when a correction comes.

The information herein is not represented or warranted to be accurate, correct, complete or timely.
Past performance is no guarantee of future results.
Copyright © 2012-2015, 
AlphaBetaWorks, a division of Alpha Beta Analytics, LLC. All rights reserved.
Content may not be republished without express written consent.

Upgrading Fund Active Returns

And Not Missing Out

Maybe your fund took extra risk to keep up with its benchmark. Maybe your fund should have made more – much more – given the risks it took. By the time market volatility reveals underlying exposures, it may be too late to avoid severe losses. There is a better way: Investors can continuously monitor a fund’s risk, the returns it should be generating, and the value it creates. This value should matter most to investors and allocators. Regrettably, most fund analysis tools and services pay no attention to it.

To illustrate, we analyze two funds: one that did much worse than it should have, and one that did better.

PRSCX – Negative Active Returns

The T. Rowe Price Science & Technology Fund (PRSCX) manages approximately $3 billion. This fund generally tracks its benchmark and it gets 3 star rating from a popular service. Notwithstanding this, PRSCX has produced persistently negative active returns. Given its historical risk, PRSCX should have made investors far more money: Over the past ten years, an investor would have made 50-80% more owning a passive portfolio with PRSCX’s risk profile.

Chart of the historical cumulative passive and active returns of T. Rowe Price Science & Technology Fund (PRSCX)

T. Rowe Price Science & Technology Fund (PRSCX) – Passive and Active Return History

While we seem to bolster arguments for passive investing, reality is more complex: Active returns (both positive and negative) persist over time. Thus, upgrading from PRSCX to a fund with persistently positive active returns is a superior move. We will provide one candidate.

PRSCX – Historical Risk

The chart below shows PRSCX’s historical risk (exposures to significant risk factors). The red dots indicate monthly exposures (as a percentage of assets) over the past 10 years; the black diamonds indicate latest exposures:

Chart of the historical exposures of T. Rowe Price Science & Technology Fund (PRSCX) to significant risk factors

T. Rowe Price Science & Technology Fund (PRSCX) – Exposure to Significant Risk Factors

PRSCX varied its exposures over time. U.S. Market is the most important exposure, reaching 200% (market beta of 2) at times. As expected for a technology fund, its U.S. Technology exposure has been near 100%. Also note PRSCX’s occasional short bond exposure. Many equity funds carry large hidden bond bets due to the risk profile of their equity holdings. Most investors and portfolio managers are not aware of these bets. Yet for these funds, bond risk is a key driver of portfolio returns and volatility.

PRSCX – Historical Active Returns

The above exposures define a passive replicating portfolio matching PRSCX’s risk. The fund manager’s job is to outperform this passive alternative by generating active returns.

To isolate active returns, we quantify passive factor exposures, estimate the passive return, and then calculate the remaining active return – αβReturn. We further break down αβReturn into risk-adjusted return from security selection, or stock picking (αReturn), and market timing (βReturn):

Component 2004 2005 2006 2007 2008 2009 2010 2011 2012 2013 2014
Total 1.6 2.46 7.1 11.88 -43.8 67.83 21.25 -4.51 6.25 43.7 9.39
Passive -0.69 1.4 5.45 19.26 -46.13 77.52 23.21 -3.42 20.36 51.54 13.61
αβReturn 0.98 -0.69 -2.2 -7.45 2.71 -11.61 -2.22 -8.24 -13.76 -14.14 -5.84
αReturn -1.95 -3.29 -6.45 -2.79 7.92 0.78 4.17 -12.31 -11.47 -4.54 1.11
βReturn 2.94 2.6 4.25 -4.66 -5.2 -12.39 -6.39 4.07 -2.29 -9.6 -6.95
Undefined 1.3 1.75 3.85 0.07 -0.38 1.92 0.26 7.15 -0.35 6.3 1.61

Note that we are unable to account for trades behind some of the returns – the “Undefined” component. It may be due to private securities or intra-period trading; it may be passive or active. Yet, even if we assume that all undefined returns above are active, PRSCX still delivered persistently negative αβReturn over the past ten years. Furthermore, the compounding of negative αβReturn leaves investors missing out on 50-80% in gains.

FSCSX – An Upgrade Option with Similar Historical Risk

While a passive portfolio would have been superior to PRSCX, it is not the best upgrade. Allocators and investors can do better owning a fund with consistently positive αβReturns, since αβReturns persist. One candidate is Fidelity Select Software & Computer Services Portfolio (FSCSX):

Chart of the historical exposures of Fidelity Select Software & Computer Services Portfolio (FSCSX) to significant risk factors

Fidelity Select Software & Computer Services Portfolio (FSCSX) – Exposure to Significant Risk Factors

Currently, FSCSX and PRCSX have similar exposures. AlphaBetaWorks’ risk analytics estimate the current annualized tracking error between the two funds at a 5.29% (about the same volatility as bonds, and less than one half of market volatility).

FSCSX – Historical Active Returns

FSCSX’s 3-year trailing average annual return of 23% is slightly ahead of PRSCX’s 20%. But most importantly, given its lower historical risk, FSCSX has delivered positive αβReturns versus PRSCX’s significantly negative ones. The chart below shows FSCSX’s ten-year performance. The purple area is the positive αβReturn. The gray area is FSCSX’s passive return:

Chart of the historical cumulative passive and active returns of Fidelity Select Software & Computer Services Portfolio (FSCSX)

Fidelity Select Software & Computer Services Portfolio (FSCSX) – Passive and Active Return History

FSCSX is superior to a passive portfolio with similar risk and to PRSCX. Mind you, this is not a sales pitch for FSCSX but merely a consequence of its positive αβReturn and αβReturn persistence.

Few fund investors and allocators possess the tools to quantify active returns. Yet, this knowledge is an essential competitive advantage, leading to improved client returns, client retention, and asset growth. Unfortunately, many are content to pick funds based on past nominal returns and to suffer the consequences: picking yesterday’s winners tends to pick tomorrow’s losers. AlphaBetaWorks spares clients from the data processing headaches, financial modeling, and statistical analysis of thousands of portfolios, delivering predictive risk and skill analytics on thousands of funds.

Conclusions

  • Analyzing a fund’s performance relative to a benchmark ignores the most important question: What should you have made given its risk?
  • Some mutual funds produce persistently negative active returns; others produce persistently positive active returns.
  • Upgrading from a fund with persistently negative active return (αβReturn) to a replicating passive portfolio tends to improve performance.
  • Upgrading from a passive portfolio to a fund with persistently positive αβReturn also tends to improve performance.
  • Tools that accurately estimate fund risk and active returns provide enduring competitive advantages for investors and professional allocators, leading to improved client returns, client retention, and asset growth.
The information herein is not represented or warranted to be accurate, correct, complete or timely.
Past performance is no guarantee of future results.
Copyright © 2012-2014, 
AlphaBetaWorks, a division of Alpha Beta Analytics, LLC. All rights reserved.
Content may not be republished without express written consent.