
WisdomTree Mid Cap Earnings Fund (EZM) vs. PowerShares Dynamic Large Cap Value Portfolio (PWV)
Many “smart beta” funds are merely high-beta, delivering no value over traditional index funds. On the other hand, some smart beta strategies are indeed exceptional and worth their fees.
Most analyses of enhanced index funds and smart beta strategies lack a rigorous approach to risk evaluation and performance attribution. Consequently, risky and mediocre funds are mislabeled as excellent, while conservative and exceptional funds are wrongly considered mediocre. Investors relying on simplistic analyses may end up with mediocre funds, hidden risks, and subpar performance.
The Not-So-Smart Beta
Some smart beta funds deliver consistent outperformance with high liquidity and low tracking error. Others merely deliver high market beta or high exposures to other common risk factors. Analyses of these funds’ performance are usually simplistic, failing to differentiate between the two groups.
Enhanced indexing and smart beta strategies are usually more active than the underlying indices. This can cause their risk to vary dramatically over time. For instance, a fund’s market beta can vary by 40-50% over a few years. This variation makes it difficult to determine whether a particular strategy is smart or merely risky. When a market correction arrives, risky funds suffer outsized losses.
Many estimate the beta of a fund by fitting its returns to the market or a benchmark using a regression, a technique known as returns-based style analysis. This is a flawed approach, which fails to accurately estimate the risk of active strategies. We discussed the flaws of returns-based style analysis in earlier articles.
A robust approach to estimating a fund’s historical risk and risk-adjusted performance is to evaluate its holdings over time. At each period, the risk of individual holdings is aggregated to estimate the risk of the fund. This is AlphaBetaWorks’ approach, implemented in our Performance Analytics Platform. Our analysis reveals that many “smart beta” funds are merely high-beta. These funds deliver no value over traditional index funds. On the other hand, some smart beta strategies are indeed exceptional and worth the fees they charge.
WisdomTree Mid Cap Earnings Fund (EZM) – Historical Risk
On the surface, the returns of the WisdomTree Mid Cap Earnings Fund (EZM) appear strong. The fund has dramatically outperformed its broad benchmark, the Russell Midcap Index (IWR):
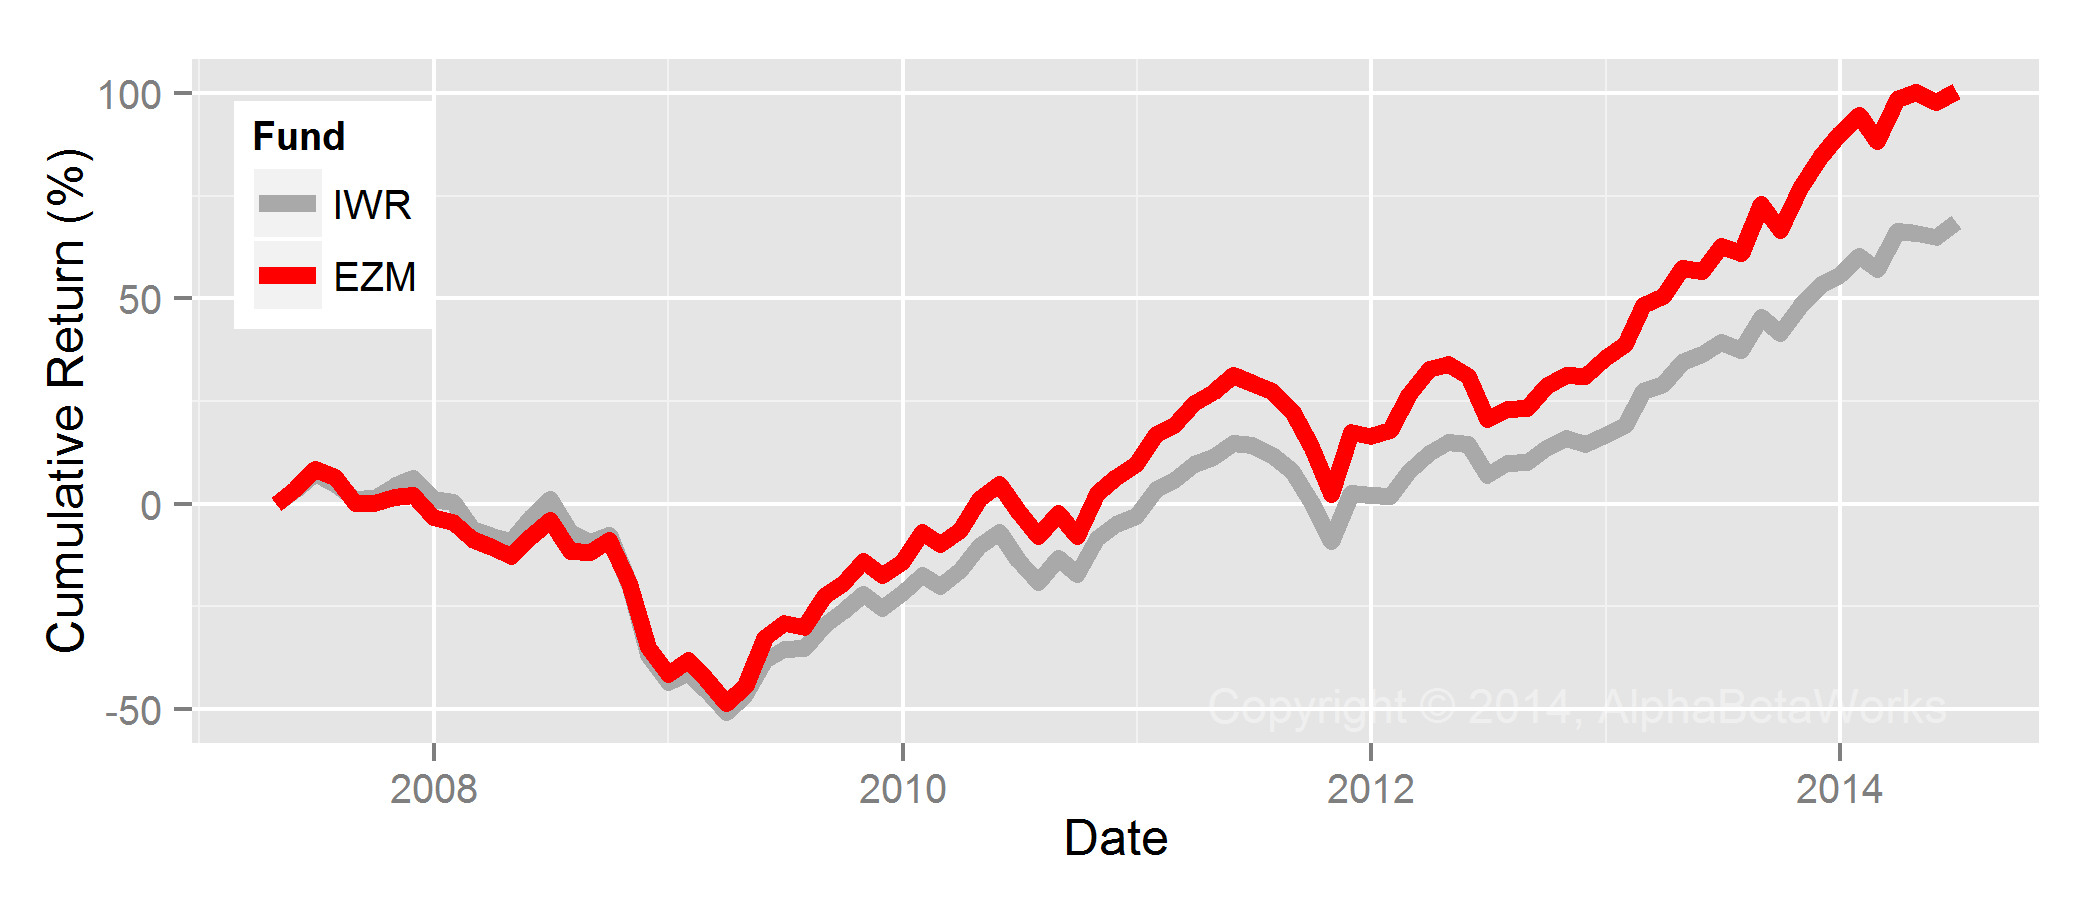
Cumulative Return of WisdomTree Mid Cap Earnings Fund (EZM) vs the Benchmark (IWR)
However, this is nominal outperformance, not risk-adjusted outperformance.
The main source of security risk and return is market risk, or beta. With this in mind, we analyzed the holdings of EZM and IWR during each historical period, calculated their holdings’ risk, and calculated the total risk of each fund. Not surprisingly, IWR’s beta has been stable, averaging 1.09 (109% of the risk of U.S. Market). Meanwhile, EZM’s beta has varied in a wide range, averaging 1.18 (118% of the risk of U.S. Market):
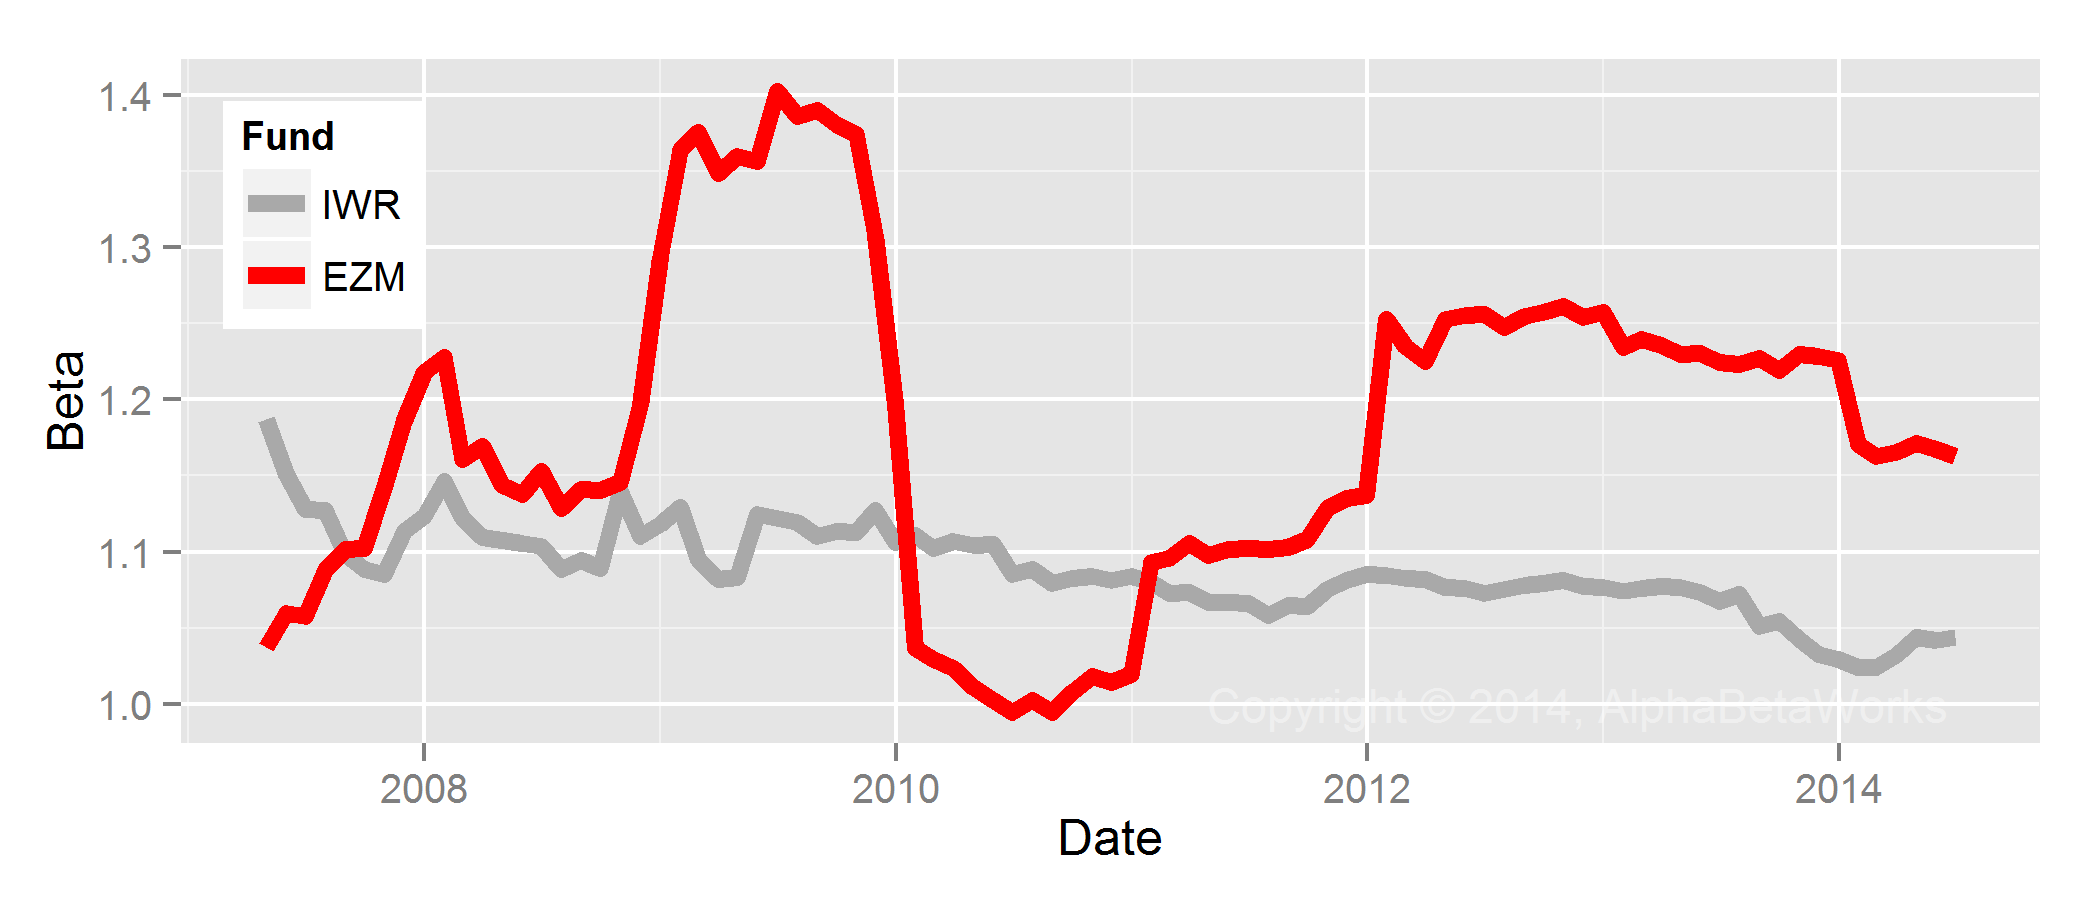
Historical Beta of WisdomTree Mid Cap Earnings Fund (EZM) vs the Benchmark (IWR)
EZM had higher returns, but it also consistently took more market risk. With greater risk comes greater volatility, and a down cycle will affect EZM more.
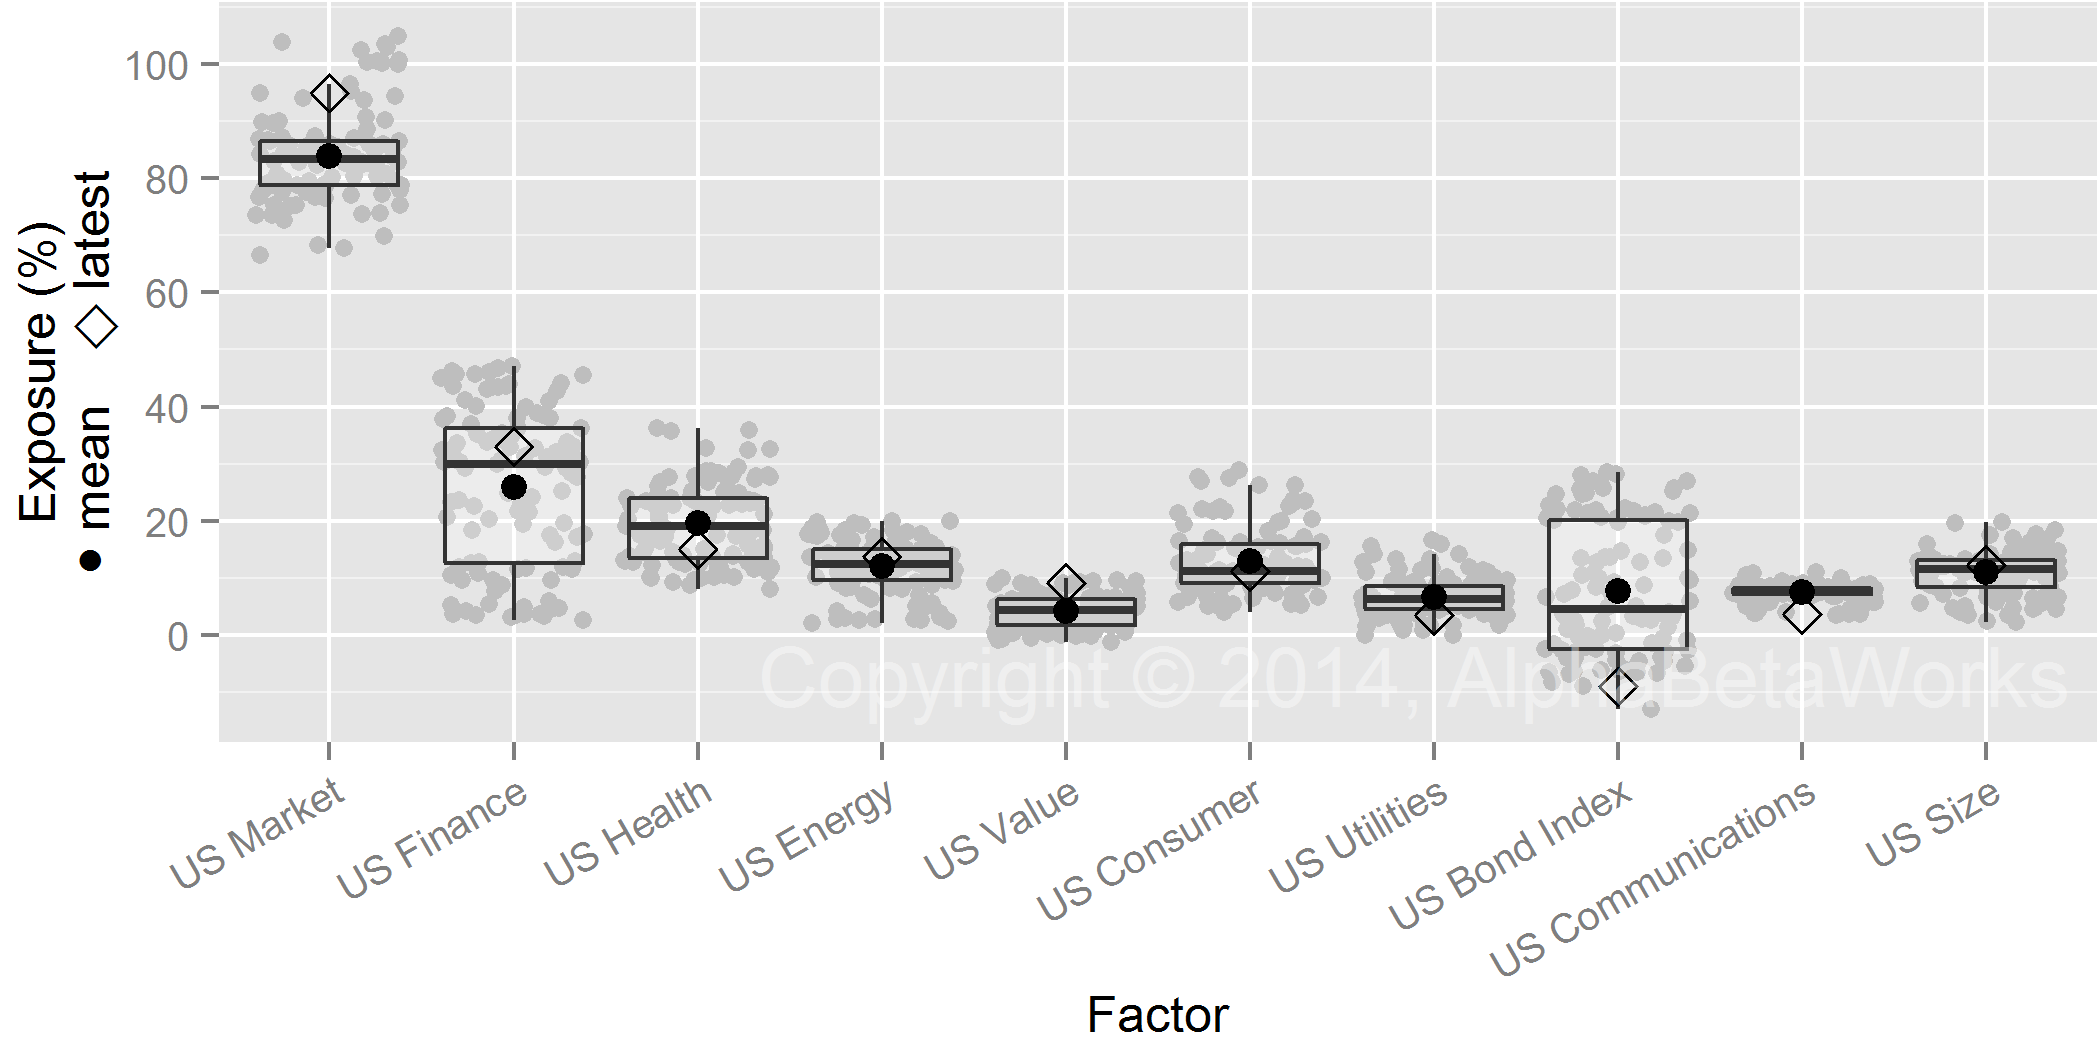
To determine its risk-adjusted return, we must compare the performance of EZM to the performance of a passive portfolio with the same factor exposures. Below are EZM’s current and historical factor exposures:
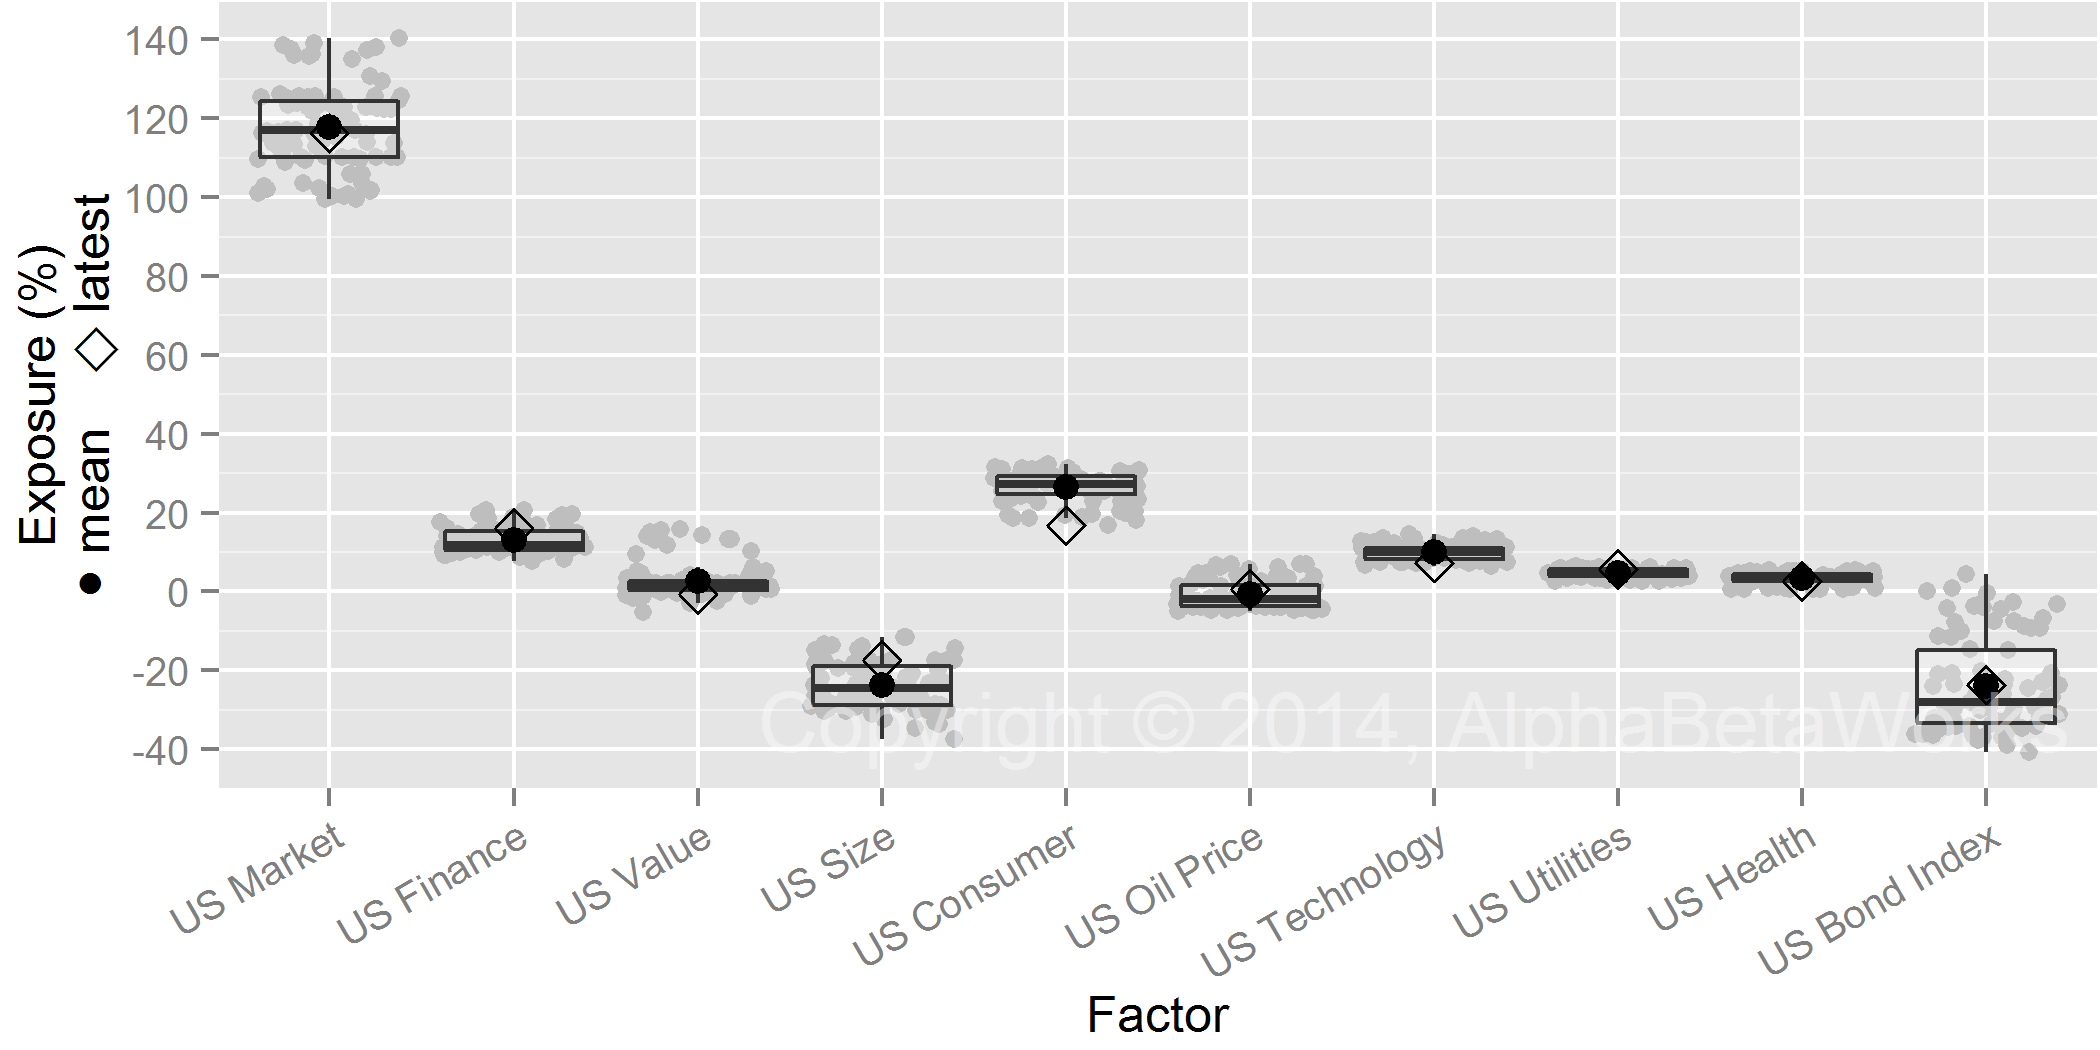
Historical Factor Exposures of WisdomTree Mid Cap Earnings Fund (EZM)
WisdomTree Mid Cap Earnings Fund (EZM) – Risk-Adjusted Performance
Instead of owning EZM, investors could have owned a passive portfolio with similar risk (a passive replicating portfolio). If EZM had profitably timed the market (varied its risk) or selected securities, it should have outperformed.
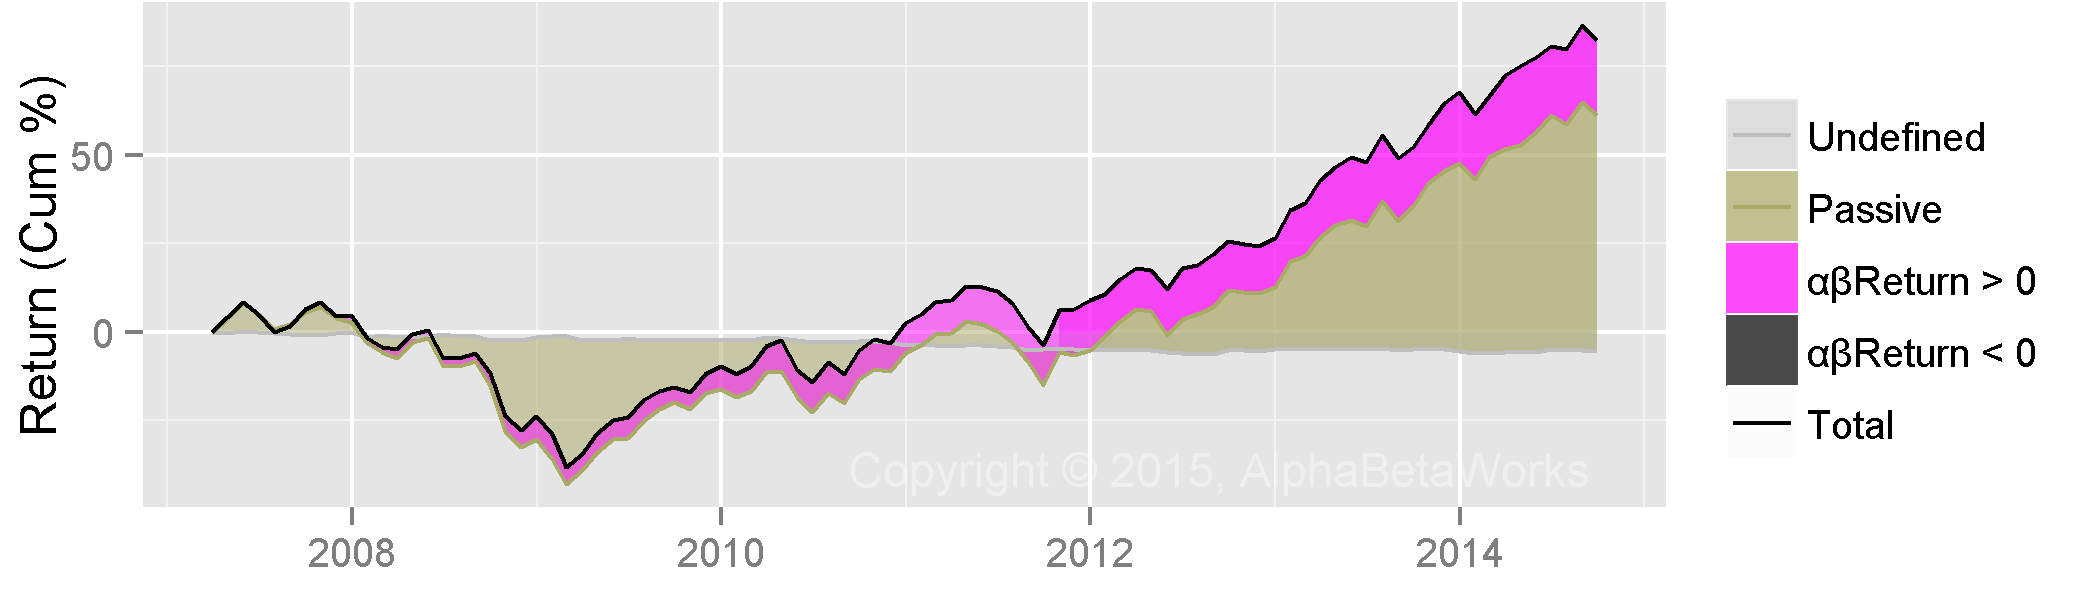
EZM’s risk-adjusted performance closely matches a passive replicating portfolio. Relative to its passive equivalent, EZM has generated negligible active return (abReturn in the following chart):
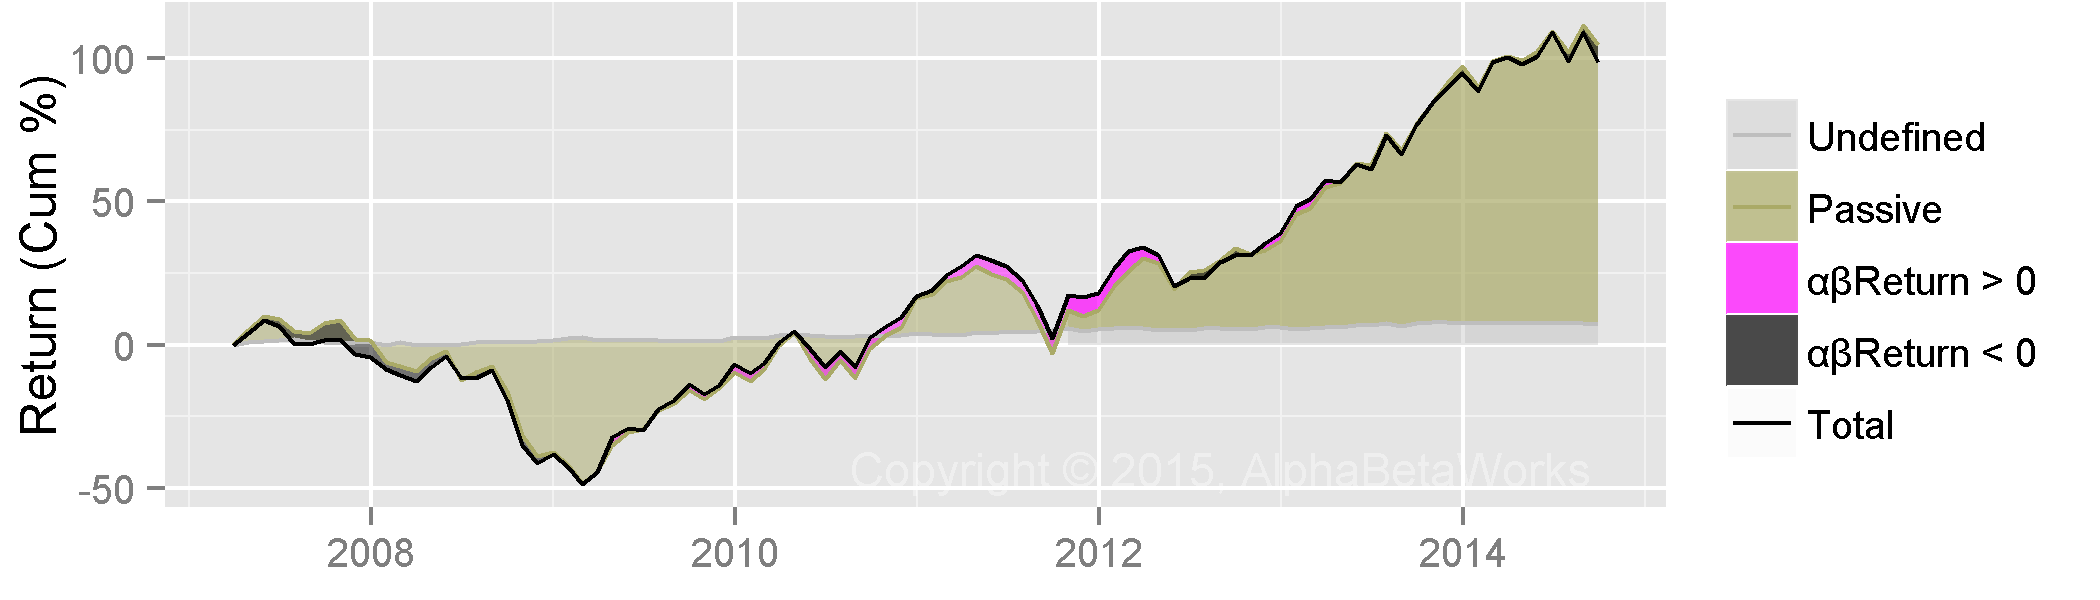
Historical Passive and Active Return of WisdomTree Mid Cap Earnings Fund (EZM)
PowerShares Dynamic Large Cap Value Portfolio (PWV) – Risk-Adjusted Performance
Let’s contrast the performance of EZM with the results of another smart beta option: PowerShares Dynamic Large Cap Value Portfolio (PWV).
PWV has also varied U.S. Market exposure by approximately 40%:
Historical Factor Exposures of PowerShares Dynamic Large Cap Value Portfolio (PWV)
PWV has consistently outperformed its passive replicating portfolio and produced strong active returns due to market timing and security selection:
Historical Passive and Active Return of PowerShares Dynamic Large Cap Value Portfolio (PWV)
Conclusion
Performance evaluation tools lacking accurate insights into risk may rank the better-performing but riskier EZM ahead of PWV, which produced superior active returns. The accurate picture of their relative active performance emerges once both funds’ historical holdings are examined with a multi-factor risk model and their excess returns distilled.
Unsuspecting investors relying on simplistic analysis may conclude that a risky and mediocre fund is excellent while a conservative and exceptional fund is mediocre. At best, they will face higher-than-anticipated risks. At worst, they will get a nasty surprise when a correction comes.


