Tag Archives: statistics

Sectors Most Exposed to USD FX

Currencies are major drivers of other assets. In periods of Foreign Exchange (FX) volatility, there is much discussion of its impact on specific equity sectors. Regrettably, market noise obscures true industry-specific performance, so FX impact is impossible to judge from simple index returns. But, by stripping away market effects, we observe relationships between pure sector returns and exchange rates:

  • Oil Drillers have the largest negative correlation with USD and one of the largest negative exposures.
  • Retailers have the highest positive correlation and one of the highest positive exposures.

Below we identify sectors most exposed to USD FX volatility and quantify these relationships.

Pure Sector Performance

As we illustrated earlier, market noise obscures relationships among individual sectors; it also conceals industry-specific performance. Without separating pure industry-specific returns from the market, robust risk management, performance attribution, and investment skill evaluation are impossible. When stripped of market effects, pure sector factors capture sector-specific trends and risks, including sector-specific USD exposures.

Equity Market’s USD FX Exposure

In addition to industry-specific foreign currency exposures, the equity market is significantly correlated with the currency market. Broad macroeconomic risks affect both exchange rates and the equity market. Below we plot U.S. Market returns against USD returns:

Chart of the correlation between USD FX and U.S. Equity Market

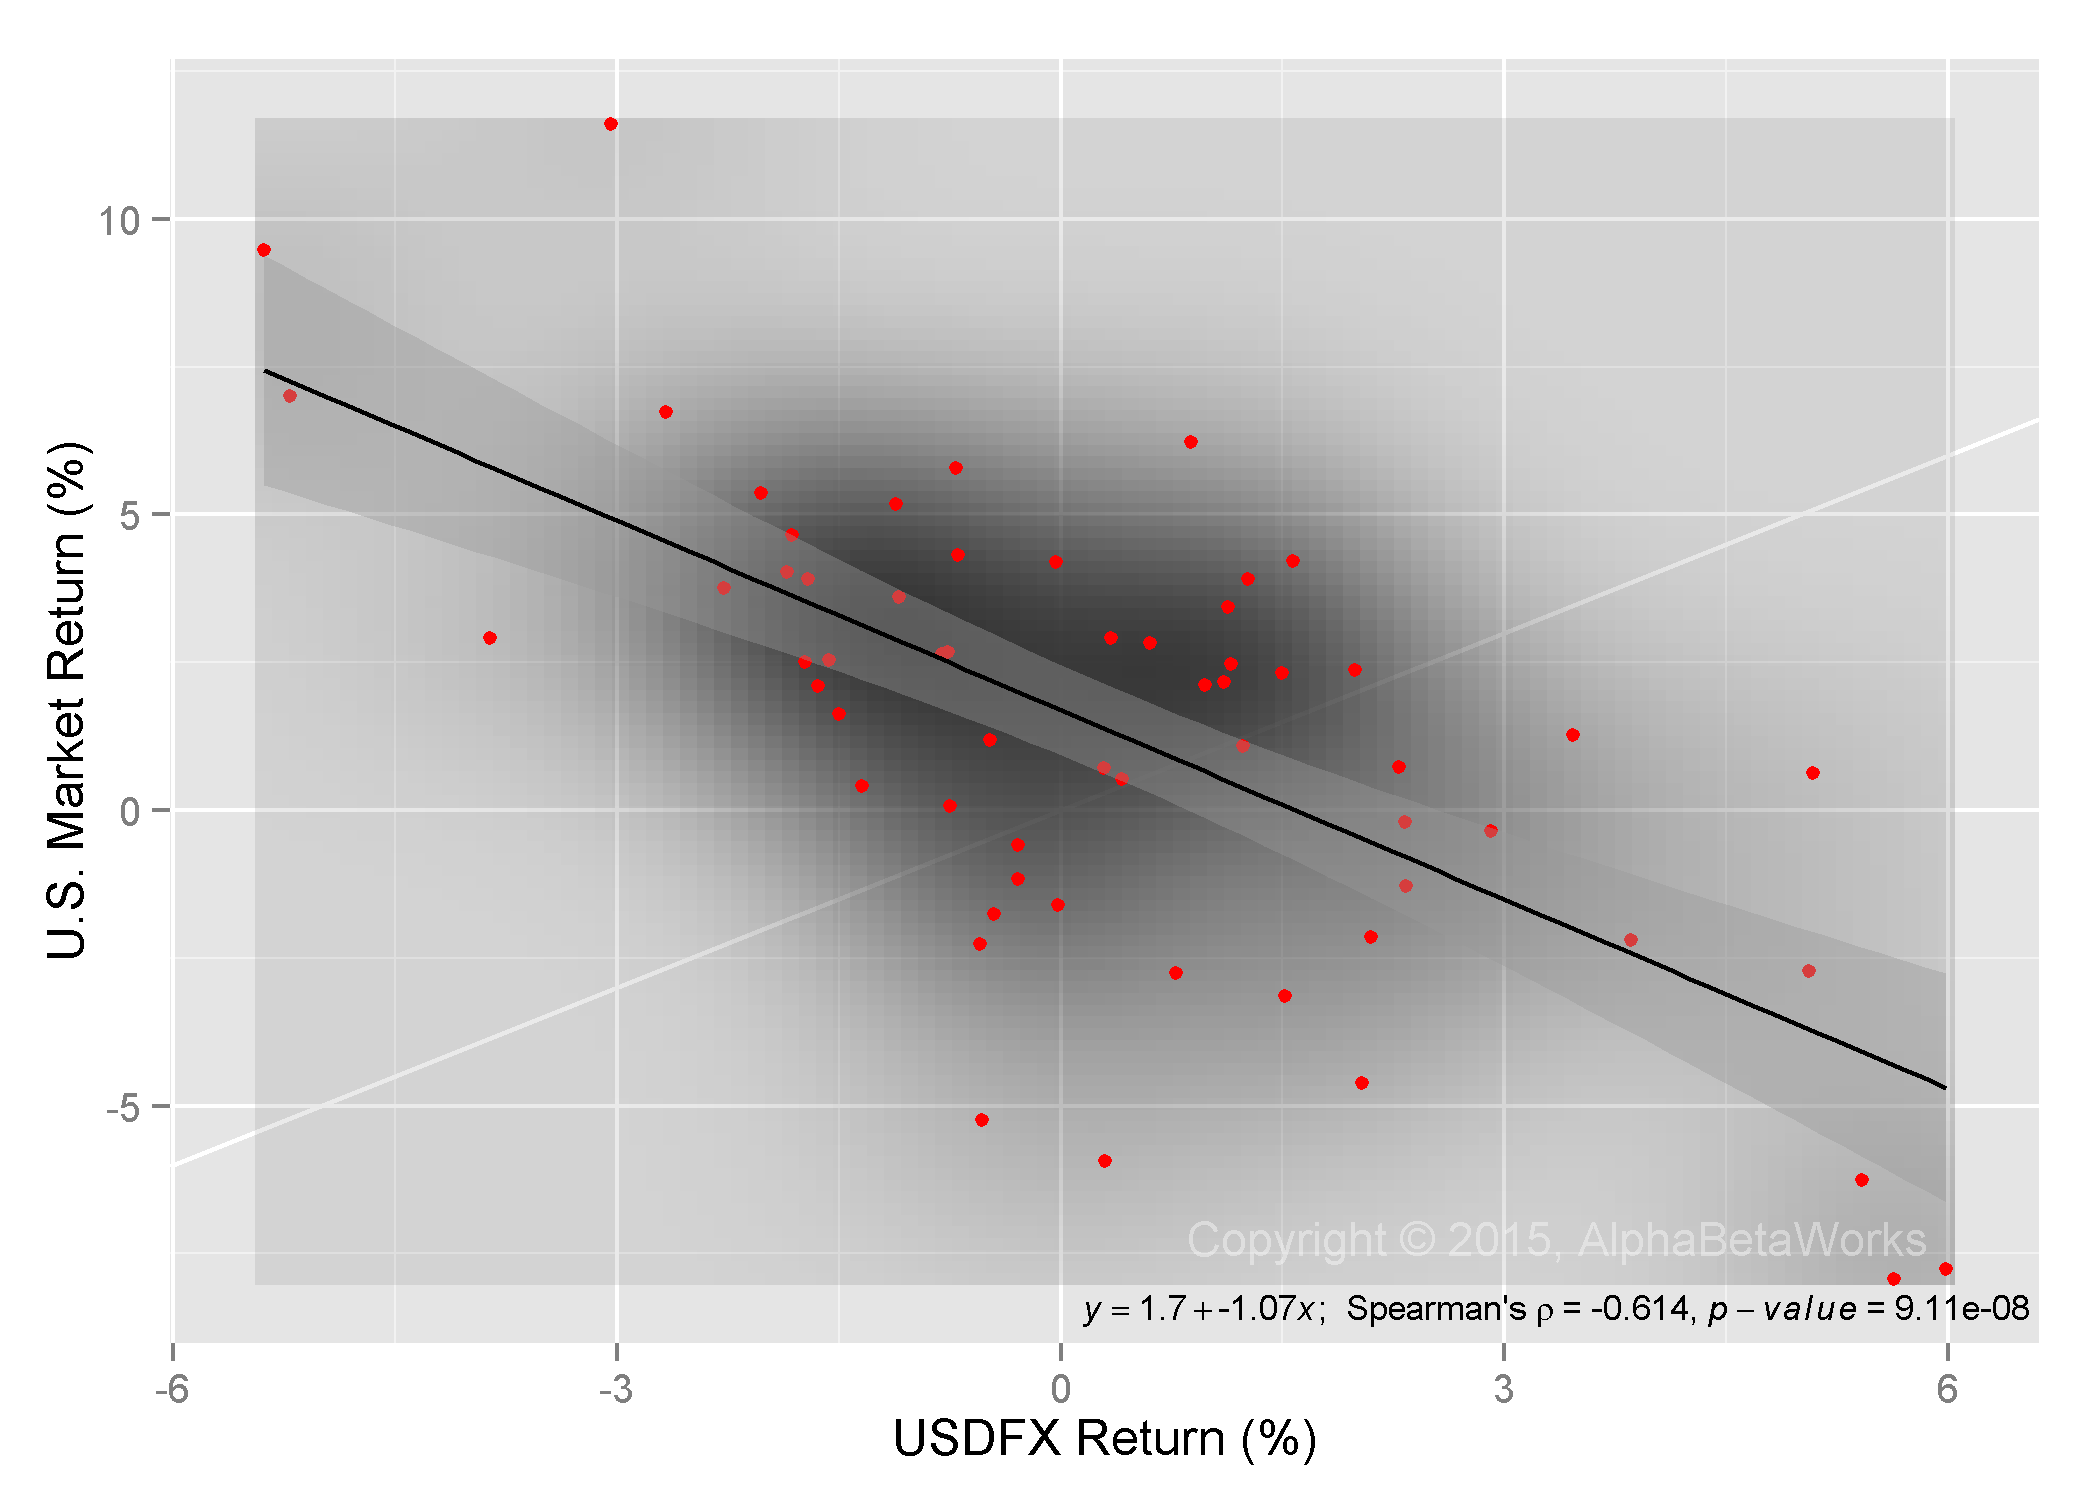
USD FX and U.S. Market Return Correlation

The beta of the U.S. Equity Market to USD FX is approximately -1.1: Over the past five years, when USD appreciated by 1% relative to a basket of foreign currencies, the U.S. Equity Market decreased by approximately 1.1%. USD FX variance explains approximately 38% of U.S. market variance. Perhaps more accurately, 38% of U.S. market variance is due to shared macroeconomic variables that drive both equities and currencies.

The exposure of an individual stock to USD FX is a combination of market, sector, and idiosyncratic effects.

Sectors Most Negatively Exposed to USD FX

Sectors with the highest negative correlation to USD are not surprising:

Chart of the correlation between pure sector factors and USD FX for the sectors most negatively correlated with USD FX

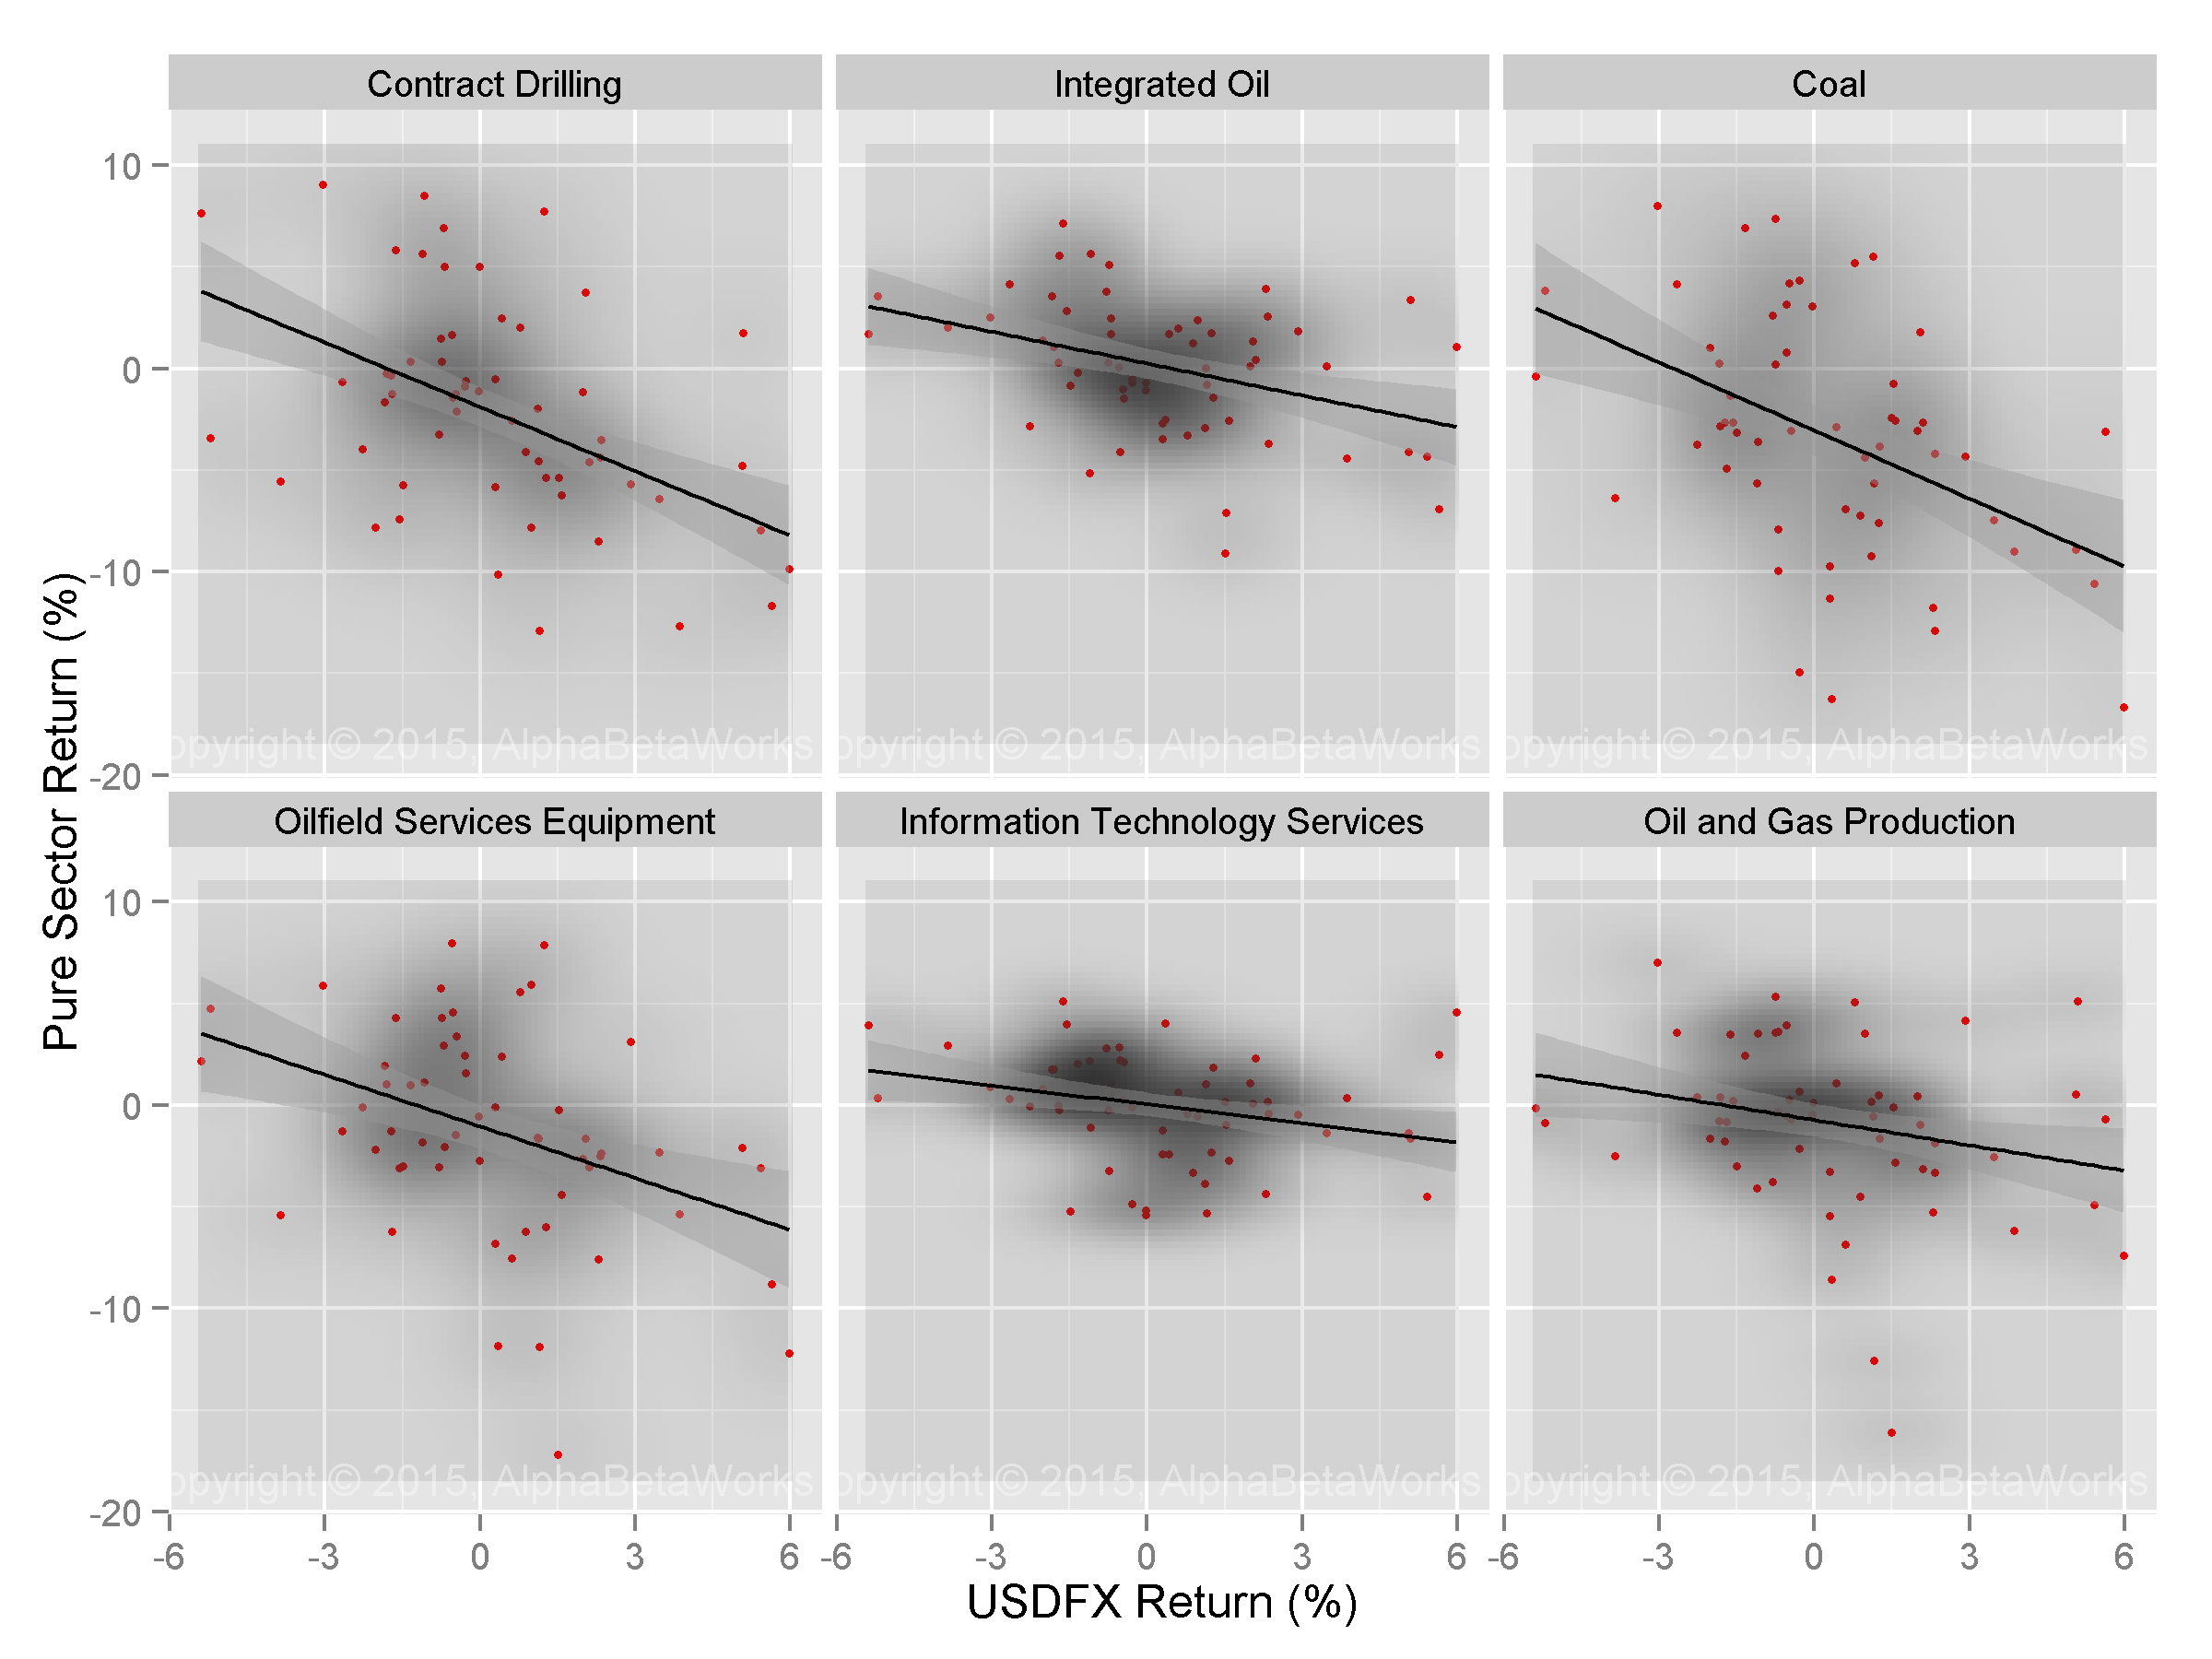
Pure Sector Factors Most Negatively Correlated with USD FX

Sector USD FX Correlation USD FX Correlation
p-value
USD FX Beta USD FX Beta
p-value
Contract Drilling -0.45 0.0002 -1.01 0.0006
Integrated Oil -0.39 0.0011 -0.56 0.0011
Coal -0.36 0.0021 -1.10 0.0004
Oilfield Services Equipment -0.34 0.0042 -0.69 0.0059
Information Technology Services -0.30 0.0109 -0.27 0.0373
Oil and Gas Production -0.27 0.0174 -0.44 0.0131

(Note that we use the Spearman’s rank correlation coefficient to evaluate correlations. Spearman’s correlation is robust against outliers, unlike the commonly used Pearson’s correlation. All correlations are significant; most at a 1% level or better.)

Oil Price USD FX Exposure

Commodity industries’ (oil, coal, etc) exposure to USD FX is due to their macroeconomic sensitivity, inflation sensitivity, and the global nature of the commodity markets. When USD strengthens, USD-denominated commodity prices have to decline in order for broad currency-weighted prices to remain unchanged. Consequently, commodity prices tend to be strongly negatively correlated with USD FX:

Chart of the correlation between historical USD FX returns and Oil Price returns

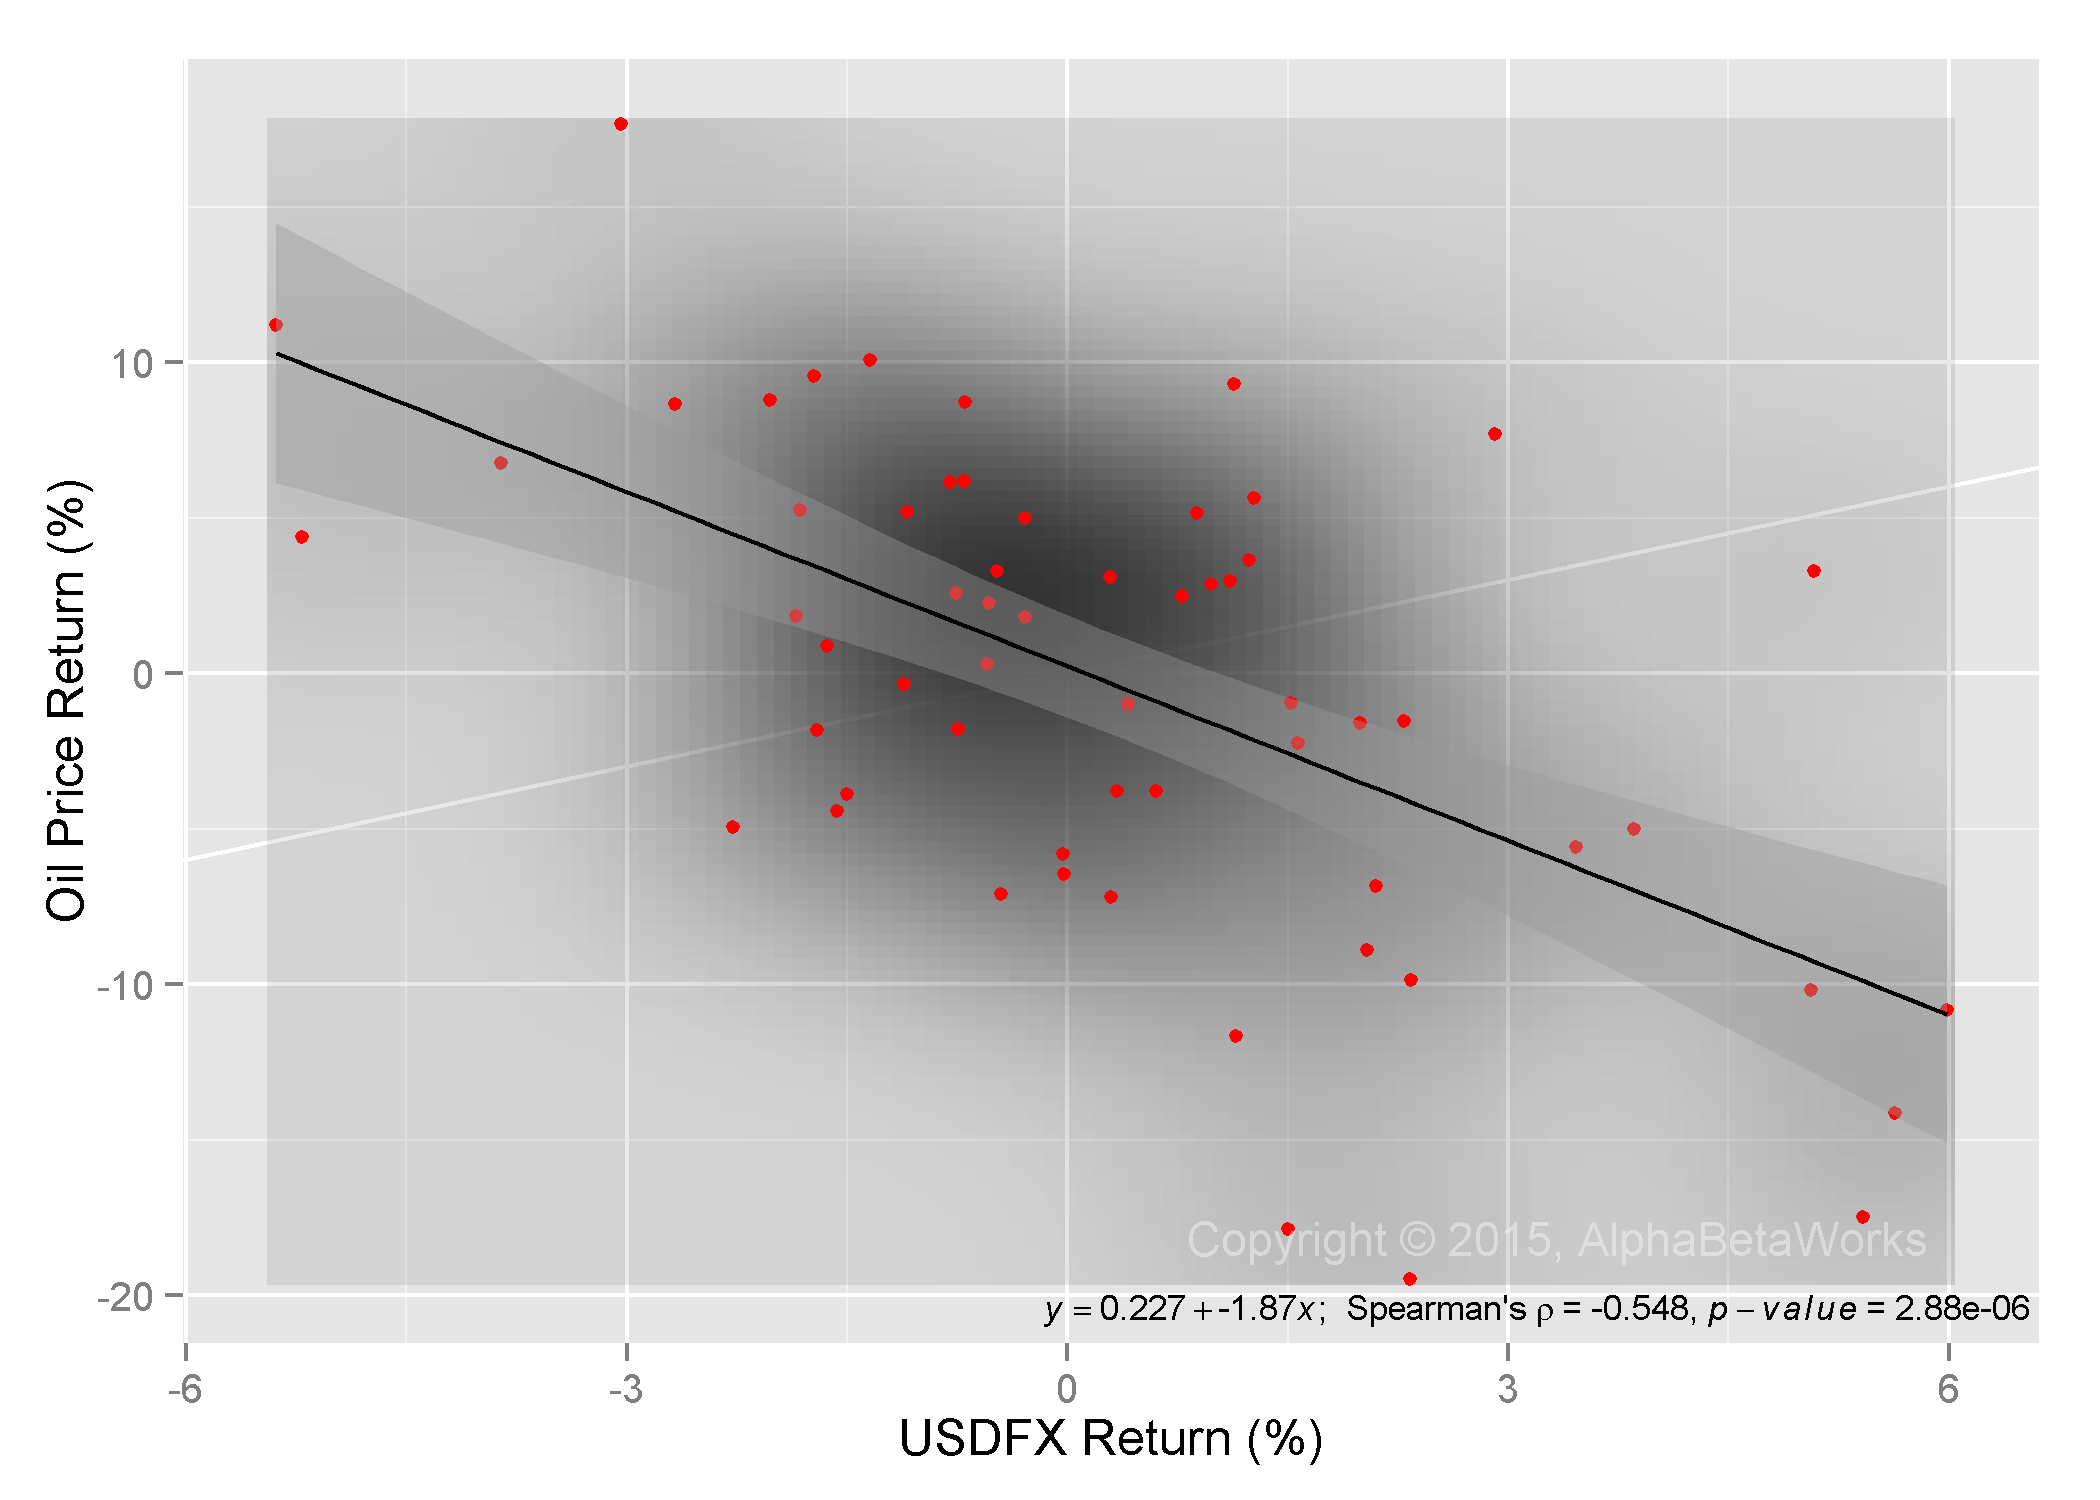
USD FX and Oil Price Return Correlation

The Oil Price’s beta to USD FX is -1.9: Over the past five years, when USD appreciated by 1% relative to a basket of foreign currencies, the Oil Price decreased by approximately 1.9%. 30% of Oil Price variance is explained by the shared macroeconomic variables that drive both commodity and currency markets.

Information Technology Sector USD FX Exposure

Information Technology Services is a typical export industry that suffers margin compression when USD-denominated costs increase relative to foreign-currency-denominated revenues. However, our analysis indicates this exposure is barely statistically significant with the beta’s p-value of 0.04. This exposure is also low: a 1% increase in USD FX is associated with approximately 0.3% decrease in the value of the sector.

Sectors Most Positively Exposed to USD FX

The list of sectors with the highest positive correlation to USD FX is less intuitive:

Chart of the correlation between USD FX returns and the returns of pure sectors factors most positively correlated with it

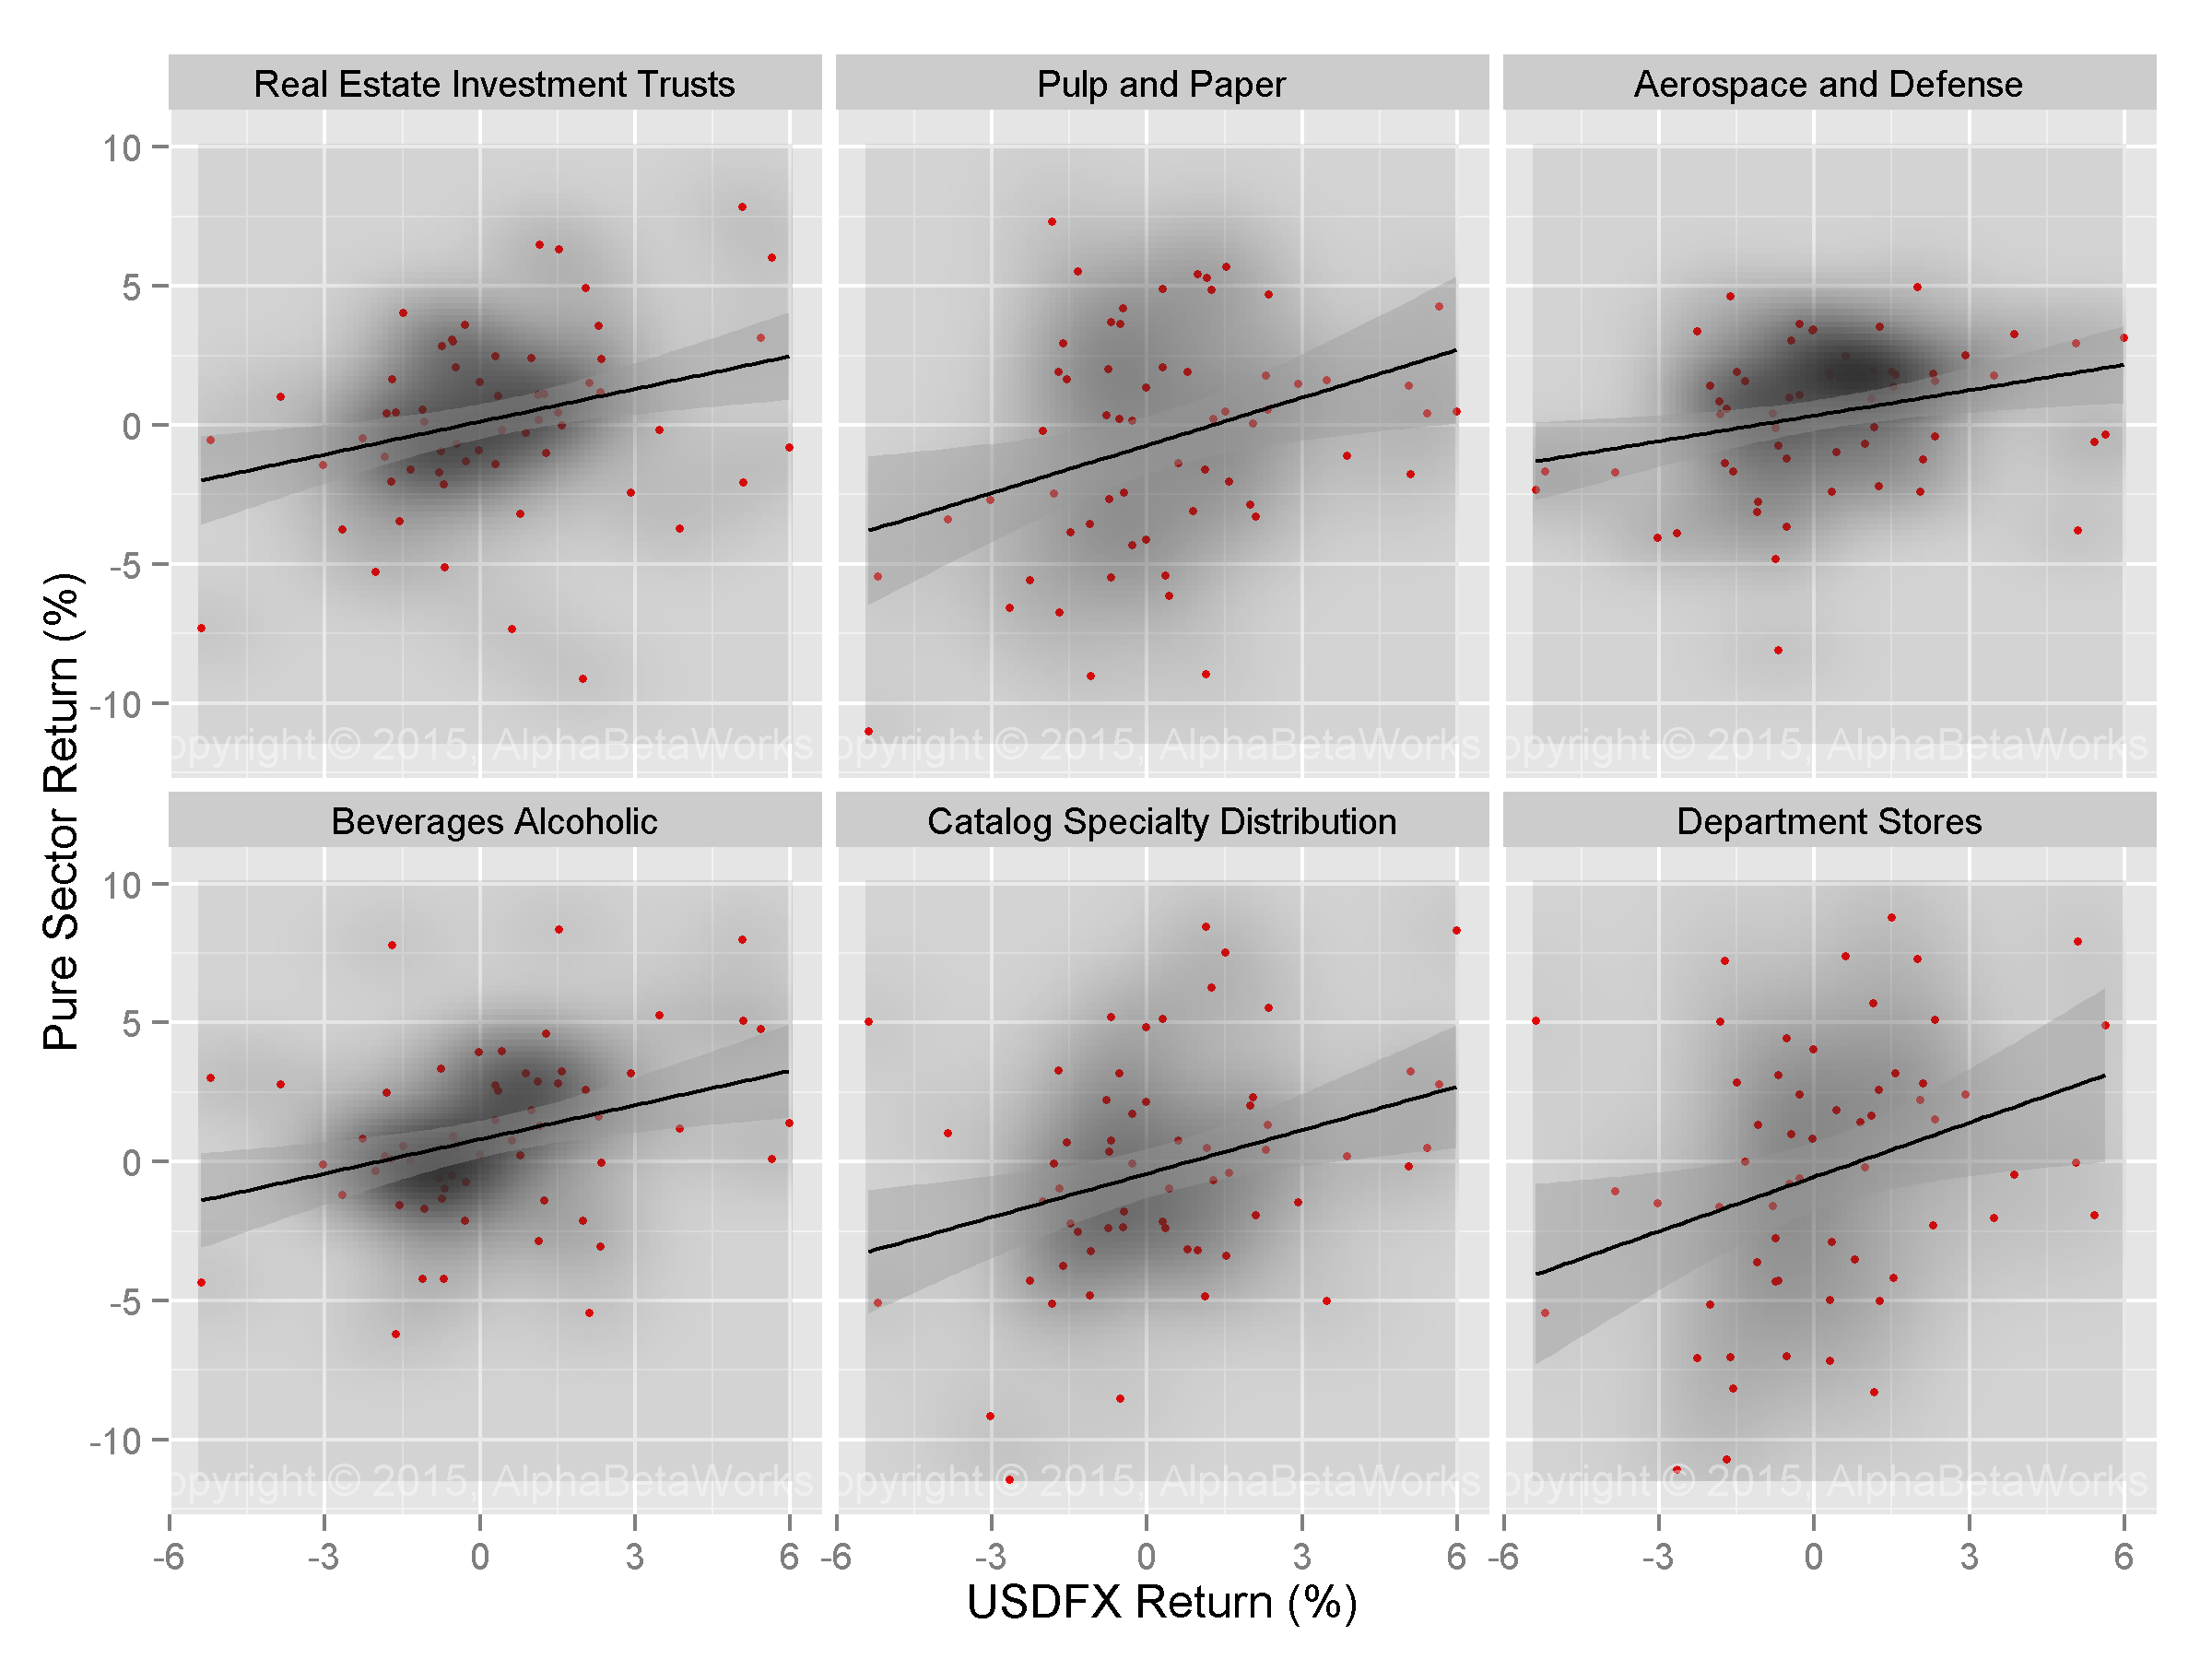
Pure Sector Factors Most Positively Correlated with USD FX

Sector USD FX Correlation USD FX Correlation
p-value
USD FX Beta USD FX Beta
p-value
Real Estate Investment Trusts 0.29 0.0121 0.39 0.0101
Pulp and Paper 0.30 0.0102 0.52 0.0123
Aerospace and Defense 0.31 0.0084 0.32 0.0206
Beverages Alcoholic 0.33 0.0049 0.43 0.0025
Catalog Specialty Distribution 0.33 0.0045 0.41 0.0349
Department Stores 0.37 0.0020 0.70 0.0085

The list is dominated by import-sensitive sectors that benefit from a boost in U.S. consumer purchasing power from an appreciating USD.  Also, when the USD appreciates, the associated drop in import prices boosts aerospace and defense companies, likely due to depreciating foreign inputs.

The presence of REITs on the list appears unexpected. Yet, it is due to the same shared variables as the negative correlation between REITs and oil prices: inflation, growth rates, and macroeconomic uncertainty.

Conclusion

  • Industry-specific performance is clouded by market noise.
  • By stripping away the effects of market and macroeconomic variables, we reveal the performance of Pure Sector Factors and their relationships with USD FX.
  • Commodity producers and information technology exporters most consistently suffer from appreciating USD.
  • Importers and retailers most consistently benefit from appreciating USD.
The information herein is not represented or warranted to be accurate, correct, complete or timely.
Past performance is no guarantee of future results.
Copyright © 2012-2015, 
AlphaBetaWorks, a division of Alpha Beta Analytics, LLC. All rights reserved.
Content may not be republished without express written consent.

Returns-Based Style Analysis – Overfitting and Collinearity

Plagued by overfitting and collinearity, returns-based style analysis frequently fails, confusing noise with portfolio risk.

Returns-based style analysis (RBSA) is a common approach to investment risk analysis, performance attribution, and skill evaluation. Returns-based techniques perform regressions of returns over one or more historical periods to compute portfolio betas (exposures to systematic risk factors) and alphas (residual returns unexplained by systematic risk factors). The simplicity of the returns-based approach has made it popular, but it comes at a cost – RBSA fails for active portfolios. In addition, this approach is plagued by the statistical problems of overfitting and collinearity, frequently confusing noise with systematic portfolio risk. 

Returns-Based Style Analysis – Failures for Active Portfolios

In an earlier article we illustrated the flaws of returns-based style analysis when factor exposures vary, as is common for active funds:

  • Returns-based analysis typically yields flawed estimates of portfolio risk.
  • Returns-based analysis may not even accurately estimate average portfolio risk.
  • Errors will be most pronounced for the most active funds:
    • Skilled funds may be deemed unskilled.
    • Unskilled funds may be deemed skilled.

These are not the only flaws. We now turn to the subtler and equally critical issues – failures in the underlying regression analysis itself. We use a recent Morningstar article as an example.

iShares Core High Dividend ETF (HDV) – Returns-Based Style Analysis

A recent Seeking Alpha article provides an excellent illustration of problems created by overfitting and collinearity. In this article, Morningstar performed a returns-based style analysis of iShares Core High Dividend ETF (HDV).

Morningstar estimated the following factor exposures for HDV using the Carhart model:

Morningstar: Returns-Based Analysis of the iShares Core High Dividend ETF (HDV) Using the Carhart Model

iShares Core High Dividend ETF (HDV) – Estimated Factor Exposures Using the Carhart Model – Source: Morningstar

The Mkt-RF coefficient, or loading, is HDV’s estimated market beta. A beta value of 0.67 means that given a +1% change in the market HDV is expected to move by +0.67%, everything else held constant.

The article then performs RBSA using an enhanced Carhart + Quality Minus Junk (QMJ) model:

Morningstar: Returns-Based Analysis of iShares Core High Dividend ETF (HDV) Using the Carhart + Quality Minus Junk (QMJ) Model

iShares Core High Dividend ETF (HDV) – Estimated Factor Exposures Using the Carhart + Quality Minus Junk (QMJ) Model – Source: Morningstar

With the addition of the QMJ factor, the market beta estimate increased by a third from 0.67 to 0.90. Both estimates cannot be right. Perhaps the simplicity of the Carhart model is to blame and the more complex 5-factor RBSA is more accurate?

iShares Core High Dividend ETF (HDV) – Historical Factor Exposures

Instead of Morningstar’s RBSA approach, we analyzed HDV’s historical holdings using the AlphaBetaWorks’ U.S. Equity Risk Model. For each month, we estimated the U.S. Market exposures (betas) of individual positions and aggregated these into monthly estimates of portfolio beta:

Chart of the historical market exposure (beta) of iShares Core High Dividend ETF (HDV)

iShares Core High Dividend ETF (HDV) – Historical Market Exposure (Beta)

Over the past 4 years, HDV’s market beta varied in a narrow range between 0.50 and 0.62.

Both of the above returns-based analyses were off, but the simpler Carhart model did best. It turns out the simpler and a less sophisticated returns-based model is less vulnerable to the statistical problems of multicollinearity and overfitting. Notably, the only way to find out that returns-based style analysis failed was to perform the more advanced holdings-based analysis using a multi-factor risk model.

Statistical Problems with Returns-Based Analysis

Multicollinearity

Collinearity (Multicollinearity) occurs when risk factors used in returns-based analysis are highly correlated with each other. For instance, small-cap stocks tend to have higher beta than large-cap stocks, so the performance of small-cap stocks relative to large-cap stocks is correlated to the market.

Erratic changes in the factor exposures for various time periods, or when new risk factors are added, are signs of collinearity. These erratic changes make it difficult to pin down factor exposures and are signs of deeper problems:

A principal danger of such data redundancy is that of overfitting in regression analysis models.
-Wikipedia

Overfitting

Overfitting is a consequence of redundant data or model over-complexity. These are common for returns-based analyses which usually attempt to explain a limited number of return observations with a larger number of correlated variable observations.

An overfitted returns-based model may appear to describe data very well. But the fit is misleading – the exposures may be describing noise and will change dramatically under minor changes to data or factors. A high R squared from returns-based models may be a sign of trouble, rather than a reassurance.

As we have seen with the HDV example above, exposures estimated by RBSA may bear little relationship to portfolio risk. Therefore, all dependent risk and skill data will be flawed.

Conclusions

  • When a manager does not vary exposures to the market, sector, and macroeconomic factors, returns-based style analysis (RBSA) using a parsimonious model can be effective.
  • When a manager varies bets, RBSA typically yields flawed estimates of portfolio risk.
  • Even when exposures do not vary, returns-based style analysis is vulnerable to multicollinearity and overfitting:
    • The model may capture noise, rather than the underlying factor exposures.
    • Factor exposures may vary erratically among estimates.
    • Estimates of portfolio risk will be flawed.
    • Skilled funds may be deemed unskilled.
    • Unskilled funds may be deemed skilled.
  • Holdings-based analysis using a robust multi-factor risk model is superior for quantifying fund risk and performance.
The information herein is not represented or warranted to be accurate, correct, complete or timely.
Past performance is no guarantee of future results.
Copyright © 2012-2015, AlphaBetaWorks, a division of Alpha Beta Analytics, LLC. All rights reserved.
Content may not be republished without express written consent.