Tag Archives: USD FX

Foreign Sectors Exposed to Strong USD

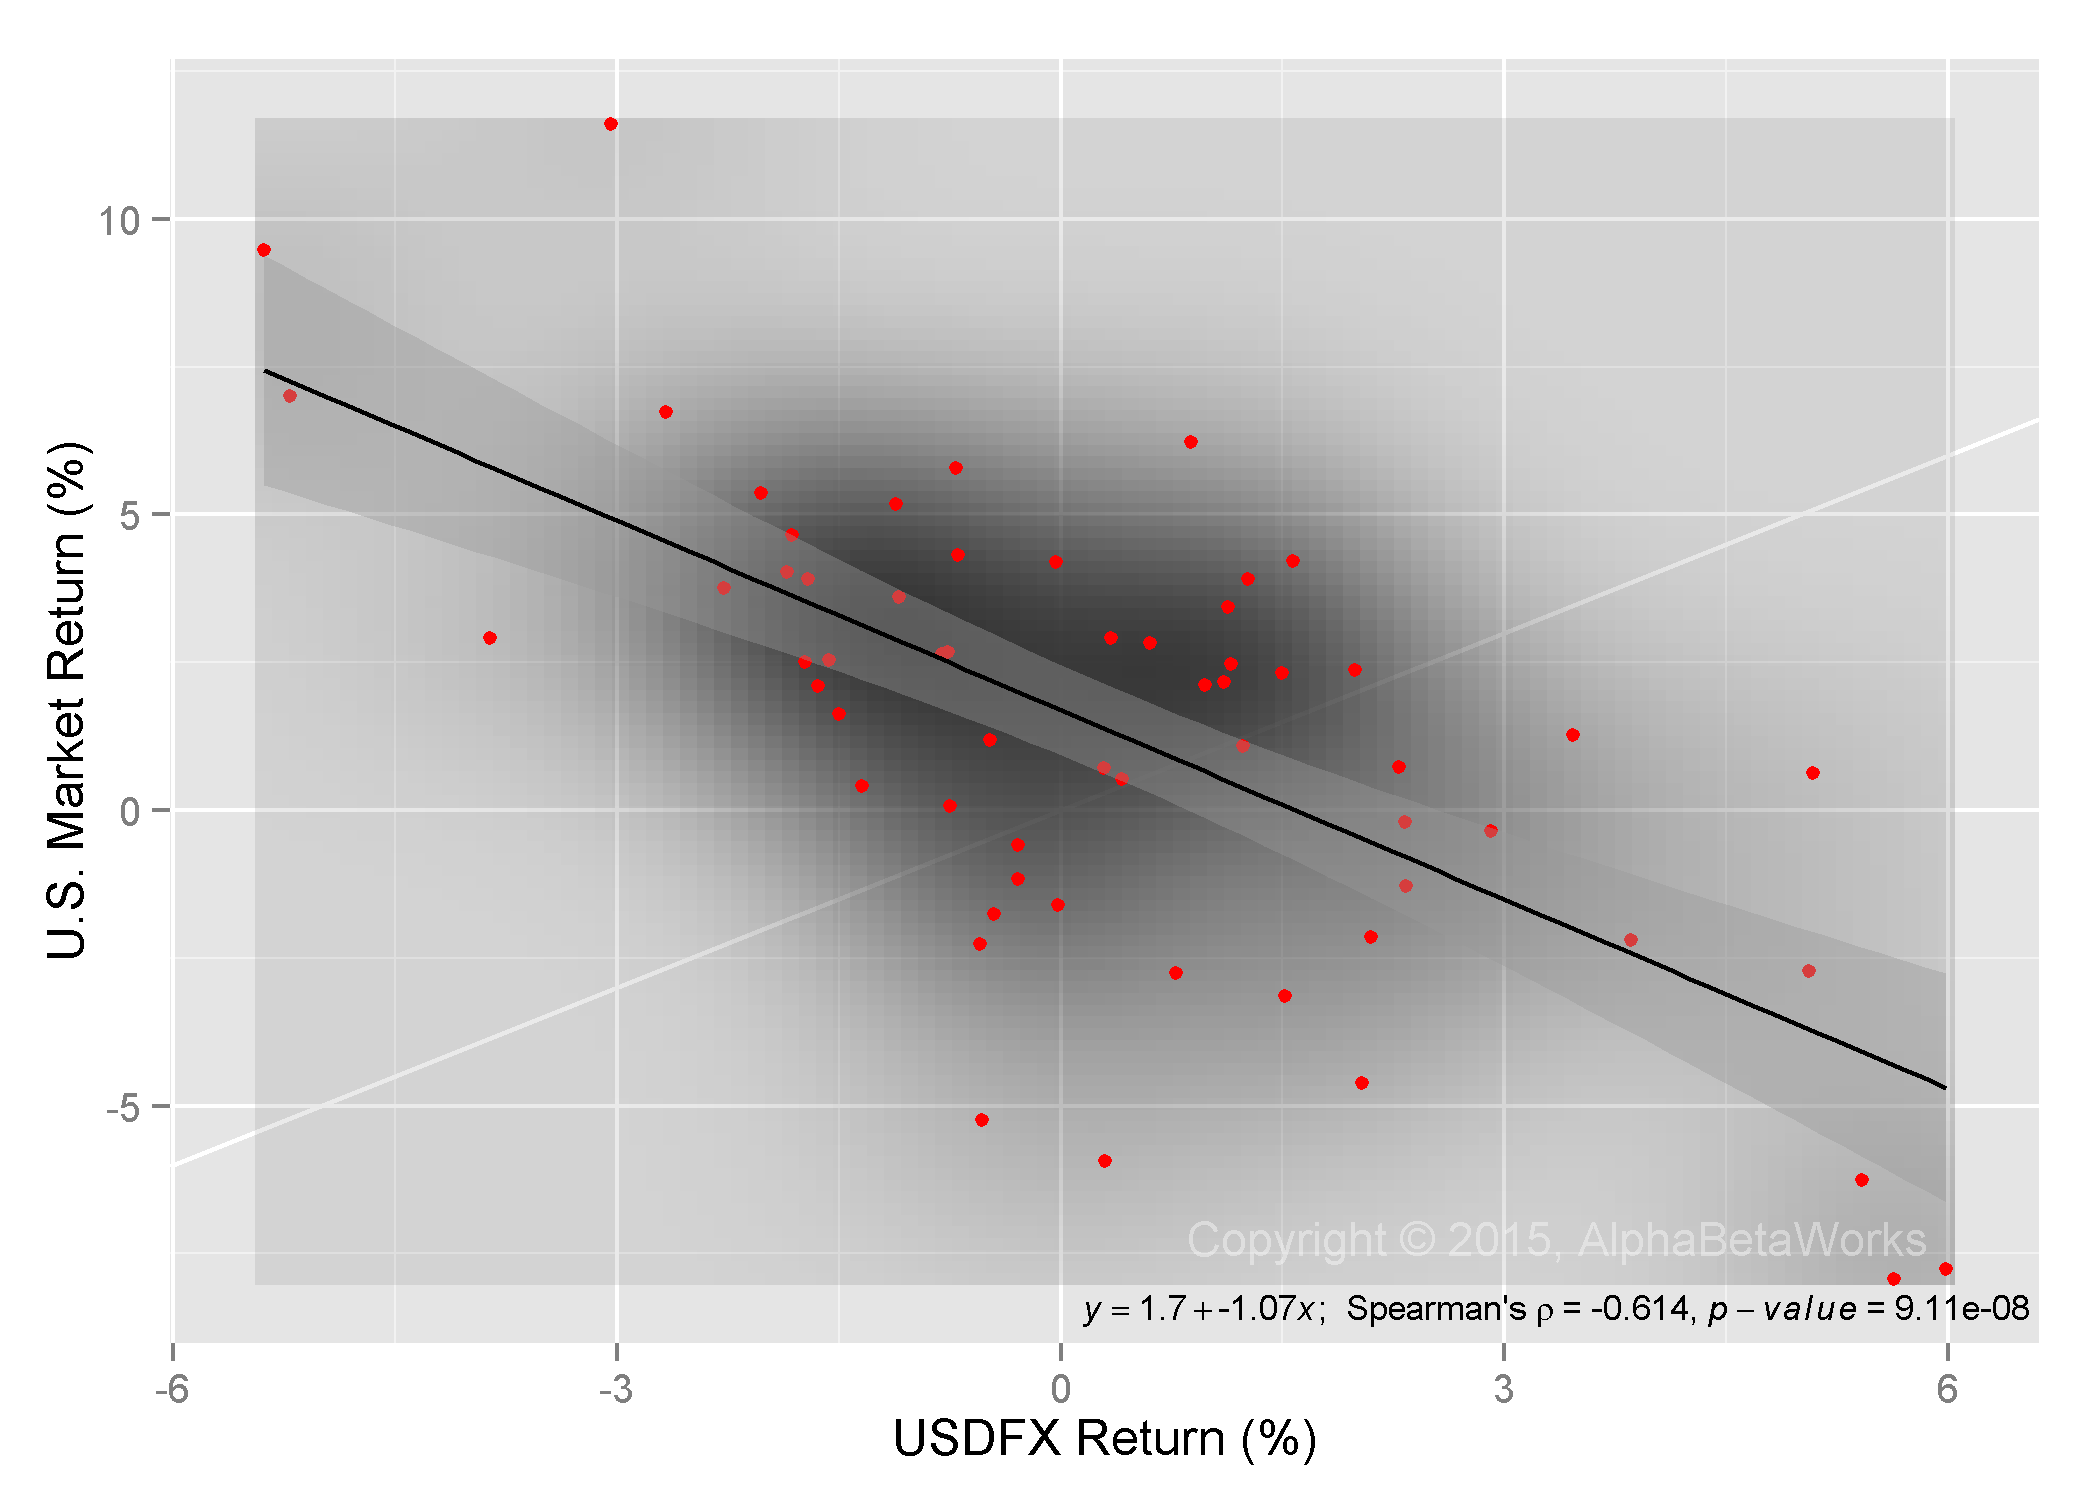
In an earlier article we discussed the U.S. sectors most affected by volatility in the U.S. Dollar. This analysis raised a number of questions from readers and clients:

  • For U.S. exporters hurt by strong USD: Do foreign competitors benefit, exhibiting the opposite (positive) USD exposure?
  • For U.S. retailers and distributors aided by strong USD: Do foreign suppliers benefit, exhibiting similar (positive) USD exposure?

Both intuitions are correct. Foreign transportation and technology companies turn out to be the top beneficiaries of appreciating USD.

U.S. Information Technology Sector USD FX Exposure

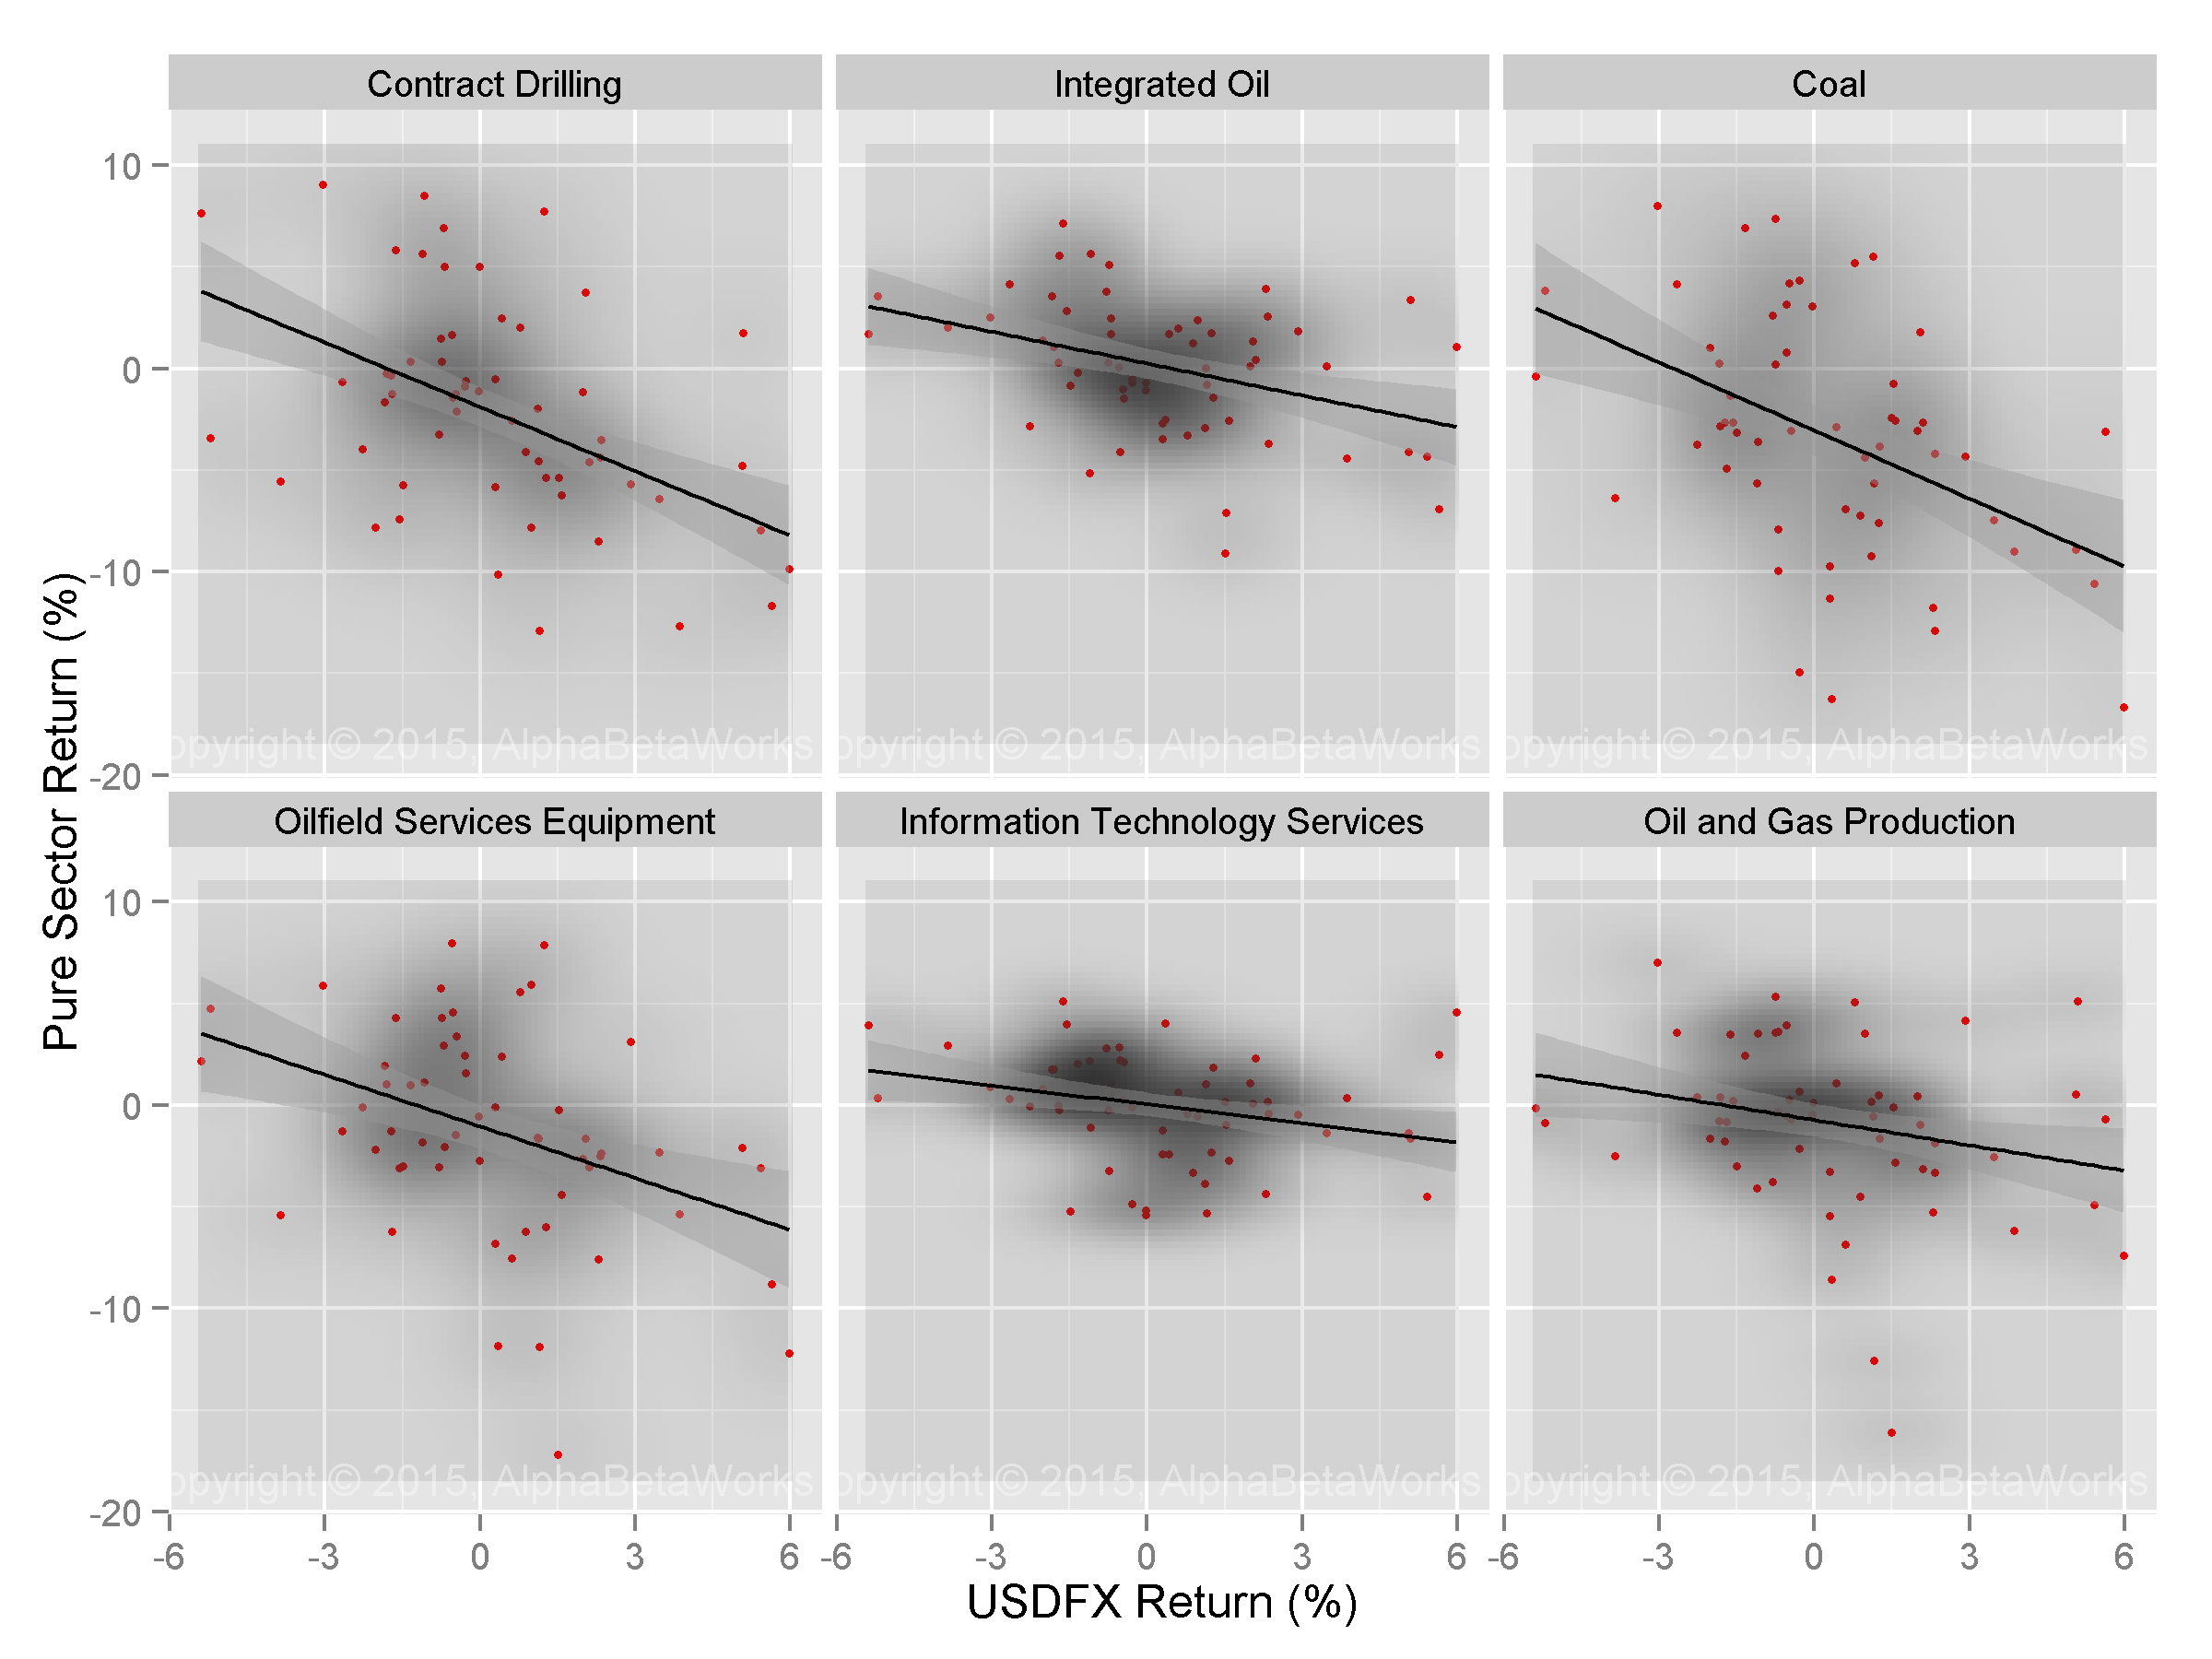
Recall from our earlier piece that U.S. Information Technology is one of the sectors with the highest negative correlation to USD:

Sector

USD FX
Correlation

USD FX
Correlation
p-value
USD FX
Beta

USD FX
Beta
p-value

Contract Drilling

-0.45

0.0002 -1.01

0.0006

Integrated Oil

-0.39

0.0011 -0.56

0.0011

Coal

-0.36

0.0021 -1.10

0.0004

Oilfield Services Equipment

-0.34

0.0042 -0.69

0.0059

Information Technology Services

-0.30

0.0109 -0.27

0.0373

Oil and Gas Production

-0.27

0.0174 -0.44

0.0131

Information Technology Services is an export industry that suffers when USD-denominated costs increase relative to foreign-currency-denominated revenues. USD appreciation squeezes margins and puts the sector at a disadvantage relative to foreign competitors. Consequently, we expect foreign technology companies to benefit from appreciating USD.

U.S. Retail Sector USD FX Exposure

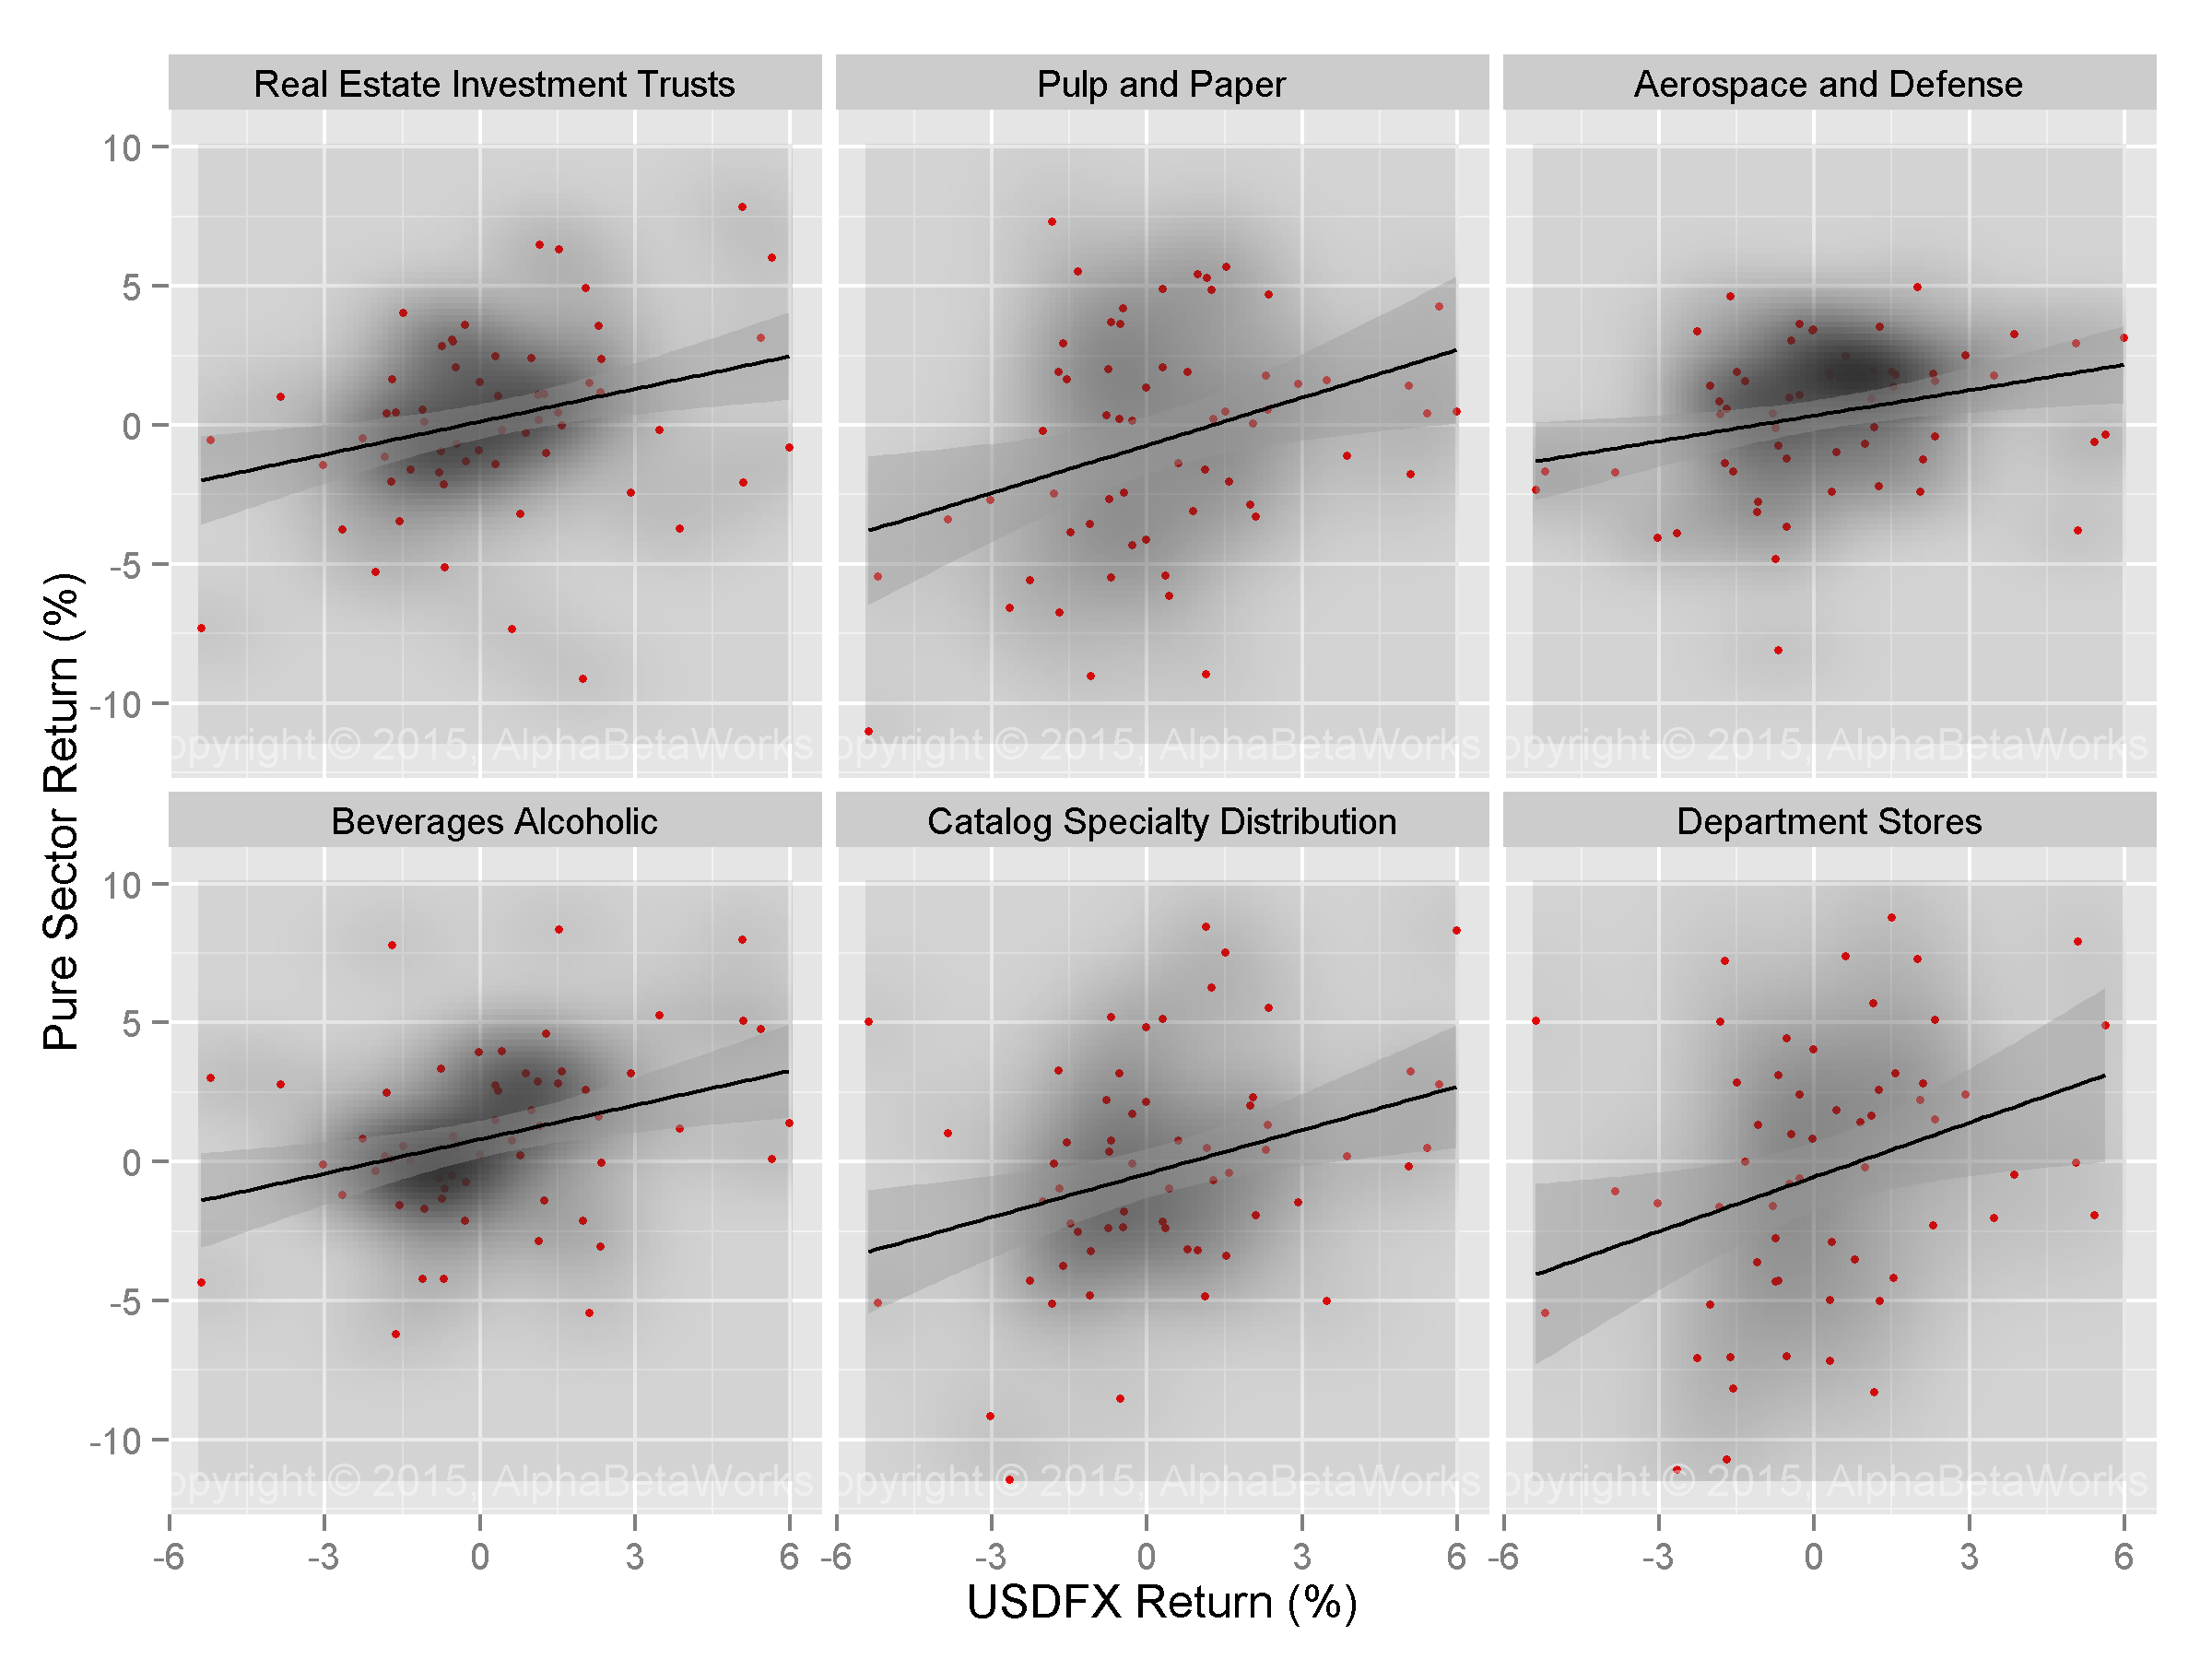
U.S. Retail and Distribution are among the sectors with the highest positive correlation to USD:

Sector

USD FX Correlation

USD FX
Correlation
p-value
USD FX
Beta

USD FX
Beta
p-value

Real Estate Investment Trusts

0.29

0.0121 0.39

0.0101

Pulp and Paper

0.30

0.0102 0.52

0.0123

Aerospace and Defense

0.31

0.0084 0.32

0.0206

Beverages Alcoholic

0.33

0.0049 0.43

0.0025

Catalog Specialty Distribution

0.33

0.0045 0.41

0.0349

Department Stores

0.37

0.0020 0.70

0.0085

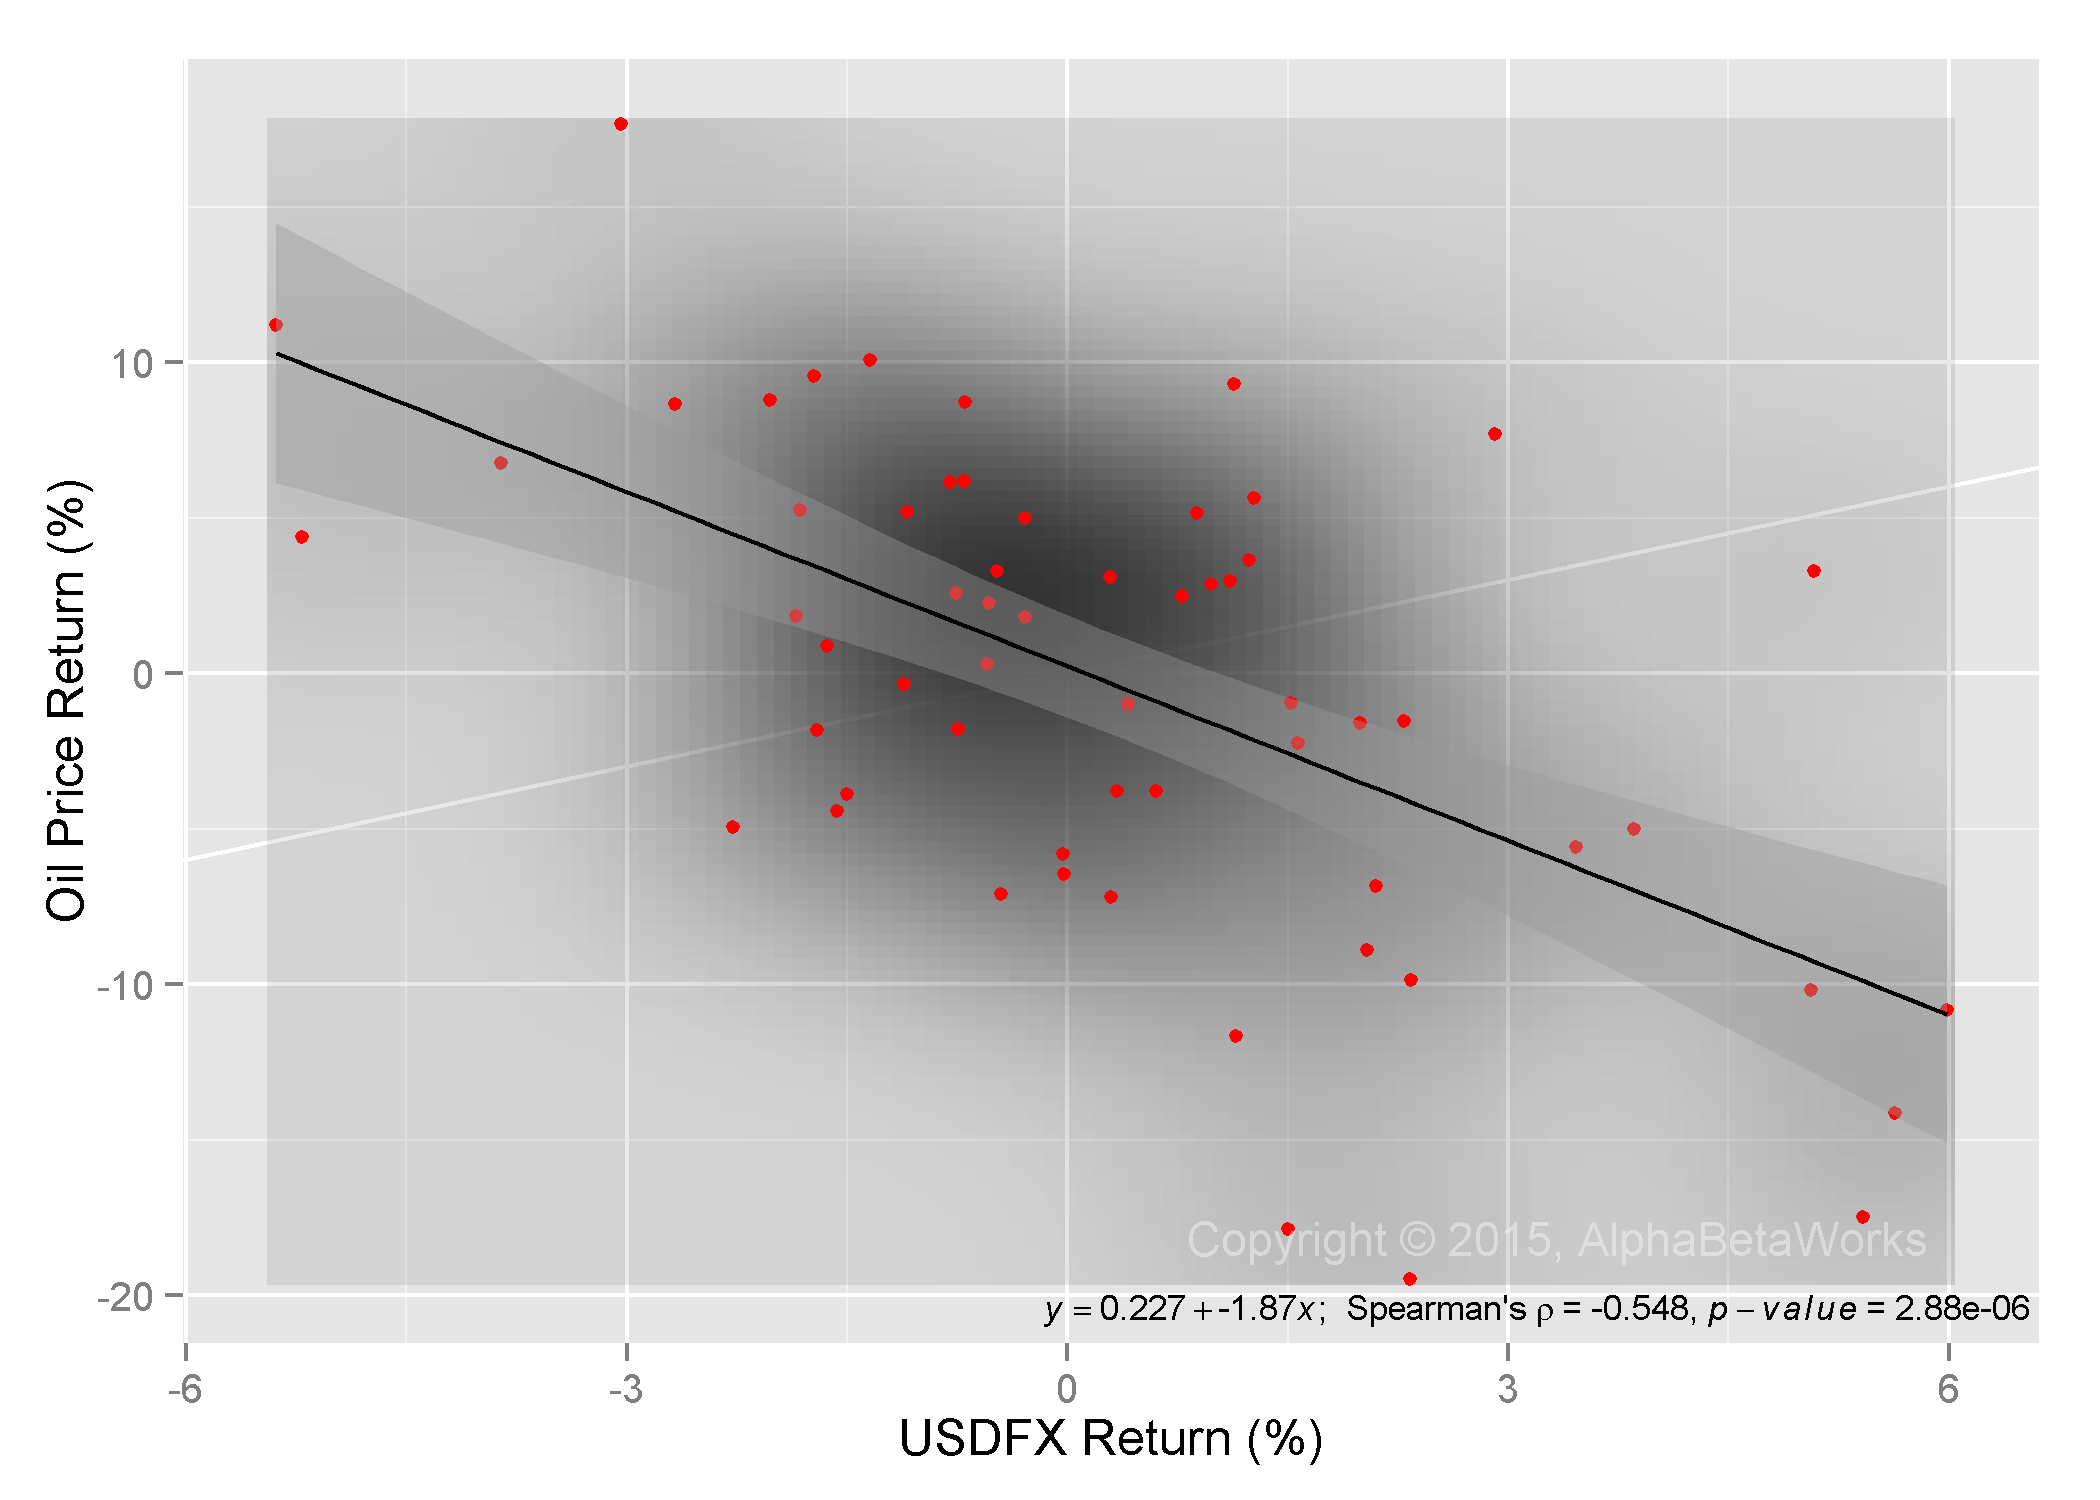
These businesses are sensitive to the price of imports and to the consumers’ purchasing power. When USD appreciates, U.S. retailers benefit from the drop in the price of imports and from the boost in U.S. consumers’ purchasing power. USD appreciation should also benefit foreign suppliers of U.S. retailers. Consequently, we expect foreign exporters and transportation companies to benefit from appreciating USD.

Foreign Sectors Most Positively Exposed to USD FX

There are two common techniques to quantify relationship between two variables: correlation and beta (leverage). Correlation between pure sector factor returns and USD returns quantifies the consistency of the relationship – how much of the sector variance is attributable to USD FX. Beta, or leverage, of pure sector factor returns relative to USD returns quantifies the magnitude of the relationship – how much sector changes given a change in USD FX.

Foreign Sectors with Highest USD Correlation

Foreign sectors most correlated to USD FX are dominated by transportation and technology companies. When USD appreciates, these businesses benefit the most from reduced competitiveness of U.S. Information Technology Industry, increased appetites of U.S. consumers, and decreased commodity prices:

Chart of international sector factors with market variance removed showing the highest correlation to USD FX

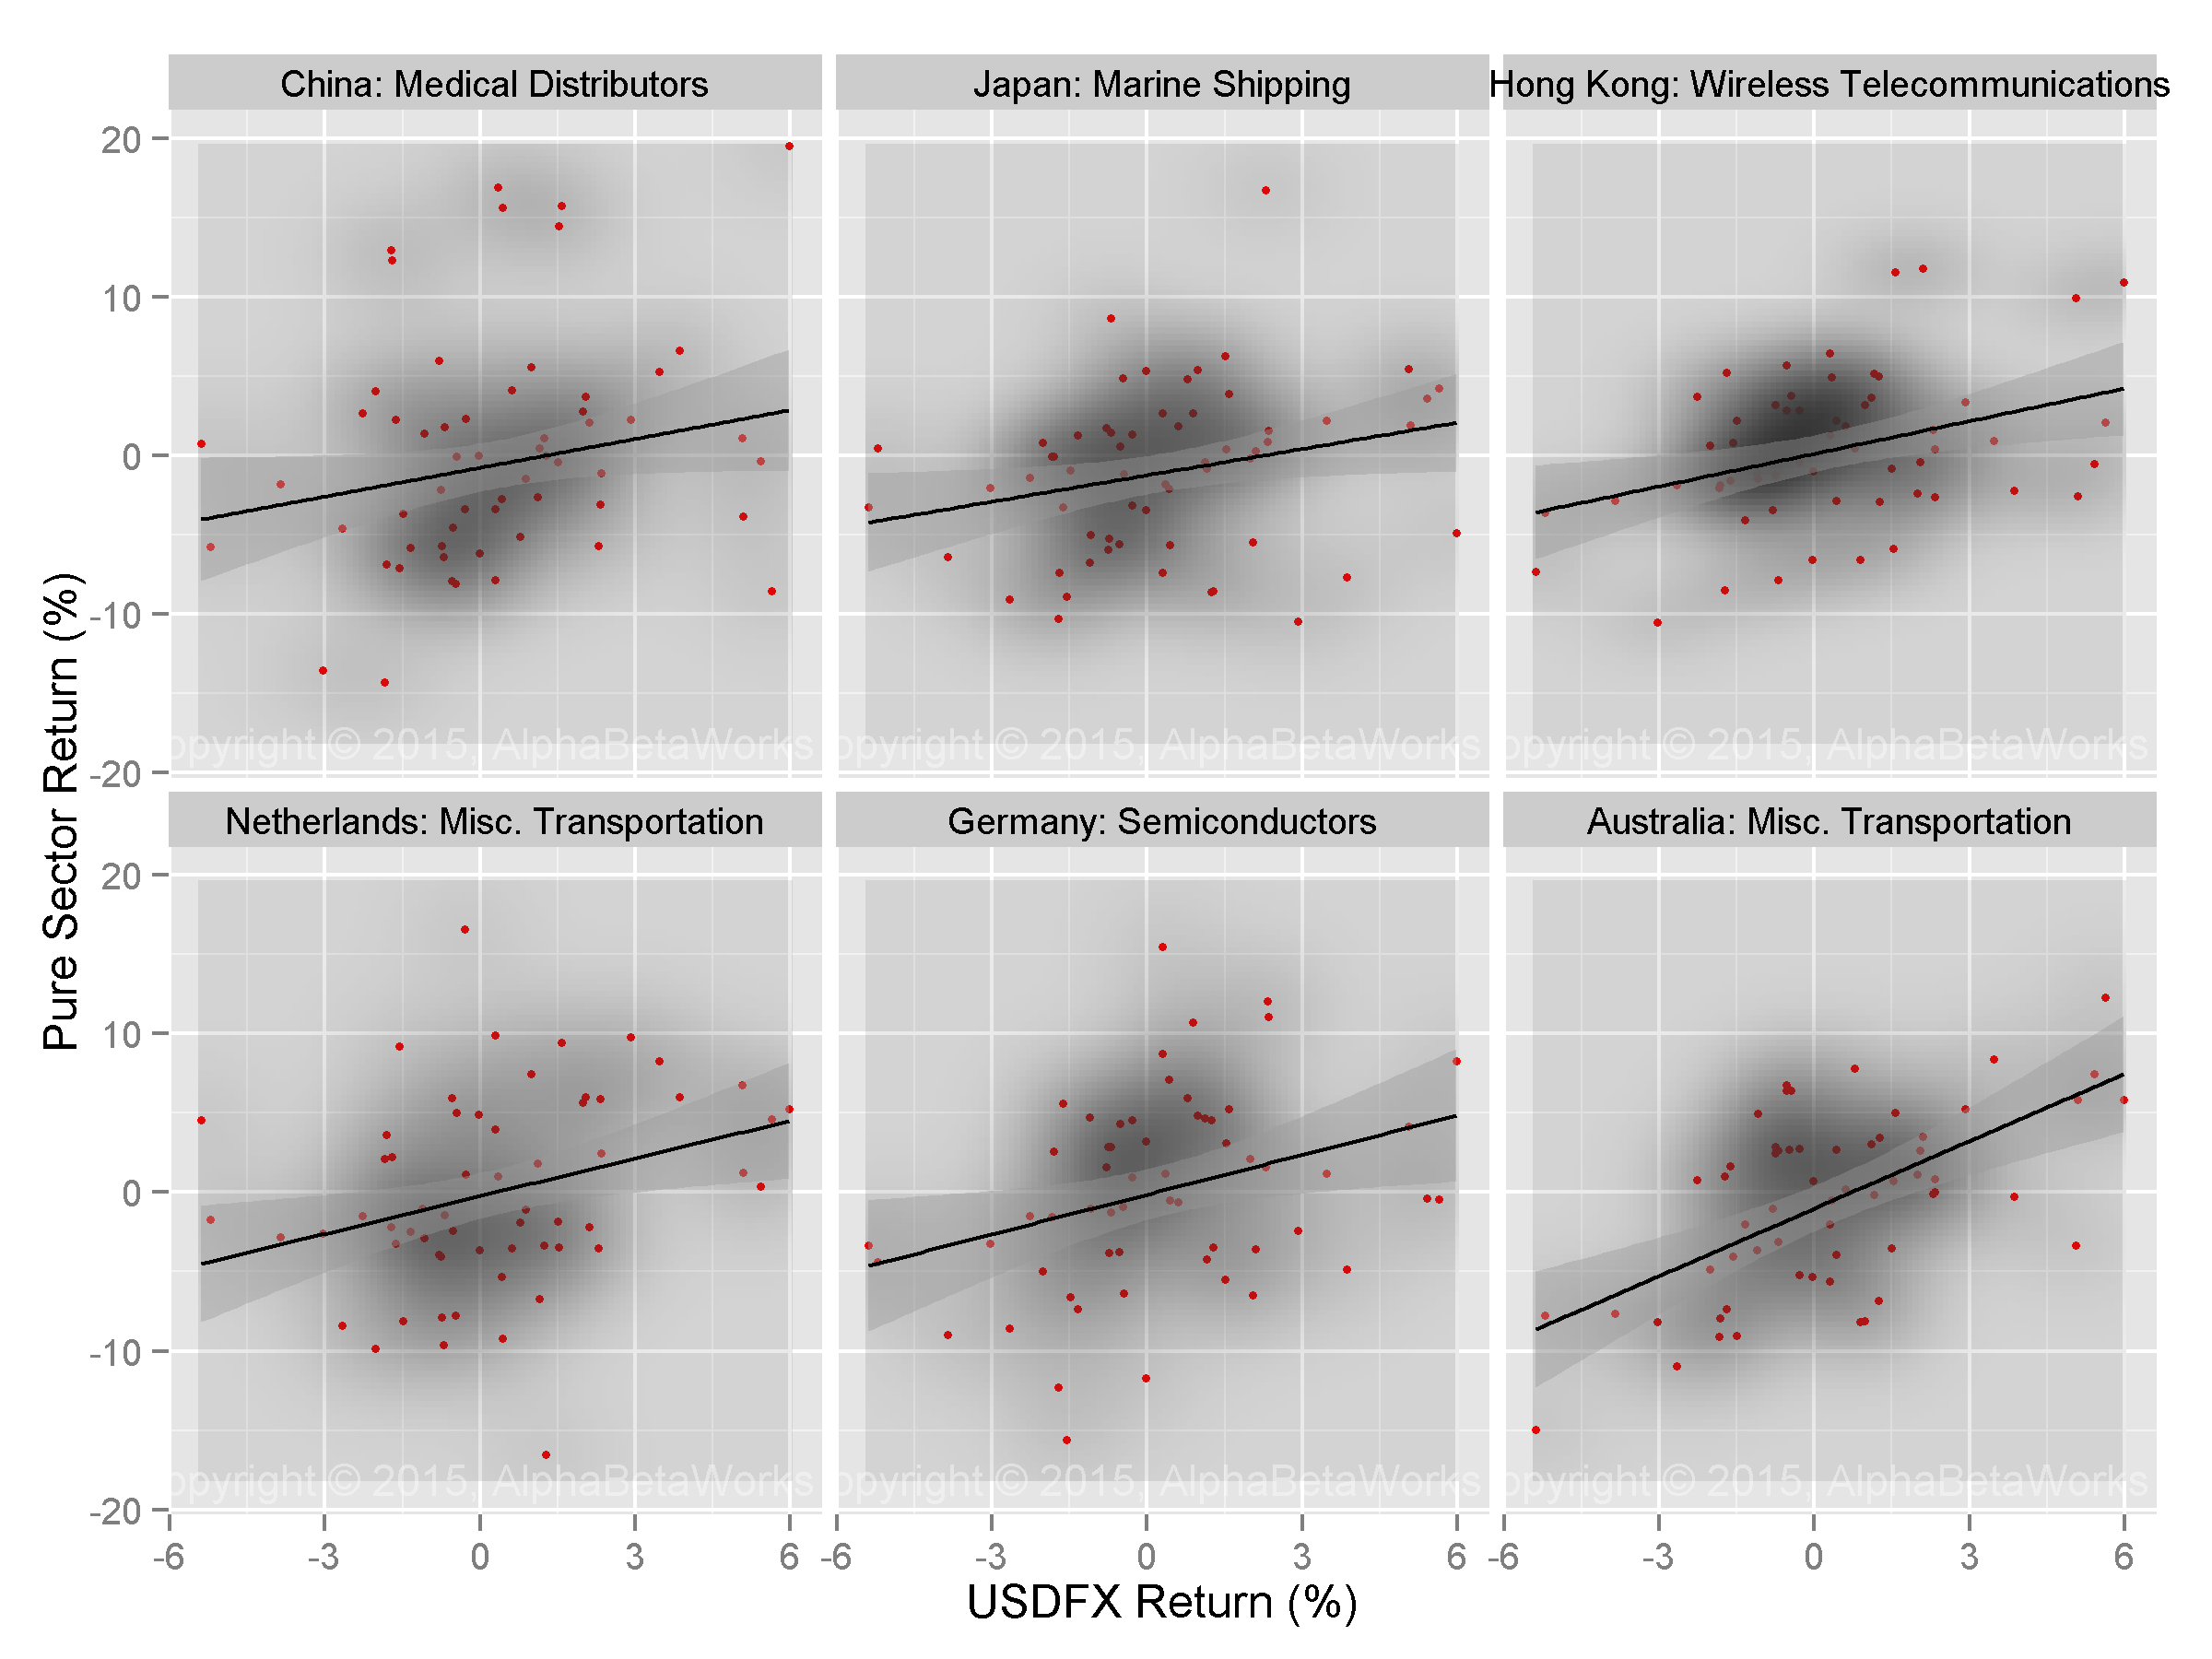
International Pure Sector Factors with Highest USD Correlation

Sector

USD FX
Correlation

USD FX Correlation
p-value
USD FX
Beta

USD FX Beta
p-value

China: Medical Distributors

0.28

0.0150 0.74

0.0223

Japan: Marine Shipping

0.31

0.0073 0.61

0.0206

Hong Kong: Wireless Telecommunications

0.31

0.0071 0.66

0.0061

Netherlands: Misc. Transportation

0.34

0.0043 0.93

0.0047

Germany: Semiconductors

0.42

0.0004 1.00

0.0033

Australia: Misc. Transportation

0.52

0.0000 1.24

0.0000

Foreign Sectors with Highest USD Beta

Likewise, foreign sectors with the highest beta (most leverage) to USD FX are dominated by transportation and technology companies. Chinese auto parts companies are another winner. Foreign Semiconductor and Auto Parts Sectors benefit from the reduced competitiveness of their U.S. competitors:

Chart of international sectors with market variance removed showing the highest beta to USD FX

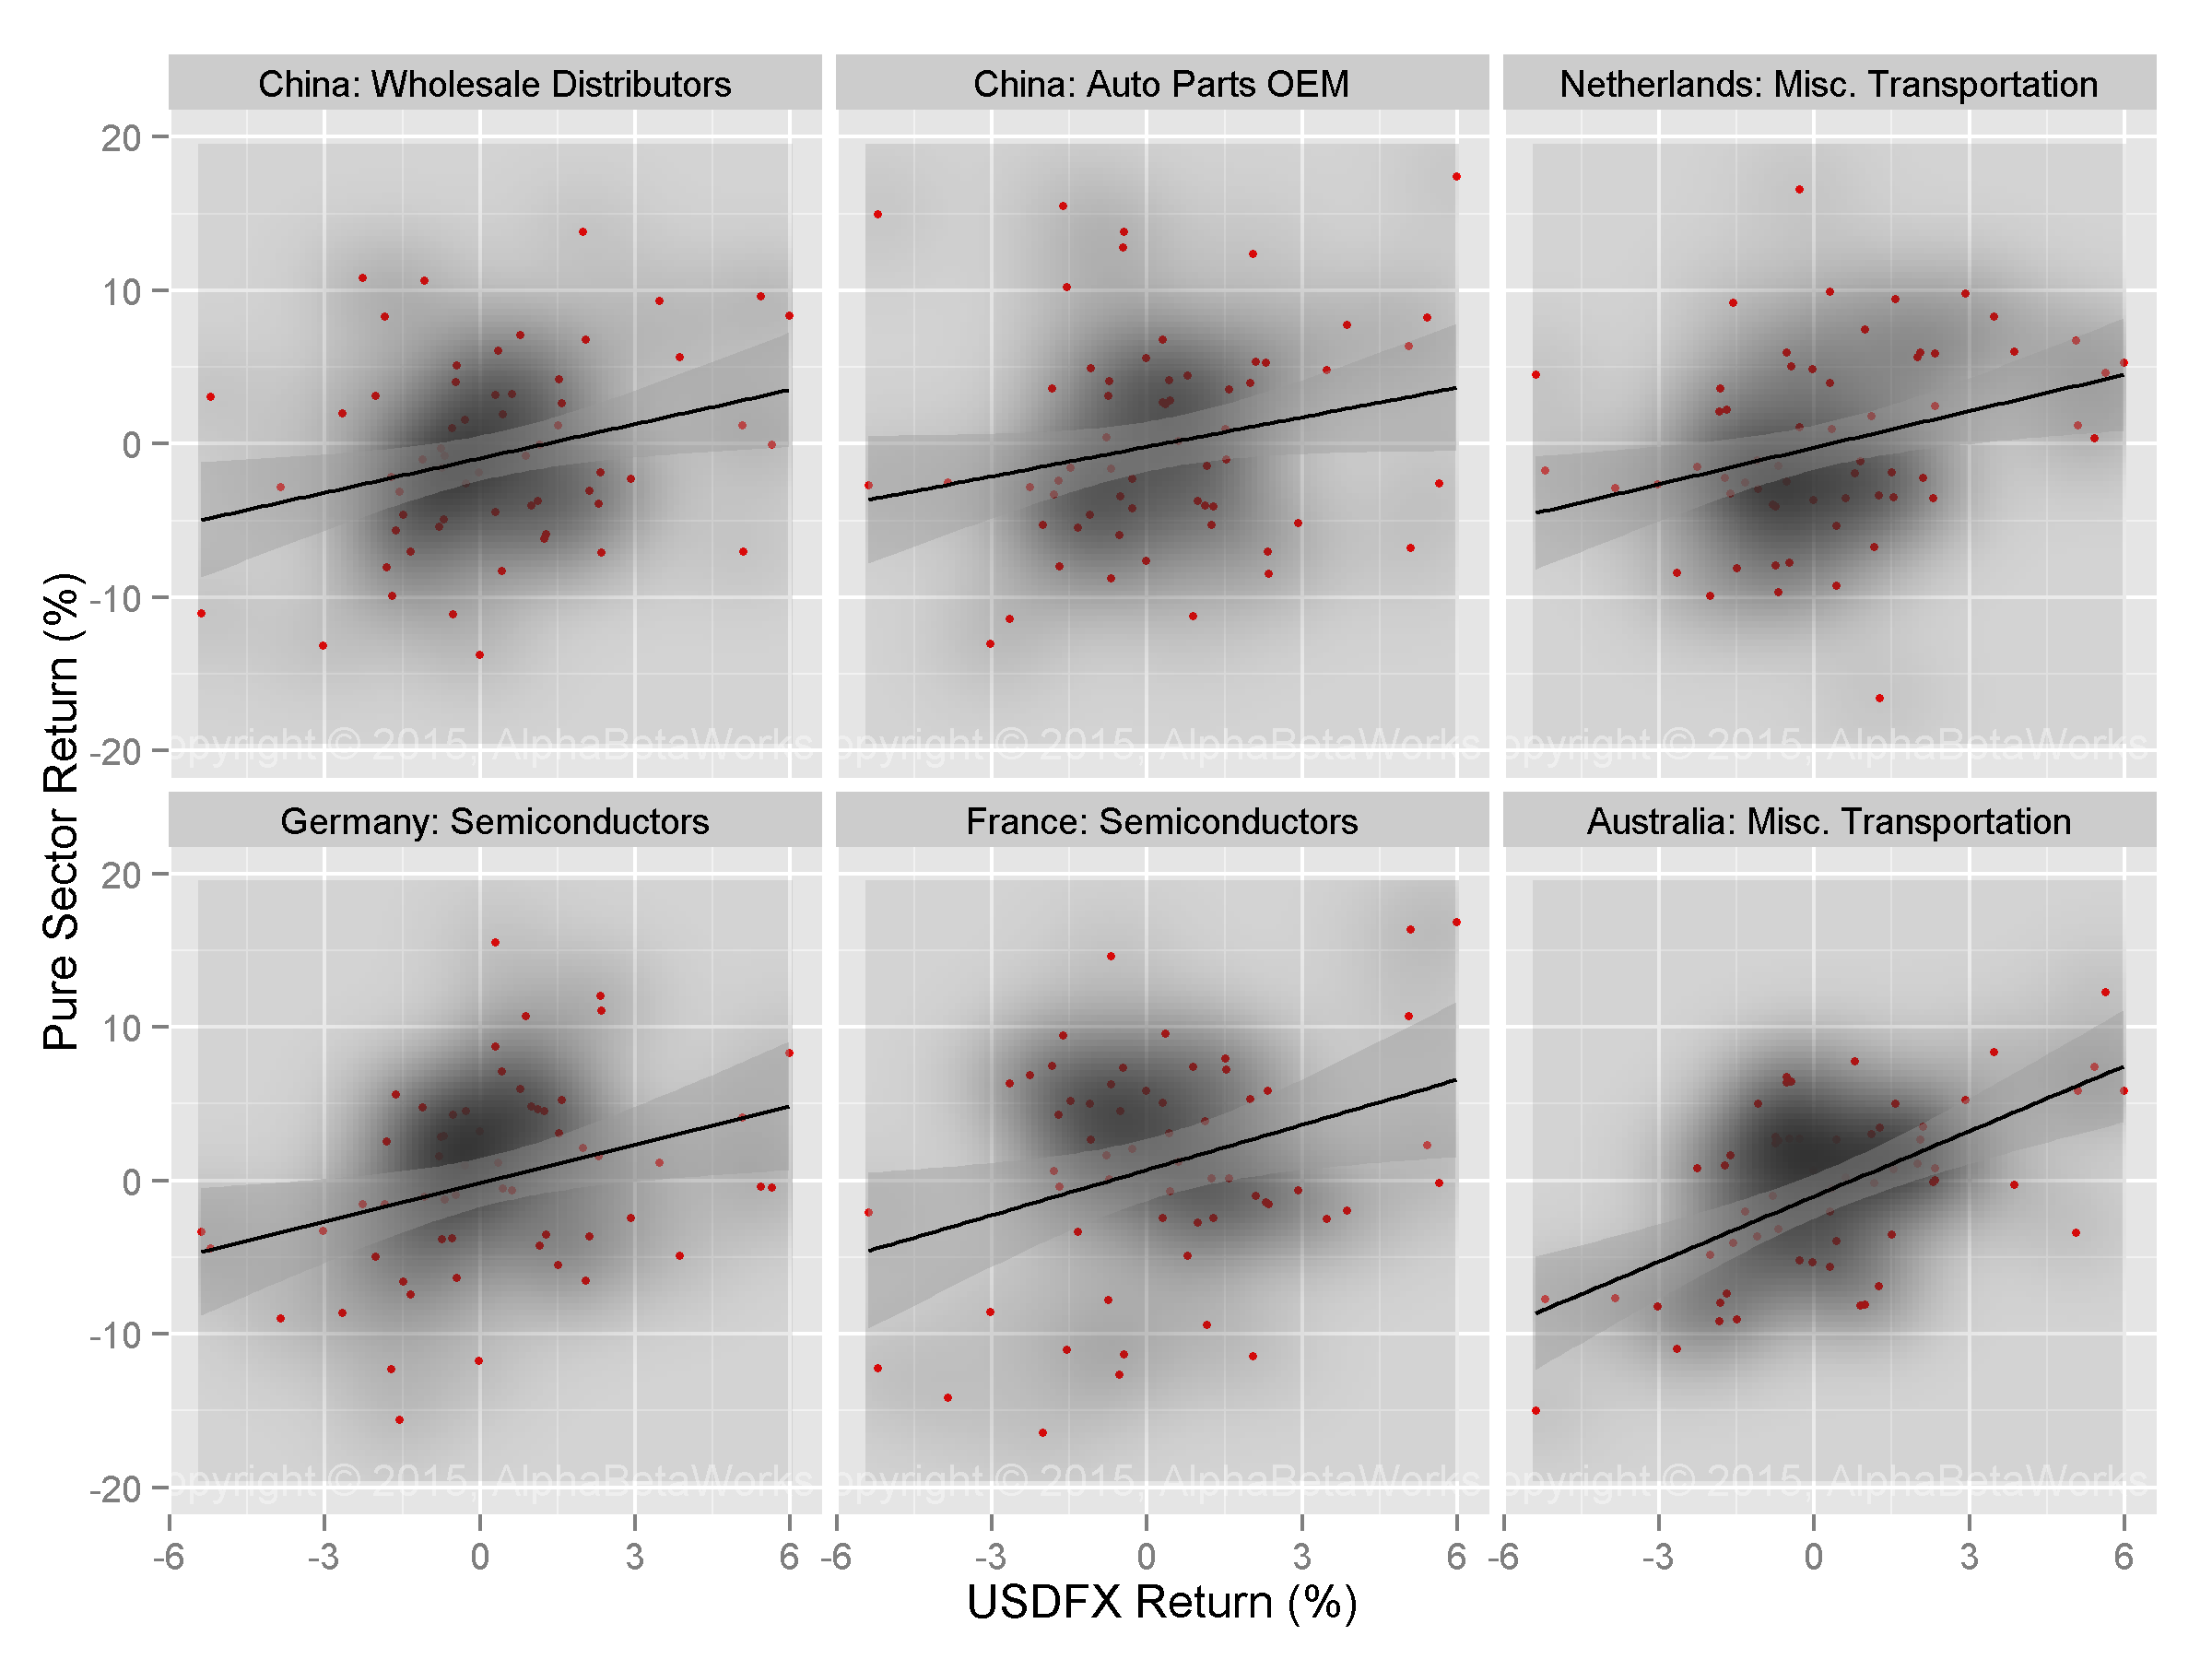
International Pure Sector Factors with Highest USD Beta

Sector

USD FX
Beta

USD FX Beta
p-value

China: Wholesale Distributors

0.81

0.0082

China: Auto Parts OEM

0.83

0.0191

Netherlands: Misc. Transportation

0.93

0.0047

Germany: Semiconductors

1.00

0.0033

France: Semiconductors

1.02

0.0082

Australia: Misc. Transportation

1.24

0.0000

Conclusions

  • By stripping away the effects of broad markets, we reveal the performance of pure sector factors and their relationships with USD FX.
  • U.S. importers and retailers most consistently benefit from appreciating USD.
  • U.S. commodity producers and information technology exporters most consistently suffer from appreciating USD.
  • The top foreign beneficiaries of these trends are Transportation, Technology, and Auto Parts Sectors.
The information herein is not represented or warranted to be accurate, correct, complete or timely.
Past performance is no guarantee of future results.
Copyright © 2012-2015, 
AlphaBetaWorks, a division of Alpha Beta Analytics, LLC. All rights reserved.
Content may not be republished without express written consent.

Sectors Most Exposed to USD FX

Currencies are major drivers of other assets. In periods of Foreign Exchange (FX) volatility, there is much discussion of its impact on specific equity sectors. Regrettably, market noise obscures true industry-specific performance, so FX impact is impossible to judge from simple index returns. But, by stripping away market effects, we observe relationships between pure sector returns and exchange rates:

  • Oil Drillers have the largest negative correlation with USD and one of the largest negative exposures.
  • Retailers have the highest positive correlation and one of the highest positive exposures.

Below we identify sectors most exposed to USD FX volatility and quantify these relationships.

Pure Sector Performance

As we illustrated earlier, market noise obscures relationships among individual sectors; it also conceals industry-specific performance. Without separating pure industry-specific returns from the market, robust risk management, performance attribution, and investment skill evaluation are impossible. When stripped of market effects, pure sector factors capture sector-specific trends and risks, including sector-specific USD exposures.

Equity Market’s USD FX Exposure

In addition to industry-specific foreign currency exposures, the equity market is significantly correlated with the currency market. Broad macroeconomic risks affect both exchange rates and the equity market. Below we plot U.S. Market returns against USD returns:

Chart of the correlation between USD FX and U.S. Equity Market

USD FX and U.S. Market Return Correlation

The beta of the U.S. Equity Market to USD FX is approximately -1.1: Over the past five years, when USD appreciated by 1% relative to a basket of foreign currencies, the U.S. Equity Market decreased by approximately 1.1%. USD FX variance explains approximately 38% of U.S. market variance. Perhaps more accurately, 38% of U.S. market variance is due to shared macroeconomic variables that drive both equities and currencies.

The exposure of an individual stock to USD FX is a combination of market, sector, and idiosyncratic effects.

Sectors Most Negatively Exposed to USD FX

Sectors with the highest negative correlation to USD are not surprising:

Chart of the correlation between pure sector factors and USD FX for the sectors most negatively correlated with USD FX

Pure Sector Factors Most Negatively Correlated with USD FX

Sector USD FX Correlation USD FX Correlation
p-value
USD FX Beta USD FX Beta
p-value
Contract Drilling -0.45 0.0002 -1.01 0.0006
Integrated Oil -0.39 0.0011 -0.56 0.0011
Coal -0.36 0.0021 -1.10 0.0004
Oilfield Services Equipment -0.34 0.0042 -0.69 0.0059
Information Technology Services -0.30 0.0109 -0.27 0.0373
Oil and Gas Production -0.27 0.0174 -0.44 0.0131

(Note that we use the Spearman’s rank correlation coefficient to evaluate correlations. Spearman’s correlation is robust against outliers, unlike the commonly used Pearson’s correlation. All correlations are significant; most at a 1% level or better.)

Oil Price USD FX Exposure

Commodity industries’ (oil, coal, etc) exposure to USD FX is due to their macroeconomic sensitivity, inflation sensitivity, and the global nature of the commodity markets. When USD strengthens, USD-denominated commodity prices have to decline in order for broad currency-weighted prices to remain unchanged. Consequently, commodity prices tend to be strongly negatively correlated with USD FX:

Chart of the correlation between historical USD FX returns and Oil Price returns

USD FX and Oil Price Return Correlation

The Oil Price’s beta to USD FX is -1.9: Over the past five years, when USD appreciated by 1% relative to a basket of foreign currencies, the Oil Price decreased by approximately 1.9%. 30% of Oil Price variance is explained by the shared macroeconomic variables that drive both commodity and currency markets.

Information Technology Sector USD FX Exposure

Information Technology Services is a typical export industry that suffers margin compression when USD-denominated costs increase relative to foreign-currency-denominated revenues. However, our analysis indicates this exposure is barely statistically significant with the beta’s p-value of 0.04. This exposure is also low: a 1% increase in USD FX is associated with approximately 0.3% decrease in the value of the sector.

Sectors Most Positively Exposed to USD FX

The list of sectors with the highest positive correlation to USD FX is less intuitive:

Chart of the correlation between USD FX returns and the returns of pure sectors factors most positively correlated with it

Pure Sector Factors Most Positively Correlated with USD FX

Sector USD FX Correlation USD FX Correlation
p-value
USD FX Beta USD FX Beta
p-value
Real Estate Investment Trusts 0.29 0.0121 0.39 0.0101
Pulp and Paper 0.30 0.0102 0.52 0.0123
Aerospace and Defense 0.31 0.0084 0.32 0.0206
Beverages Alcoholic 0.33 0.0049 0.43 0.0025
Catalog Specialty Distribution 0.33 0.0045 0.41 0.0349
Department Stores 0.37 0.0020 0.70 0.0085

The list is dominated by import-sensitive sectors that benefit from a boost in U.S. consumer purchasing power from an appreciating USD.  Also, when the USD appreciates, the associated drop in import prices boosts aerospace and defense companies, likely due to depreciating foreign inputs.

The presence of REITs on the list appears unexpected. Yet, it is due to the same shared variables as the negative correlation between REITs and oil prices: inflation, growth rates, and macroeconomic uncertainty.

Conclusion

  • Industry-specific performance is clouded by market noise.
  • By stripping away the effects of market and macroeconomic variables, we reveal the performance of Pure Sector Factors and their relationships with USD FX.
  • Commodity producers and information technology exporters most consistently suffer from appreciating USD.
  • Importers and retailers most consistently benefit from appreciating USD.
The information herein is not represented or warranted to be accurate, correct, complete or timely.
Past performance is no guarantee of future results.
Copyright © 2012-2015, 
AlphaBetaWorks, a division of Alpha Beta Analytics, LLC. All rights reserved.
Content may not be republished without express written consent.