Tag Archives: factor exposures

Hedge Fund Crowding Update – Q2 2016

Typical analysis of hedge fund crowding focuses on individual stocks. This is misguided since over 85% of hedge funds’ monthly return variance is due to factor (systematic) exposures. Their residual, (idiosyncratic, or stock-specific) bets account for less than 15% of it. Likewise, factor crowding has driven much of the hedge fund industry’s performance and volatility. In Q2 2016, half of U.S. hedge funds’ long equity risk (tracking error) relative to the U.S. Market was due to a single crowded factor and two thirds was due to three crowded factors. This article reviews the most crowded bets at 6/30/2016 that have been driving hedge funds’ long equity performance.

Note that active risk is required to generate active returns and warrant management fees. Yet, not all exposures are created equal. Systematic exposures that are shared by the entire hedge fund industry and that can be obtained cheaply via index funds and ETFs do not warrant the same compensation as the distinctive insights of gifted managers. Even worse, these crowded bets expose investors to the damaging stampede of impatient capital.

Identifying Hedge Fund Crowding

We followed the approach of our earlier studies of hedge fund crowding: We processed regulatory filings of over 1,000 hedge funds and created a position-weighted portfolio (HF Aggregate) comprising all tractable hedge fund long U.S. equity portfolios. We then analyzed HF Aggregate’s risk relative to the U.S. Market. The most crowded bets are driving the hedge fund industry’s risk and performance. We identified these bets using the AlphaBetaWorks (ABW) Statistical Equity Risk Model – an effective system of forecasting future risk and performance.

Hedge Fund Industry’s Risk

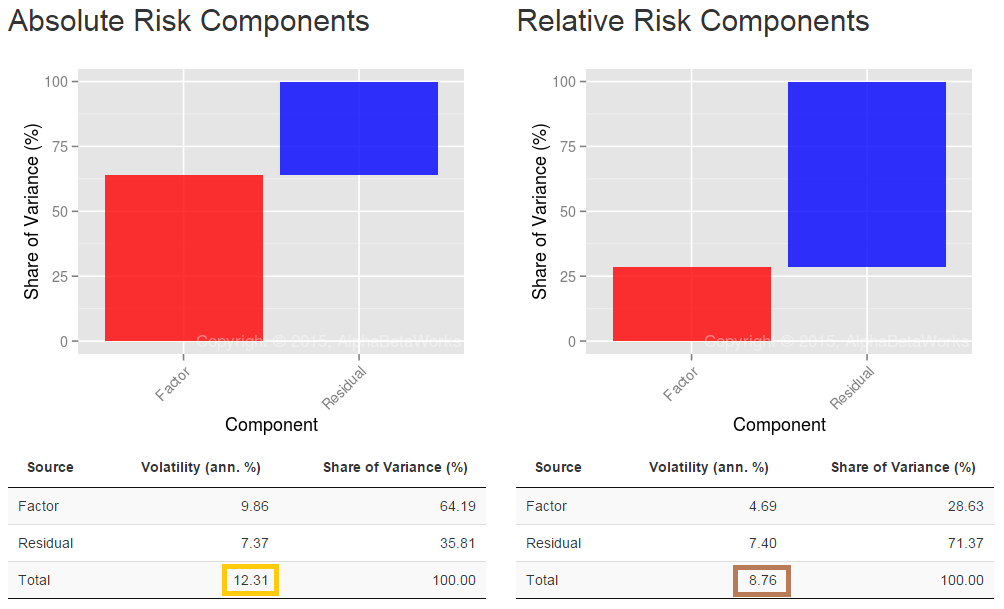
HF Aggregate had 3.5% estimated future volatility (tracking error) relative to the U.S. Market in Q2 2016. Nearly 80% of this was due to its factor (systematic) exposures, rather than individual stocks:

Factor (systematic) and residual (idiosyncratic) components of the U.S. Hedge Fund Aggregate’s variance relative to U.S. Market on 6/30/2016

Components of the Relative Risk for U.S. Hedge Fund Aggregate in Q2 2016

Source Volatility (ann. %) Share of Variance (%)
Factor 3.12 77.84
Residual 1.67 22.16
Total 3.54 100.00

A typical analysis of hedge fund crowding that focuses on individual stocks and popular holdings is thus misguided. It dwells on only 20% of the industry’s risk, overlooking the other 80%. Funds with no shared positions can still correlate highly when they have similar factor exposures. Consequently, such a simplistic analysis of position overlap and holdings misrepresents fund risk risk and fosters dangerous complacency.

Hedge Fund Factor (Systematic) Crowding

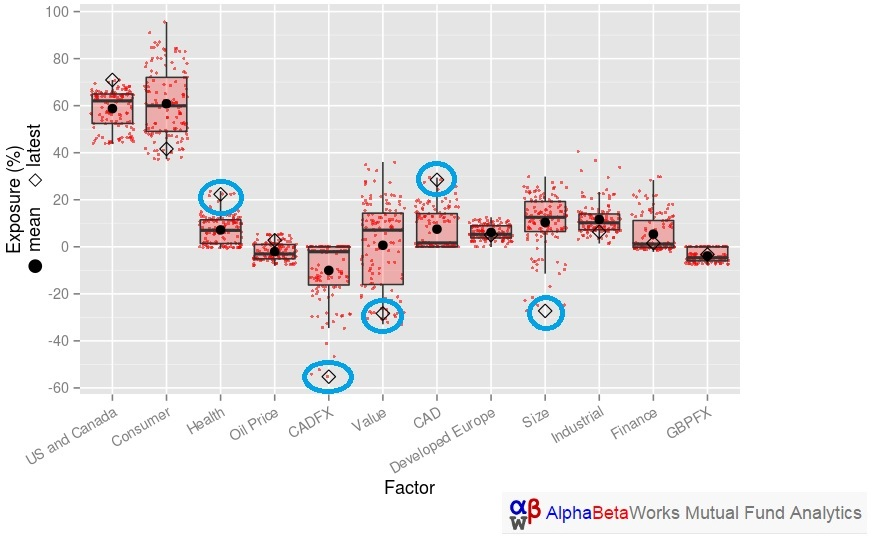
Below are HF Aggregate’s principal factor exposures (in red) relative to the U.S. Market’s (in gray). These are the primary bets behind factor risk and crowding in the table above:

Chart of the factor exposures contributing most to the factor variance of U.S. Hedge Fund Aggregate Portfolio relative to U.S. Market on 6/30/2016

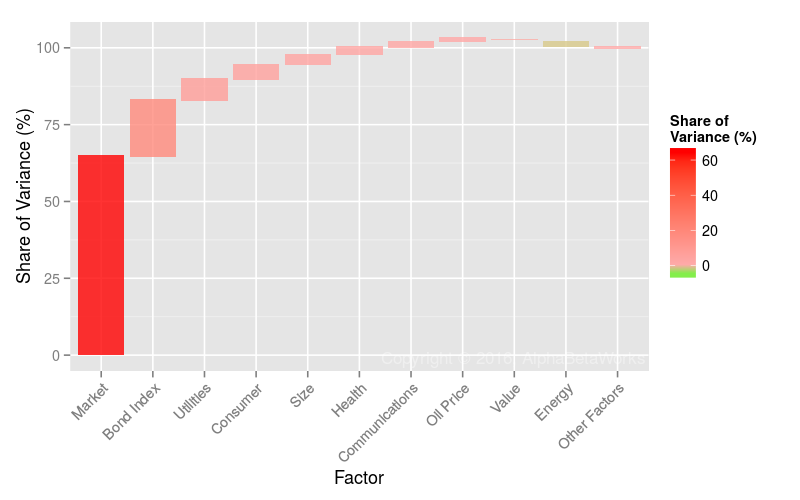
Significant Absolute and Residual Factor Exposures of U.S. Hedge Fund Aggregate in Q2 2016

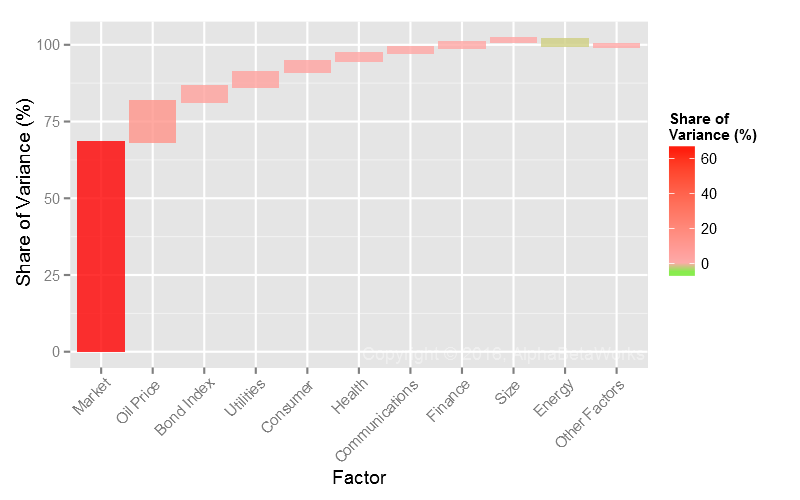
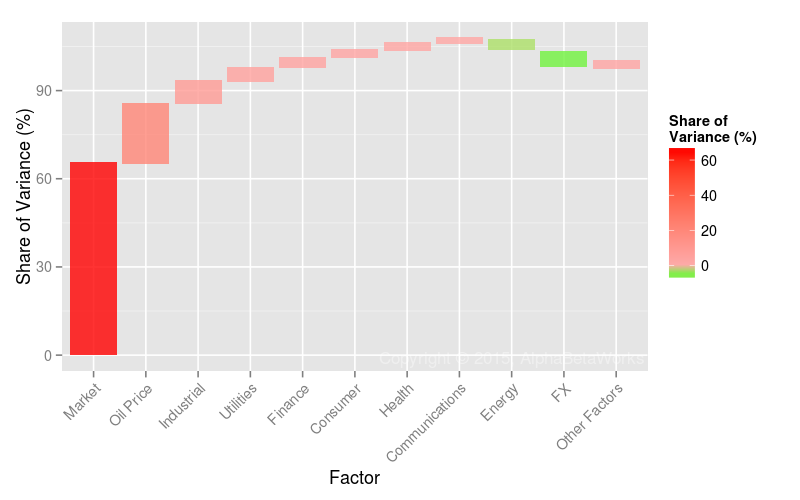
Market (Beta) is the dominant long equity bet within the hedge fund industry. It accounts for approximately two thirds of relative factor risk and half of relative total risk:

Chart of the main factors and their cumulative contribution to the factor variance of U.S. Hedge Fund Aggregate Portfolio relative to U.S. Market on 6/30/2016

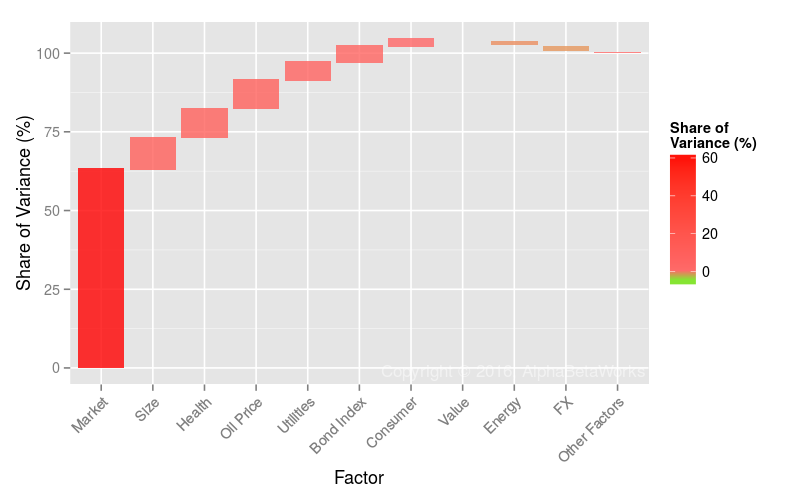
Factors Contributing Most to Relative Factor Variance of U.S. Hedge Fund Aggregate in Q2 2016

Factor Relative Exposure Factor Volatility Share of Relative Factor Variance Share of Relative Total Variance
Market 17.62 12.58 62.96 49.01
Size -9.39 8.46 10.00 7.78
Health 9.45 6.95 9.19 7.15
Oil Price 1.89 31.29 9.12 7.10
Utilities -3.74 12.42 5.71 4.44
Bond Index -7.90 3.55 5.01 3.90
Consumer -5.40 3.96 2.30 1.79
FX 2.18 7.30 -1.99 -1.55
Energy -2.30 13.44 -1.62 -1.26
Value -1.81 13.33 -0.53 -0.41

(Relative exposures and relative variance contribution. All values are in %. Volatility is annualized.)

The most crowded long equity bet is high systematic exposure to the U.S. Market – not any particular stock. In fact, high systematic market risk is more important to U.S. hedge fund long portfolios than all of their stock-specific bets combined. This makes the popular fascination with fund holdings and position overlap particularly dangerous. As factor crowding continues to dominate stock-specific risk and stock picking skill, the survival of asset managers and allocators increasingly relies on their grasp of systematic crowding and the predictive power of their risk management systems.

Hedge Fund U.S. Market Factor Crowding

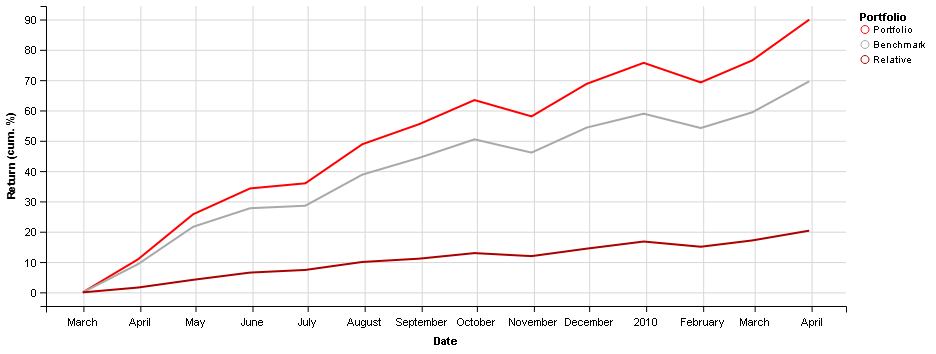
The current Market Factor Exposure of HF Aggregate is approximately 115% (its Market Beta is approximately 1.15). This exposure has remained above 100% since 2012:

Chart of the historical exposure of U.S. Hedge Fund Aggregate’s to the U.S. Market Factor

U.S. Hedge Fund Aggregate’s U.S. Market Factor Exposure History

The average hedge fund long equity portfolio now carries approximately 15% more market risk than the Russell 3000 Index and approximately 20% more than the slightly less risky S&P 500 Index. This higher exposure illustrates the danger of evaluating them relative to broad benchmarks. In a year when S&P 500 returns 10%, the average hedge fund would need to return approximately 12% to match what investors would have earned by taking the same risk passively.

Hedge Fund U.S. Size Factor Crowding

The ABW Size Factor is the difference in returns, net of market and sector effects, between the largest and the smallest stocks. It is closely related to the Fama–French SMB Factor, but includes critical fixes: The ABW Size Factor strips out market and sector effects from security returns, revealing pure size risk. By contrast, SMB Factor captures size risk together with market beta and sector effects, since market exposure and sector composition differ between small- and large-cap stocks. This market and sector noise in the SMB Factor makes accurate risk estimation challenging and accurate performance attribution impossible.

Negative Size exposure corresponds to small-cap risk.  Hedge fund long equity portfolios currently have near-record small-cap exposure, equivalent to an approximately 10% bet on small company outperformance:

Chart of the historical exposure of U.S. Hedge Fund Aggregate’s to the U.S. Size Factor

U.S. Hedge Fund Aggregate’s U.S. Size Factor Exposure History

Hedge Fund U.S. Health Factor Crowding

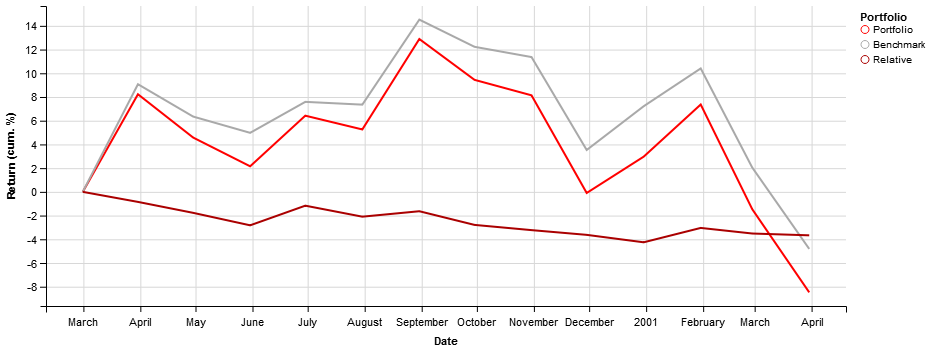
Current hedge fund Heath Factor exposure remains near an all-time high:

Chart of the historical exposure of U.S. Hedge Fund Aggregate’s to the U.S. Health Factor

U.S. Hedge Fund Aggregate’s U.S. Size Health Factor Exposure History

Hedge Fund Residual (Idiosyncratic) Crowding

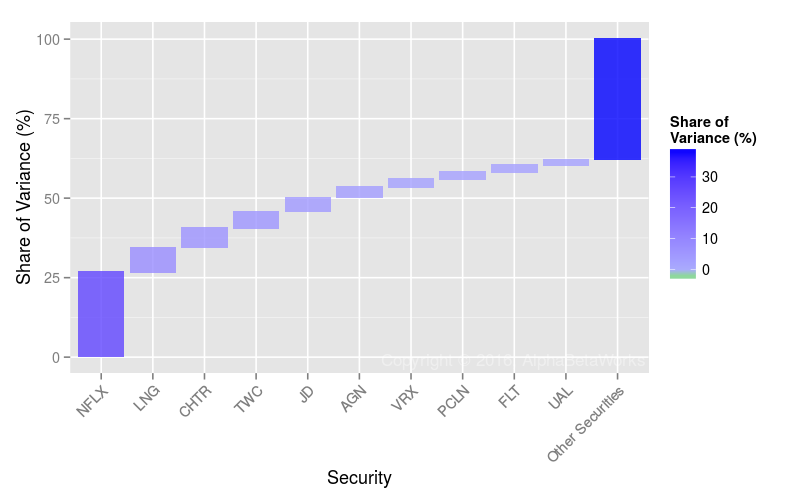
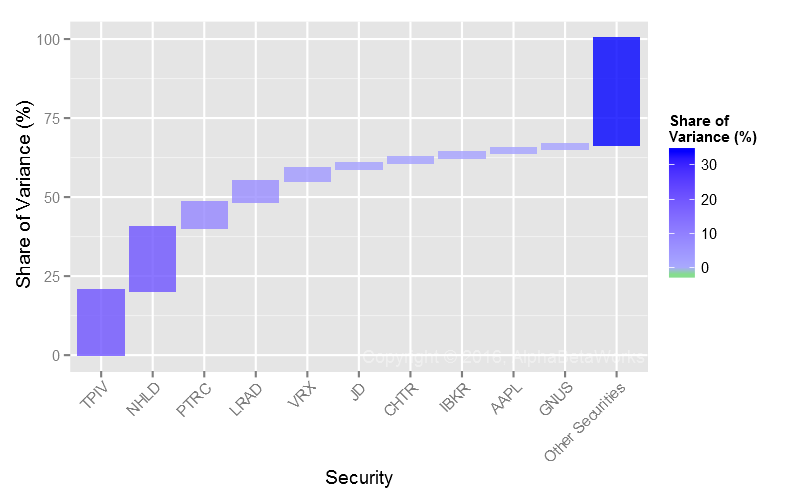
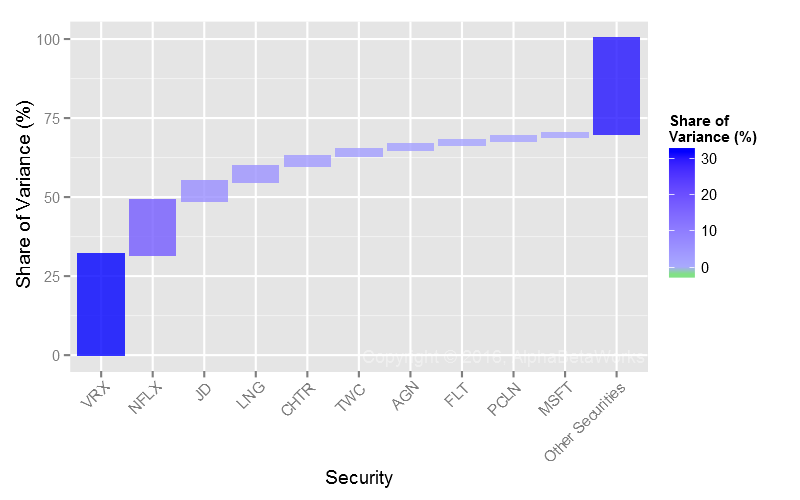
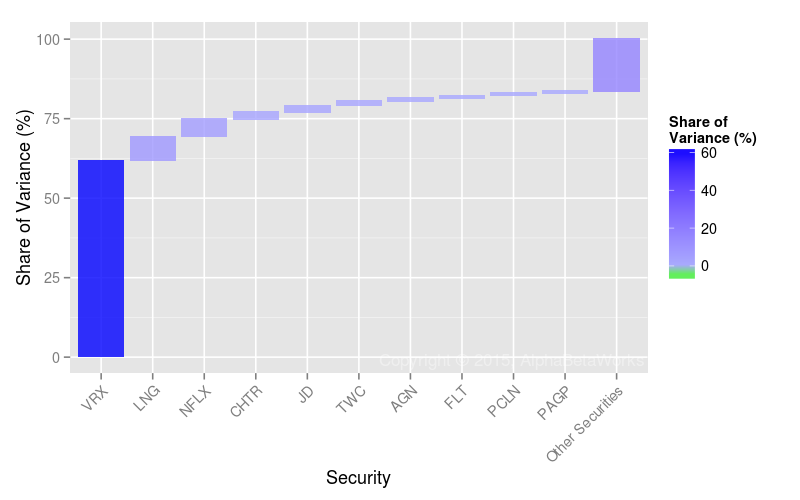
As of 6/30/2016, a quarter of hedge fund crowding was due to residual (idiosyncratic, stock-specific) risk. As factor crowding increased, residual crowding has diminished. Thus, stock-specific risk and stock-picking still have faded in importance:

Chart of the main stock-specific bets and their cumulative contribution to the residual variance of U.S. Hedge Fund Aggregate Portfolio relative to U.S. Market on 6/30/2016

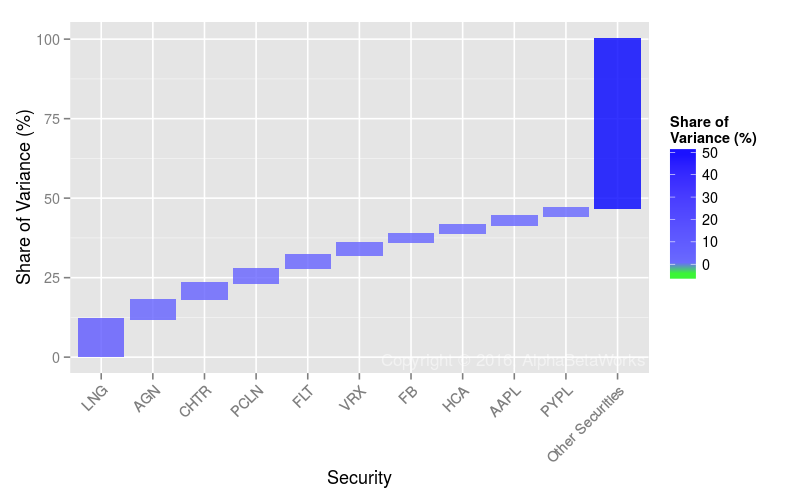
Stocks Contributing Most to Relative Residual Variance of U.S. Hedge Fund Aggregate in Q2 2016

Symbol Name Relative Exposure Residual Volatility Share of Relative Residual Variance Share of Relative Total Variance
LNG Cheniere Energy 1.65 34.66 11.77 2.61
AGN Allergan plc 2.79 14.71 6.06 1.34
CHTR Charter Communications 1.84 20.58 5.16 1.14
PCLN Priceline Group 1.61 22.25 4.64 1.03
FLT FleetCor Technologies 1.74 19.87 4.29 0.95
VRX Valeant Pharmaceuticals 0.82 39.76 3.85 0.85
FB Facebook, Inc. Class A 0.89 31.39 2.84 0.63
HCA HCA Holdings 1.21 22.78 2.76 0.61
AAPL Apple Inc. -1.68 16.41 2.74 0.61
PYPL PayPal Holdings Inc 1.66 15.88 2.49 0.55

(Relative exposures and relative variance contribution. All values are in %. Volatility is annualized.)

The most crowded stocks continue to be sensitive to asset flows in and out of the industry. Yet, in the current environment of extreme systematic hedge fund crowding, allocators and fund followers should continue to pay more attention to factor risk. Indeed, allocators invested in a seemingly diversified portfolio of hedge funds may, in fact, be paying high active fees for a passive factor portfolio.

Summary

  • At Q2 2016, nearly 80% of hedge funds’ relative long equity risk was due to factor, or systematic, exposures.
  • The main source of Q2 2016 hedge fund crowding, responsible for half of long equity tracking error, was record U.S. Market exposure.
  • Short Size Factor (small-cap bias) and long Health Factor exposures were the next most crowded bets, both near their historic extremes.
  • Given high current hedge fund factor crowding, an analysis of aggregate and individual hedge funds must focus on systematic exposures and risk shared across positions, and not solely on individual positions.
  • Fund investors, followers, and allocators must monitor whether they are investing in exceptional insights or generic factor exposures otherwise available via cheap passive instruments.
The information herein is not represented or warranted to be accurate, correct, complete or timely.
Past performance is no guarantee of future results.
Copyright © 2012-2016, AlphaBetaWorks, a division of Alpha Beta Analytics, LLC. All rights reserved.
Content may not be republished without express written consent.

Hedge Fund Crowding Update – Q1 2016

Analyses of hedge fund crowding typically focus on hedge funds’ individual positions (their residual, idiosyncratic, or stock-specific exposures). Yet, over 85% of the monthly return variance for the majority of hedge fund long equity portfolios is due to their factor (systematic) exposures. Stock-specific bets account for less than 15%. Factor – rather than residual – crowding has driven much of the industry’s past exuberance and its recent grief. In Q1 2016, nearly half of U.S. hedge funds’ relative long equity risk (tracking error) was due to a single factor, U.S. Market Exposure. This piece surveys the crowded factor and residual exposures at 3/31/2016 that are likely to drive long equity performance for hedge funds in coming quarters.

Identifying Hedge Fund Crowding

This piece follows the approach of our earlier articles on crowding: We processed regulatory filings of over 1,000 hedge funds and created a position-weighted portfolio (HF Aggregate) consisting of all tractable hedge fund long U.S. equity portfolios. We then analyzed HF Aggregate’s risk relative to the U.S. Market using the AlphaBetaWorks Statistical Equity Risk Model – a proven system for performance forecasting. The most crowded hedge fund bets are factors and, to a lesser extent, stocks that drive HF Aggregate’s relative risk and performance. Ironically, these are rarely the largest or the most common hedge fund positions.

Hedge Fund Aggregate’s Risk

The Q1 2016 HF Aggregate had 3.4% estimated future tracking error relative to the U.S. Market. Factor (systematic) exposures accounted for over two thirds of it:

Factor (systematic) and residual (idiosyncratic) components of U.S. hedge fund crowding and U.S. Hedge Fund Aggregate’s variance relative to U.S. Market on 3/31/2016

Components of the Relative Risk for U.S. Hedge Fund Aggregate in Q1 2016

Source Volatility (ann. %) Share of Variance (%)
Factor 2.78 68.23
Residual 1.89 31.77
Total 3.36 100.00

A simplistic analysis of hedge fund crowding that focuses on individual positions will overlook systematic exposures. Yet, they are responsible for over two thirds of the hedge fund industry’s risk. Since funds with no shared positions but similar factor exposures will correlate highly, a simplistic crowding analysis that lacks a predictive risk model will misidentify such similar funds as differentiated. This will misrepresent their risk and can foster dangerous complacency.

Hedge Fund Factor (Systematic) Crowding

Below are the principal factor exposures (in red) relative to U.S. Market’s exposures (in gray) that are responsible for the factor crowding in the above table:

Chart of the factor exposures contributing most to the U.S. hedge fund crowding and factor variance of U.S. Hedge Fund Aggregate Portfolio relative to U.S. Market on 3/31/2016

Significant Absolute and Relative Factor Exposures of U.S. Hedge Fund Aggregate in Q1 2016

Of these exposures, Market (Beta) alone accounts for approximately two thirds of the relative and half of the total factor risk:

Chart of the main factors and their cumulative contribution to the factor variance of U.S. Hedge Fund Aggregate Portfolio relative to U.S. Market on 3/31/2016

Factors Contributing Most to Relative Factor Variance of U.S. Hedge Fund Aggregate in Q1 2016

Factor Relative Exposure Factor Volatility Share of Relative Factor Variance Share of Relative Total Variance
Market 15.46 12.67 64.54 44.04
Bond Index -21.46 3.32 18.23 12.44
Utilities -3.56 11.75 6.76 4.61
Consumer -9.07 3.97 4.74 3.23
Size -3.59 8.39 3.30 2.25
Health 3.44 7.29 2.48 1.69
Energy -2.50 13.17 -2.42 -1.65
Communications -1.17 12.02 1.82 1.24
Oil Price 0.18 30.91 0.99 0.68
Value -1.00 13.21 -0.74 -0.51

(Relative exposures and relative variance contribution. All values are in %. Volatility is annualized.)

The U.S. hedge fund industry’s most crowded bet is not a stock, or stocks, it is high systematic exposure to the U.S. Market. This makes the popular fascination with fund holdings and position overlap particularly dangerous. This factor crowding explains much of recent hedge fund misery. As large asset bases continue to diminish the importance of stock-specific risk, the survival of asset managers and allocators will increasingly rely on their analysis of systematic crowding with robust and predictive factor models.

Hedge Fund U.S. Market Factor Crowding

After working to refine our historical hedge fund portfolio database with particular attention to defunct firms and survivorship bias, we have an increasingly accurate picture of HF Aggregate’s historical factor exposures. Its current Market Factor Exposure is approximately 115% (i.e. the HF Aggregate’s Market Beta is approximately 1.15). The average hedge fund long equity portfolio now carries approximately 15% more Market Exposure than the Russell 3000 ETF and approximately 20% more Market Exposure than the S&P 500 ETF:

Chart of the historical exposure of U.S. Hedge Fund Aggregate’s to the U.S. Market Factor

U.S. Hedge Fund Aggregate’s U.S. Market Factor Exposure History

This Market crowding has been costly and disruptive during the recent volatility. It also partially explains the failures of simple performance and skill metrics: When portfolios carry different Market Exposure than S&P500, calculating security selection return as performance relative to S&P500 is perilous. High Market Exposure is a general risk to the industry and a source of turmoil. Since there is no relationship between Market Exposure of HF Aggregate and subsequent Market Factor return, Market Factor crowding is not a predictive indicator of future performance:

Chart of the correlation between the exposure of U.S. Hedge Fund Aggregate’s to the U.S. Market Factor and U.S. Market Factor’s return

U.S. Hedge Fund Aggregate’s U.S. Market Factor Exposure History and Factor Return

Hedge Fund Bond Factor (Interest Rate) Crowding

We showed in an earlier piece that Bond (Interest Rate) Factor exposure is one of the top drivers of hedge fund long equity risk and performance. This bond risk is a natural consequence of hedge funds’ fondness for “cheap call options.” These are often levered companies with significant bond exposure: the companies’ creditors are long bonds; the companies (and their equity owners) are economically short them.

This short Bond Factor (long Interest Rate) exposure is now near record levels and is the second most important source of HF Aggregate’s Factor Crowding:

Chart of the historical exposure of U.S. Hedge Fund Aggregate’s to the U.S. Bond Factor

U.S. Hedge Fund Aggregate’s U.S. Bond Factor Exposure History

As with Market Factor, Bond Factor Exposure is a general risk to the industry. There is no relationship between Bond Exposure of HF Aggregate and subsequent Bond Factor return:

Chart of the correlation between the exposure of U.S. Hedge Fund Aggregate’s to the U.S. Bond Factor and U.S. Bond Factor’s return

U.S. Hedge Fund Aggregate’s U.S. Bond Factor Exposure History and Factor Return

Hedge Fund Residual (Idiosyncratic) Crowding

As of 3/31/2016, a  third of hedge fund crowding was due to residual (idiosyncratic, stock-specific) risk. Netflix (NFLX) is responsible for a quarter of it. The five most crowded stocks collectively account for half:

Chart of the main stock-specific bets and their cumulative contribution to the residual variance of U.S. Hedge Fund Aggregate Portfolio relative to U.S. Market on 3/31/2016

Stocks Contributing Most to Relative Residual Variance of U.S. Hedge Fund Aggregate in Q1 2016

These may be perfectly sound fundamental investments. However, they are sensitive to asset flows in and out of the industry. Given the sharp losses to residual hedge fund crowding in 2015-2016 and the tendency of liquidations to revert, crowding risk in these has diminished and the liquidation may even present long investment opportunities:

Symbol Name Relative Exposure Residual Volatility Share of Relative Residual Variance Share of Relative Total Variance
NFLX Netflix, Inc. 1.77 54.97 26.47 8.41
LNG Cheniere Energy, Inc. 1.60 32.94 7.73 2.46
CHTR Charter Communications 2.38 19.79 6.17 1.96
TWC Time Warner Cable Inc. 2.74 15.80 5.22 1.66
JD JD.com, Inc. Sponsored ADR 1.34 29.35 4.31 1.37
AGN Allergan plc 2.06 17.07 3.43 1.09
VRX Valeant Pharmaceuticals International 0.67 43.49 2.37 0.75
PCLN Priceline Group Inc 1.28 22.17 2.24 0.71
FLT FleetCor Technologies, Inc. 1.41 19.72 2.16 0.69
UAL United Continental Holdings, Inc. 0.92 28.15 1.86 0.59

(Relative exposures and relative variance contribution. All values are in %. Volatility is annualized.)

Though these stock-specific bets are important, they account for less than a third of the entire hedge fund crowding picture. Consequently, in the current environment of extreme systematic hedge fund crowding, allocators and fund followers should continue to pay more attention to factor risk. As hedge funds’ residual volatility continues to wane, allocators owning a broadly diversified portfolio of hedge funds are increasingly at risk of paying high active fees for a passive factor portfolio.

Summary

  • The main source of Q1 2016 hedge fund crowding, responsible for nearly half of relative long equity risk, was record U.S. Market exposure.
  • The second most important source of Q1 2016 hedge fund crowding was near-record short Bond (long interest rate) exposure.
  • Given high factor (systematic) hedge fund long equity crowding, analysis of crowding risks must focus on factor exposures, rather than individual positions.
The information herein is not represented or warranted to be accurate, correct, complete or timely. Past performance is no guarantee of future results. Copyright © 2012-2016, AlphaBetaWorks, a division of Alpha Beta Analytics, LLC. All rights reserved. Content may not be republished without express written consent.

Hedge Fund Clustering in Q4 2015

Crowding consists of large capital pools chasing related strategies. Within the hedge fund industry, long equity portfolios crowd into several clusters with similar systematic (factor) and idiosyncratic (residual) bets. This hedge fund clustering is the internal structure of crowding. We illustrate the large-scale hedge fund clustering and crowded bets within the largest cluster. Allocators and fund followers without a handle on this phenomenon may be investing in an undifferentiated portfolio prone to liquidation, or paying high active fees for consensus factor exposures.

Hedge Fund Crowding and Hedge Fund Clustering

Our articles on hedge fund crowding analyze the factor (systematic) and residual (idiosyncratic) exposures of HF Aggregate, which consists of the long equity holdings of all U.S. hedge fund portfolios tractable from regulatory filings. Most analyses of crowding overlook bets shared by fund groups within the aggregate. To explore this internal structure of hedge fun crowding, in 2014 AlphaBetaWorks pioneered research on hedge fund clustering. Here we update this analysis with Q4 2015 holdings data.

Hedge Fund Clusters

Note that simplistic analysis of holdings overlap fails to measure fund similarity. Since their variance is overwhelmingly systematic, two funds with no overlapping positions but similar factor exposures can track each other closely. To identify clusters of funds without these deficiencies, we analyze factor and residual exposures of every portfolio relative to every other portfolio using the AlphaBetaWorks’ Statistical Equity Risk Model, a proven tool for forecasting portfolio risk and future performance. For each portfolio pair we estimate the future relative volatility (tracking error). The lower the expected relative tracking error between two funds, the more similar they are to each other.

Once each hedge fund pair is analyzed – hundreds of thousands of factor-based risk analyses – we find funds with similar exposures and build clusters (related to phylogenic trees, or family trees) of funds. We use agglomerative hierarchical clustering with estimated future relative tracking error as the metric of differentiation or dissimilarity. The resulting clusters capture similarities of all analyzable U.S. hedge fund long equity portfolios:

Chart of hedge fund clustering for U.S. long equity portfolios in Q4 2015

Clusters of U.S. Hedge Funds’ Long Equity Portfolios in Q4 2015

The largest cluster contains approximately 40 funds. It and other large clusters warrant careful scrutiny by allocators: those invested in a portfolio of clustered funds may be paying high active fees for a handful of consensus factor and stock-specific bets.

The AQR-Adage Hedge Fund Cluster

The AQR-Adage Cluster, named after two of its large and similar members, has recently been the largest cluster of hedge funds’ long equity portfolios:

Chart of hedge fund clustering within the largest cluster of U.S. Hedge Funds’ Q4 2015 Long Equity Portfolios

The Largest Hedge Fund Long Equity Portfolio Cluster in Q4 2015

A flat diagram illustrates the distances (estimated future tracking errors) between its members:

Chart of the flat view of clustering within the AQR-Adage cluster of U.S. Hedge Funds’ Q4 2015 Long Equity Portfolios

The AQR-Adage Long Equity Portfolio Cluster in Q4 2015

This cluster’s aggregate portfolio is similar to the U.S. equity market. We estimate only 1.8% tracking error of the AQR-Adage Cluster relative to the Russell 3000 Index.

Source Volatility (ann. %) Share of Variance (%)
Factor 1.26 48.23
Residual 1.31 51.77
Total 1.82 100.00

Put differently, we expect this cluster’s aggregate annual long portfolio return to differ from the market by more than 1.8% only about a third of the time.

AQR-Adage Cluster’s Factor (Systematic) Crowding

Below are this cluster’s significant factor exposures (in red) relative to the Russell 3000’s exposures (in gray):

Chart of exposures to the risk factors contributing most to the risk of the Q4 2015 AQR-Adage hedge fund long equity portfolio cluster relative to the U.S. Market

Factor Exposures of the AQR-Adage Hedge Fund Cluster in Q4 2015

Market (high-beta) and Size (small-cap) are the primary sources of the relative factor risk:

Chart of contributions to the relative factor (systematic) variance of the risk factors contributing most to the risk of the Q4 2015 AQR-Adage hedge fund long equity portfolio cluster relative to the U.S. Market

Factors Contributing Most to Relative Variance of the AQR-Adage Hedge Fund Cluster in Q4 2015

Factor Relative Exposure Factor Volatility Share of Relative Factor Variance Share of Relative Total Variance
Market 5.31 12.46 38.20 18.42
Size -8.23 8.09 22.14 10.68
Oil Price 1.42 29.43 18.84 9.09
Value -3.90 12.91 11.29 5.44
Finance -6.56 5.08 11.05 5.33
Utilities -2.21 11.28 6.05 2.92
Communications -1.18 11.98 2.79 1.35
Health -1.57 7.22 -2.97 -1.43
FX 1.50 7.28 -3.29 -1.59
Energy -2.07 11.77 -4.56 -2.20

(Relative exposures and relative variance contribution. All values are in %. Volatility is annualized.)

AQR-Adage Cluster’s Factor Crowding Stress Tests

AQR-Adage Cluster’s Maximum Outperformance

Given the AQR-Adage Cluster’s macroeconomic positioning (Long Market, Short Finance, Value, and Size), it would experience its highest outperformance in an environment similar to the 1999-2000 dot-com boom:

Chart of the cumulative factor (systematic) return for the historical scenario that would generate the larger relative outperformance for the AQR-Adage Hedge Fund Cluster in Q4 2015

Historical Scenario that Would Generate the Highest Relative Performance for the AQR-Adage Hedge Fund Cluster in Q4 2015

Factor Return Portfolio Exposure Benchmark Exposure Relative Exposure Portfolio Return Benchmark Return Relative Return
Market 31.52 107.31 102.00 5.31 34.06 32.21 1.85
Finance -19.62 12.76 19.32 -6.56 -2.62 -3.95 1.33
Oil Price 128.16 0.42 -1.00 1.42 0.39 -0.93 1.32
Size -10.49 -9.11 -0.88 -8.23 0.96 0.09 0.87
Value -21.96 -4.05 -0.15 -3.90 0.90 0.03 0.87

AQR-Adage Cluster’s Maximum Underperformance

These exposures would deliver the AQR-Adage Cluster its highest underperformance in an environment similar to the 2000-2001 .com crash:

Chart of the cumulative factor (systematic) return for the historical scenario that would generate the larger relative underperformance for the AQR-Adage Hedge Fund Cluster in Q4 2015

Historical Scenario that Would Generate the Lowest Relative Performance for the AQR-Adage Hedge Fund Cluster in Q4 2015

Factor Return Portfolio Exposure Benchmark Exposure Relative Exposure Portfolio Return Benchmark Return Relative Return
Finance 47.97 12.76 19.32 -6.56 5.39 8.24 -2.85
Value 86.46 -4.05 -0.15 -3.90 -2.67 -0.10 -2.57
Utilities 52.32 0.98 3.19 -2.21 0.45 1.46 -1.01
Market -14.21 107.31 102.00 5.31 -15.30 -14.51 -0.79
Energy 33.72 2.47 4.54 -2.07 0.77 1.43 -0.65

AQR-Adage Cluster Residual (Idiosyncratic) Crowding

The stock-specific bets of the AQR-Adage Cluster have grown more crowded as the idiosyncratic volatility of several crowded longs spiked recently. Four stocks account for most of its relative residual risk:

Chart of contributions to the relative residual (idiosyncratic) variance of the stocks contributing most to the risk of the Q4 2015 AQR-Adage hedge fund long equity portfolio cluster relative to U.S. Market

Stocks Contributing Most to Relative Residual Variance of the AQR-Adage Hedge Fund Cluster in Q4 2015

Symbol Name Relative Exposure Residual Volatility Share of Relative Residual Variance Share of Relative Total Variance
TPIV TapImmune Inc. 0.41 125.70 20.11 9.21
NHLD National Holdings Corporation 0.75 68.38 20.05 9.18
PTRC Petro River Oil Corp. 0.22 151.46 8.05 3.69
LRAD LRAD Corporation 0.76 38.81 6.69 3.06
VRX Valeant Pharmaceuticals International, Inc. 0.51 43.72 3.82 1.75
JD JD.com, Inc. Sponsored ADR Class A 0.49 31.91 1.86 0.85
CHTR Charter Communications, Inc. Class A 0.75 20.31 1.76 0.81
IBKR Interactive Brokers Group, Inc. Class A 0.71 19.64 1.47 0.67
AAPL Apple Inc. -0.81 16.25 1.33 0.61
GNUS Genius Brands International, Inc. 0.12 103.74 1.21 0.56

(Relative exposures and relative variance contribution. All values are in %. Volatility is annualized.)

Idiosyncratic crowding is not the main problem with this cluster, since the expected idiosyncratic tracking error is low (around 1.3%). However, it is vital for fund followers, as it helps explain unexpected volatility in the most crowded names. In fact, several of the crowded names above have shown signs of mass liquidation. It is also worth noting that the crowded names’ from earlier in 2015 presaged subsequent disasters. Valeant Pharmaceuticals (VRX), Micron, Inc. (MU), and Cheniere Natural Gas (LNG) were all featured in our crowding work.

Passivity is a bigger problem still, since allocators to diversified portfolios of hedge funds within this cluster may be paying high fees for a few consensus bets.

Summary

  • An analysis of the underlying structure of hedge fund crowding reveals hedge fund clustering – groups of portfolios with similar bets.
  • The largest cluster’s factor herding is towards Market (high-beta), short Size (small-cap), and four stock-specific bets (TPIV, NHLD, PTRC, and LRAD).
  • Allocators and fund followers unaware of clustering may find themselves in a nearly passive factor portfolio and a handful of consensus stock-specific bets.

The information herein is not represented or warranted to be accurate, correct, complete or timely.
Past performance is no guarantee of future results.
Copyright © 2012-2016, 
AlphaBetaWorks, a division of Alpha Beta Analytics, LLC. All rights reserved.
Content may not be republished without express written consent.

Hedge Fund Crowding Update – Q4 2015

Most analyses of hedge fund crowding focus on their residual (idiosyncratic, stock-specific) bets. This is misguided, since over 85% of the monthly return variance for the majority of hedge fund long equity portfolios is due to factor (systematic) exposures, rather than individual stocks. Indeed, it is the exceptional factor crowding and the record market risk that have driven much of the industry’s recent misery (just as they have driven much of the earlier upswings). In Q4 2015, a single factor accounted for half of U.S. hedge funds’ relative long equity risk (tracking error). We survey all sources of hedge fund crowding at year-end 2015 and identify the market regimes that would generate the highest relative outperformance and underperformance for the crowded factor portfolio. These are the regimes that would most benefit or hurt hedge fund investors and followers.

Identifying Hedge Fund Crowding

This piece follows the approach of our earlier articles on crowding: We processed regulatory filings of over 1,000 hedge funds and created a position-weighted portfolio (HF Aggregate) consisting of all the tractable hedge fund long U.S. equity portfolios. We then analyzed HF Aggregate’s risk relative to U.S. Market using the AlphaBetaWorks Statistical Equity Risk Model – a proven system for performance forecasting. The top contributors to HF Aggregate’s relative risk are the most crowded hedge fund bets.

Hedge Fund Aggregate’s Risk

The Q4 2015 HF Aggregate had 3.7% estimated future tracking error relative to U.S. Market; over two thirds of this was due to factor (systematic) exposures:

Factor (systematic) and residual (idiosyncratic) components of hedge fund crowding, or U.S. Hedge Fund Aggregate’s variance relative to U.S. Market on 12/31/2015

Components of the Relative Risk for U.S. Hedge Fund Aggregate in Q4 2015

Source Volatility (ann. %) Share of Variance (%)
Factor 3.10 69.07
Residual 2.08 30.93
Total 3.73 100.00

Simplistic analysis of hedge fund crowding that lacks a capable risk model will miss these systematic exposures. Among its flows, this comparison of holdings will overlook funds with no position overlap but high future correlation due to similar factor exposures. Hence, this simplistic analysis of hedge fund crowding fosters dangerous complacency.

Hedge Fund Factor (Systematic) Crowding

Factor exposures drove nearly 70% of the relative risk of HF Aggregate at year-end 2015. Below are the principal factor exposures (in red) relative to U.S. Market’s exposures (in gray):

Chart of the factor exposures contributing most to hedge fund crowding, or the factor variance of U.S. Hedge Fund Aggregate Portfolio relative to U.S. Market on 12/31/2015

Significant Absolute and Relative Factor Exposures of U.S. Hedge Fund Aggregate in Q4 2015

Of these bets, Market (Beta) alone accounts for two thirds of the relative and half of the total factor risk, as illustrated below:

Chart of the main factors behind systematic hedge fund crowding and their cumulative contribution to the factor variance of U.S. Hedge Fund Aggregate Portfolio relative to U.S. Market on 12/31/2015

Factors Contributing Most to Relative Factor Variance of U.S. Hedge Fund Aggregate in Q4 2015

Factor Relative Exposure Factor Volatility Share of Relative Factor Variance Share of Relative Total Variance
Market 18.27 12.46 68.12 47.05
Oil Price 2.28 29.43 13.08 9.04
Bond Index -7.53 3.33 4.97 3.43
Utilities -3.10 11.28 4.77 3.30
Consumer -8.30 3.75 3.54 2.44
Energy -3.21 11.77 -2.96 -2.04
Health 4.79 7.22 2.54 1.75
Communications -1.67 11.98 1.91 1.32
Finance -6.89 5.08 1.68 1.16
Size -1.96 8.09 1.34 0.92

(Relative exposures and relative variance contribution. All values are in %. Volatility is annualized.)

Thus, the most important source of hedge fund crowding is not a stock or a group of stocks, but systematic exposure to the U.S. Market Factor. When nearly half of the industry’s risk comes from a single Factor, fixation on the individual crowded stocks is particularly dangerous.

The U.S. Market crowding alone explains much of the recent industry misery. In this era of systematic crowding, risk management with a robust and predictive factor model is particularly vital for managers’ and allocators’ survival.

Hedge Fund Factor Crowding Stress Tests

Hedge Fund Crowding Maximum Outperformance

Given Hedge Fund Aggregate’s bullish macroeconomic positioning (Long Market, Short Bonds/Long Interest Rates), it would experience its highest outperformance in an environment similar to the March-2009 rally. In this scenario, HF Aggregate’s factor portfolio would outperform by 20%:

Chart of the cumulative factor returns for the historical scenario that would generate the highest relative return for the 12/31/2015 U.S. Hedge Fund Aggregate Portfolio relative to U.S. Market

Historical Scenario that Would Generate the Highest Relative Performance for the Q4 2015 U.S. Hedge Fund Aggregate

The top contributors to this outperformance would be the following exposures:

Factor Return Portfolio Exposure Benchmark Exposure Relative Exposure Portfolio Return Benchmark Return Relative Return
Market 66.04 120.07 101.80 18.27 83.00 67.50 15.50
Oil Price 87.13 1.53 -0.75 2.28 1.05 -0.51 1.56
Bond Index -6.29 -4.92 2.61 -7.53 0.31 -0.17 0.48
Energy -12.54 1.61 4.82 -3.21 -0.20 -0.61 0.41
Communications -17.62 0.52 2.19 -1.67 -0.10 -0.41 0.31

Hedge Fund Crowding Maximum Underperformance

Given Hedge Fund Aggregate’s bullish macroeconomic positioning, combined with a long Technology and short Finance exposures, it would experience its highest underperformance in an environment similar to the 2000-2001 .com Crash. In this scenario, HF Aggregate’s factor portfolio would underperform by 8%:

Chart of the cumulative factor returns for the historical scenario that would generate the lowest relative return for the 12/31/2015 U.S. Hedge Fund Aggregate Portfolio relative to U.S. Market

Historical Scenario that Would Generate the Lowest Relative Performance for the Q4 2015 U.S. Hedge Fund Aggregate

The top contributors to this underperformance would be the following exposures:

Factor Return Portfolio Exposure Benchmark Exposure Relative Exposure Portfolio Return Benchmark Return Relative Return
Finance 47.97 12.48 19.36 -6.89 5.27 8.26 -2.99
Market -14.21 120.07 101.80 18.27 -17.22 -14.48 -2.74
Technology -36.73 23.75 20.14 3.62 -9.83 -8.38 -1.45
Utilities 52.32 0.22 3.31 -3.10 0.10 1.51 -1.42
Consumer 12.36 14.87 23.17 -8.30 1.82 2.85 -1.02

Hedge Fund Residual (Idiosyncratic) Crowding

A third of the year-end 2015 hedge fund crowding is due to residual (idiosyncratic, stock-specific) risk. Valeant Pharmaceuticals International (VRX) and Netflix (NFLX) are responsible for nearly half of it:

Chart of the main stock-specific sources of hedge fund crowding and their cumulative contribution to the residual variance of U.S. Hedge Fund Aggregate Portfolio relative to U.S. Market on 12/31/2015

Stocks Contributing Most to Relative Residual Variance of U.S. Hedge Fund Aggregate in Q4 2015

Though there may be sound individual reasons for these investments, they are vulnerable to brutal liquidation. Given the recent damage to hedge funds from herding, these crowded residual bets remain vulnerable:

Symbol Name Relative Exposure Residual Volatility Share of Relative Residual Variance Share of Relative Total Variance
VRX Valeant Pharmaceuticals International, Inc. 2.67 43.72 31.56 9.76
NFLX Netflix, Inc. 1.57 54.62 17.15 5.30
JD JD.com, Inc. Sponsored ADR Class A 1.60 31.91 6.05 1.87
LNG Cheniere Energy, Inc. 1.38 33.35 4.88 1.51
CHTR Charter Communications, Inc. Class A 1.79 20.31 3.08 0.95
TWC Time Warner Cable Inc. 1.85 16.14 2.06 0.64
AGN Allergan plc 1.83 14.62 1.66 0.51
FLT FleetCor Technologies, Inc. 1.18 19.61 1.23 0.38
PCLN Priceline Group Inc 1.12 20.10 1.18 0.36
MSFT Microsoft Corporation 1.54 14.13 1.10 0.34

(Relative exposures and relative variance contribution. All values are in %. Volatility is annualized.)

Though stock-specific bets remain important, allocators and fund followers should pay particular attention to their factor exposures in the current environment of extreme systematic hedge fund crowding. Many may be effectively invested in leveraged passive index fund portfolio, with the added insult of high fees. AlphaBetaWorks Analytics address all of these needs with the coverage of market-wide and sector-specific herding, plus aggregate factor exposures of funds and portfolios of funds.

Summary

  • The main source of Q4 2015 hedge fund crowding, responsible for nearly half of the relative long equity risk, was record U.S. Market exposure.
  • The main sources of Q4 2015 residual crowding were VRX and NFLX.
  • Given the high factor (systematic) crowding among hedge funds’ long equity portfolios, current analysis of crowding risks must focus on the factor exposures, rather than individual positions.
The information herein is not represented or warranted to be accurate, correct, complete or timely.
Past performance is no guarantee of future results.
Copyright © 2012-2016, AlphaBetaWorks, a division of Alpha Beta Analytics, LLC. All rights reserved.
Content may not be republished without express written consent.


Are Momentum ETFs Delivering Momentum Returns?

There is a large difference between momentum strategies in theory and in practice. Given that much of its model performance derives from illiquid securities and high turnover, the academic momentum factor is a theoretical ideal that is not directly investable. Consequently, real-world momentum products, such as momentum ETFs, are restricted to investable liquid securities and usually reduce the approximately 200% annual turnover of theoretical momentum portfolios. After these modifications, their idiosyncratic momentum returns mostly vanish.

We consider a popular momentum ETF and illustrate that its historical performance is almost entirely attributable to passive exposures to simple non-momentum factors, such as Market and Sectors. Investors may thus be able to achieve and even surpass the performance of popular momentum ETFs with transparent, passive, and potentially lower-cost portfolios of simpler funds.

Attributing the Performance of Momentum ETFs to Simpler Factors

We analyzed iShares MSCI USA Momentum Factor ETF (MTUM) using the AlphaBetaWorks Statistical Equity Risk Model – a proven tool for forecasting portfolio risk and performance. We estimated monthly positions from regulatory filings, retrieved positions’ factor (systematic) exposures, and aggregated these. This produced a series of monthly portfolio exposures to simple investable risk factors such as Market, Sector, and Size. The factor exposures at the end of Month 1 and factor returns during Month 2 are used to calculate factor returns during Month 2 and any residual (security-selection, idiosyncratic, stock-specific) returns un-attributable to factors.

There are only two ways for a fund to deviate from a passive portfolio: residual returns un-attributable to factors and factor timing returns due to variation in factor exposures over time. We define and measure both components below.

iShares MSCI USA Momentum Factor (MTUM): Performance Attribution

We used iShares MSCI USA Momentum Factor (MTUM) as an example of a practical implementation of a theoretical momentum portfolio. MTUM is a $1.1bil ETF that seeks to track an index of U.S. large- and mid-cap stocks with high momentum. The fund’s turnover, around 100% annually, is about half that of the theoretical momentum factor.

iShares MSCI USA Momentum Factor (MTUM): Factor Exposures

The following factors are responsible for most of the historical returns and variance of MTUM:

Chart of exposures to the risk factors contributing most to the historical performance of MSCI USA Momentum Factor (MTUM)

MSCI USA Momentum Factor (MTUM): Significant Historical Factor Exposures

Latest Mean Min. Max.
Market 88.44 84.12 65.46 96.03
Health 23.73 30.28 23.73 34.94
Consumer 74.02 32.53 13.10 74.06
Industrial 1.69 9.71 1.13 24.51
Size -10.47 -1.04 -11.09 7.67
Oil Price -2.90 -2.45 -4.94 -0.04
Technology 17.72 16.56 1.50 32.29
Value -4.86 -2.13 -8.00 5.20
Energy 0.00 1.86 0.00 4.12
Bond Index 6.51 1.08 -22.90 23.64

iShares MSCI USA Momentum Factor (MTUM): Active Return

To replicate MTUM with simple non-momentum factors, one can use a passive portfolio of these simple non-momentum factors with MTUM’s mean exposures as weights. This portfolio defined the Passive Return in the following chart. Active return, or αβReturn, is the performance in excess of this passive replicating portfolio. It is the active return due to residual stock performance and factor timing:

Chart of the cumulative historical active return from security selection and factor timing of MSCI USA Momentum Factor (MTUM)

MSCI USA Momentum Factor (MTUM): Cumulative Passive and Active Returns

MTUM’s performance closely tracks the passive replicating portfolio. Pearson’s correlation between Total Return and Passive Return is 0.96. Consequently, 93% of the variance of monthly returns is attributable to passive factor exposures, primarily to Market and Sector factors.

Once passive exposures to simpler factors have been removed, MTUM’s active return is negligible. Since MTUM’s launch, the cumulative return difference from such passive replicating portfolio has been approximately 1%:

2013 2014 2015 Total
Total Return 16.73 14.62 8.50 45.18
  Passive Return 16.06 16.48 4.55 41.34
  αβReturn 1.11 -2.46 2.54 1.12
    αReturn 3.91 0.05 0.29 4.27
    βReturn -2.71 -2.52 2.23 -3.05

This active return can be further decomposed into security selection (αReturn) and factor timing (βReturn). These active return components generated low volatility, around 1% annually, mostly offsetting each other as illustrated below:

iShares MSCI USA Momentum Factor (MTUM): Active Return from Security Selection

AlphaBetaWorks’ measure of residual security selection performance is αReturn – performance relative to a factor portfolio that matches the funds’ historical factor exposures. αReturn is the return a fund would have generated if markets had been flat. MTUM has generated approximately 4% cumulative αReturn, primarily in 2013, compared to roughly 1.5% decline for the average U.S. equity ETF:

Chart of the cumulative historical active return from security selection of MSCI USA Momentum Factor (MTUM)

MSCI USA Momentum Factor (MTUM): Cumulative Active Return from Security Selection

iShares MSCI USA Momentum Factor (MTUM): Active Return from Factor Timing

AlphaBetaWorks’ measure of factor timing performance is βReturn – performance due to variation in factor exposures. βReturn is the fund’s outperformance relative to a portfolio with the same mean, but constant, factor exposures as the fund. MTUM generates approximately -3% cumulative βReturn, compared to a roughly 1% decline for the average U.S. equity ETF:

Chart of the cumulative historical active return from factor timing of MSCI USA Momentum Factor (MTUM)

MSCI USA Momentum Factor (MTUM): Cumulative Active Return from Factor Timing

These low active returns are consistent with our earlier findings that many “smart beta” funds are merely high-beta and offer no value over portfolios of conventional dumb-beta funds. It is thus vital to test any new resident of the Factor Zoo to determine whether they are merely exotic breeds of its more boring residents.

Conclusion

  • Theoretical, or academic, momentum portfolios are not directly investable.
  • A popular momentum ETF, MSCI USA Momentum Factor (MTUM), did not deviate significantly from a passive portfolio of simpler non-momentum factors.
  • Investors may be able to achieve and surpass the performance of the popular momentum ETFs with transparent, passive, and potentially lower-cost portfolios of simpler index funds and ETFs.
The information herein is not represented or warranted to be accurate, correct, complete or timely.
Past performance is no guarantee of future results.
Copyright © 2012-2016, AlphaBetaWorks, a division of Alpha Beta Analytics, LLC. All rights reserved.
Content may not be republished without express written consent.

Hedge Fund Crowding Update – Q3 2015

Since crowded stocks are prone to mass liquidation, investors are typically most concerned with residual (idiosyncratic, stock-specific) hedge fund crowding. This overlooks the exceptional factor (systematic) crowding and the record market risk that have been driving recent industry performance. In Q3 2015, when a single factor and a single stock accounted for over half of the aggregate U.S. hedge fund long equity portfolio’s relative risk, hedge fund crowding became unprecedented.

Identifying Hedge Fund Crowding

This piece follows the approach of our earlier articles on crowding: We created a position-weighted portfolio (HF Aggregate) consisting of the common U.S. equity holdings of all tractable long hedge fund portfolios. We then analyzed HF Aggregate’s risk relative to U.S. Market using the AlphaBetaWorks Statistical Equity Risk Model. The top sources of HF Aggregate’s relative risk are the top sources of hedge fund crowding.

Hedge Fund Aggregate’s Risk

The Q3 2015 HF Aggregate had 3.9% estimated future tracking error relative to U.S. Market; factor (systematic) bets were its primary sources. The components of HF Aggregate’s relative risk were as follows:

Factor (systematic) and residual (idiosyncratic) components of the U.S. Hedge Fund Aggregate’s variance relative to U.S. Market

Components of the Relative Risk for U.S. Hedge Fund Aggregate

Source Volatility (ann. %) Share of Variance (%)
Factor 2.91 55.17
Residual 2.62 44.83
Total 3.91 100.00

A simplistic crowding analysis that does not rely on an effective risk model ignores systematic exposures of positions. Since portfolios with very different holdings can have matching factor exposures and can track each other closely, crowding is common even for portfolios with little overlap. Such simplistic analyses thus overlooks factor (systematic) exposures that are responsible for the majority of covariance among hedge funds.

Hedge Fund Factor (Systematic) Crowding

Factor exposures drove over half of the relative risk of HF Aggregate in Q3. Below are its principal factor exposures (in red) relative to U.S. Market’s exposures (in gray):

Chart of the factor exposures contributing most to the factor variance of U.S. Hedge Fund Aggregate Portfolio relative to U.S. Market on 9/30/2015

Factors Contributing Most to the Relative Risk for U.S. Hedge Fund Aggregate

Of these bets, Market (Beta) alone accounts for two thirds of the relative factor risk and over a third of the total risk. The top components of the 2.91% Factor Volatility in the first table are as follows:

Chart of the main factors and their cumulative contribution to the factor variance of U.S. Hedge Fund Aggregate Portfolio relative to U.S. Market on 9/30/2015

Factors Contributing Most to Relative Factor Variance of U.S. Hedge Fund Aggregate

Factor Relative Exposure Factor Volatility Share of Relative Factor Variance Share of Relative Total Variance
Market 17.26 12.28 65.18 35.96
Oil Price 2.93 28.89 20.11 11.10
Industrial 9.30 5.41 7.80 4.30
Utilities -3.32 11.05 4.49 2.48
Finance -7.76 5.18 3.36 1.85
Consumer -4.85 4.27 2.68 1.48
Health 5.68 6.82 2.31 1.27
Communications -1.74 11.77 1.64 0.91
Energy -2.10 12.68 -4.19 -2.31
FX 4.78 7.59 -5.95 -3.28

(Relative exposures and relative variance contribution. All values are in %. Volatility is annualized.)

The most important source of hedge fund crowding is not a stock or a set of stocks, but systematic exposure to a risk factor. Currently, fixation on stock-specific hedge fund bets is at best misguided and at worst dangerous for allocators. Risk management using a robust and predictive system, such as AlphaBetaWorks Risk Analytics, is currently key to controlling systematic fund crowding.

Hedge Fund U.S. Market Factor Exposure History

HF Aggregate’s 9/30/2015 market exposure was approximately 120% (its Market Beta was approximately 1.2). The hedge fund industry is thus taking approximately 20% more market risk than U.S. equities and approximately 25% more market risk than S&P 500. This record exposure has been costly for the industry and many individual funds during the 2015 turmoil, exacerbating volatility due to stock-specific crowding:

Chart of the historical exposure of U.S. Hedge Fund Aggregate Portfolio to the U.S. Market Factor

U.S. Hedge Fund Aggregate’s U.S. Market Factor Exposure History

HF Aggregate generally takes 10-20% more market risk than S&P500. Consequently, comparison of long hedge fund portfolio performance to market indices is misleading and assumption that outperformance relative to S&P500 is alpha is wrong. In a rising market, allocators who make these mistakes are likely to allocate to the most aggressive managers, rather than the most skilled. In flat or declining market, these mistakes become evident. Skill analytics that discriminate among the different levels of systematic risk are the solution.

Hedge Fund Residual (Idiosyncratic) Crowding

About 45% of recent hedge fund crowding is due to residual (idiosyncratic, stock-specific) risk. In part due to its spectacular volatility, a single position in Valeant Pharmaceuticals International (VRX) is now responsible for most of it:

Chart of the main stock-specific bets and their cumulative contribution to the residual variance of U.S. Hedge Fund Aggregate Portfolio relative to U.S. Market on 9/30/2015

Stocks Contributing Most to Relative Residual Variance of U.S. Hedge Fund Aggregate

Though individual crowded names may be wonderful investments, they have tended to underperform; they have seen consistent, and lately brutal, liquidation under the recent outflows:

Symbol Name Relative Exposure Residual Volatility Share of Relative Residual Variance Share of Relative Total Variance
VRX Valeant Pharmaceuticals International, Inc. 4.68 43.92 61.55 27.59
LNG Cheniere Energy, Inc. 1.80 40.12 7.57 3.39
NFLX Netflix, Inc. 1.10 56.17 5.59 2.51
CHTR Charter Communications, Inc. Class A 1.81 20.93 2.09 0.94
JD JD.com, Inc. Sponsored ADR Class A 1.31 28.91 2.08 0.93
TWC Time Warner Cable Inc. 1.86 16.57 1.39 0.62
AGN Allergan plc 1.67 15.39 0.96 0.43
FLT FleetCor Technologies, Inc. 1.20 19.53 0.80 0.36
PCLN Priceline Group Inc 1.11 20.74 0.78 0.35
PAGP Plains GP Holdings LP Class A 0.89 22.91 0.60 0.27

(Relative exposures and relative variance contribution. All values are in %. Volatility is annualized.)

Especially in the prevailing environment of portfolio liquidations, investors should not blindly follow star managers. Instead, any signs of crowding should trigger particularly thorough due-diligence. Allocators should be doubly concerned with crowding as they may be investing in a pool of undifferentiated bets and a leveraged factor portfolio. AlphaBetaWorks’ analytics address all of these needs with coverage of aggregate and sector-specific herding, predictive risk analytics, and detection of skills strongly predictive of future performance.

Summary

  • The main source of Q3 2015 hedge fund crowding is record Market (Beta) exposure, responsible for more than a third of the hedge fund industry’s relative risk.
  • The main source of Q3 2015 residual crowding is VRX.
  • In the current environment, analysis of hedge fund crowding must focus on the factor exposures driving systematic crowding, rather than individual positions.
The information herein is not represented or warranted to be accurate, correct, complete or timely.
Past performance is no guarantee of future results.
Copyright © 2012-2015, AlphaBetaWorks, a division of Alpha Beta Analytics, LLC. All rights reserved.
Content may not be republished without express written consent.

The Risk Impact of Valeant on Sequoia Fund

“This is your fund on drugs”

The Sequoia Fund’s (SEQUX) hefty sizing of Valeant Pharmaceuticals (VRX) dramatically changed the fund’s risk profile from historical norms. With the proper tools, allocators would have noticed this style drift back in Q2 2015 when Sequoia’s key factor exposures moved two to three times beyond historical averages. What’s more, allocators would have noticed a predicted volatility increase of 25% and a tracking-error increased 70%. Though this analysis would not have anticipated Valeant’s subsequent decline, it would have warned fund investors that Sequoia’s risk was out of the ordinary. 

Sequoia Fund’s Risk Profile

Below is a chart of Sequoia’s major factor exposures, spanning a ten year history through June 2015:

Chart of the exposures of Sequoia Fund (SEQUX) to the risk factors contributing most to its risk

Sequoia Fund (SEQUX) – Historical Factor Exposures

(Note that this analysis and our model do not include Valeant’s recent heightened volatility: we are using the AlphaBetaWorks Statistical Equity Risk Model as of 8/31/15 and SEQUX’s positions as of 6/30/2015. In short, we are looking at the world prior to Valeant’s subsequent downside volatility.)

Sequoia’s stock selection and allocation decisions result in certain factor bets such as market beta (“US and Canada”, above), other factors (Value, Size), and sectors (Consumer, Health). The red dots above represent factor exposures in a particular month, the red boxes represent two quartile deviations, and the diamonds denote current (i.e. 6/30/15) exposures. Several sectors/factors are circled for emphasis: they are current exposures as well as outliers versus history. More importantly, these outlying factor bets are the direct result of Sequoia’s large percentage ownership of Valeant.

The Impact of Valeant on Sequoia Fund’s Factor Exposures

We examined Sequoia Fund’s factor exposures with and without Valeant. We assumed that the pro forma Sequoia Fund without Valeant would have increased all other positions proportionally to make up for the void.  For example, we increase Sequoia’s next-largest position (TJX) from 7.3% to 10.9%, and so on for all longs for the pro forma non-Valeant Sequoia portfolio.

Below is a chart comparing the most salient factor exposures of Sequoia Fund, with and without Valeant:

Chart of the exposures of Sequoia Fund (SEQUX) to the risk factors contributing most to its risk including and excluding the position in Valeant (VRX)

Sequoia Fund (SEQUX) – Factor Exposures With and Without Valeant (VRX)

Valeant has had a significant impact on Sequoia’s factor exposures. The factors with the highest delta are the same as those highlighted as outliers on the first chart above.

This is significant in several ways. First, the large Valeant holding increases Sequoia Fund’s overall volatility by 25%. Second, Sequoia’s tracking error is increased by its Valeant holding by 70%. Sequoia Fund volatility estimates with and without Valeant are below:

The main components of Sequoia Fund’s (SEQUX’s) absolute and relative volatility and variance including the position in Valeant (VRX)

Sequoia Fund (SEQUX) with Valeant (VRX) – Absolute and Relative (to S&P 500) Estimated Risk

The main components of Sequoia Fund’s (SEQUX’s) absolute and relative volatility and variance excluding the position in Valeant (VRX)

Sequoia Fund (SEQUX) without Valeant (VRX) – Absolute and Relative (to S&P 500) Estimated Risk

Valeant increases Sequoia’s overall predicted volatility (tracking error) by 26% (from 9.73% to 12.31%, annualized – gold boxes). Likewise, Valeant increases Sequoia’s tracking error by 69% (from 5.19% to 8.76% – brown boxes). Increases in both Absolute and Relative volatility are due to the incremental Residual Risk contribution of Sequoia’s large Valeant holding (graphically shown by the larger blue boxes in the “with VRX” charts, in contrast to smaller blue boxes in the “without VRX” charts).

Conclusions

In the end, this analysis is not about Sequoia or VRX. It is a single example of decisions that could have been avoided by a portfolio manager or questions that would have arisen to an allocator with the proper risk toolkit. Sequoia’s decision to make Valeant an outsized position did not go unnoticed from a risk standpoint. Increases in factor exposures of two to three times outside historical bounds were an early warning. The impact of this was increased predicted volatility – both on an absolute basis and relative to the S&P 500. A framework that warns of a fund taking large factor and idiosyncratic bets aids greatly in avoiding negative surprises.

The information herein is not represented or warranted to be accurate, correct, complete or timely.
Past performance is no guarantee of future results.
Copyright © 2012-2015, AlphaBetaWorks, a division of Alpha Beta Analytics, LLC. All rights reserved.
Content may not be republished without express written consent.

Hedge Fund Energy Clustering: Q2 2015

Fund crowding consists of investment bets shared by groups of funds. Long hedge fund portfolios crowd into clusters with similar systematic (factor) and idiosyncratic (residual) bets. This clustering exists for the aggregate market and for individual sectors; it is the internal structure of hedge fund crowding.

This piece surveys hedge fund clustering in the energy sector and examines the largest hedge fund energy cluster in which:

  • Factor crowding is due to high exposures to two factors;
  • Residual crowding is primarily due to six stock-specific bets.

Allocators who are unaware of hedge fund clustering and exposures within these clusters may be paying active fees for high passive risk. These investors will suffer in periods of stress.

Hedge Fund Crowding and Hedge Fund Clustering

Several of our earlier articles on hedge fund crowding analyzed the factor (systematic) and residual (idiosyncratic) bets of HF Aggregate, which consists of the equity holdings of long U.S. hedge fund portfolios tractable from regulatory filings.

Analysis of the overall hedge fund crowding does not address bets shared by fund groups within the aggregate, nor does it consider the crowding within market sectors. To explore this internal structure of hedge fun crowding we pioneered the study of hedge fund clustering. Our 2014 work proved predictive and invaluable to allocators. This piece dives deeper, focusing on hedge fund clustering in the energy sector in Q2 2015.

Hedge Fund Energy Clusters

To explore hedge fund energy clustering we analyze long energy sector portfolios of all hedge funds that are analyzable using regulatory filings. We then exclude funds with insignificant energy holdings. We use the AlphaBetaWorks Statistical Equity Risk Model, a proven tool for forecasting portfolio risk and performance. For each portfolio pair we estimate the future relative volatility (tracking error). The lower the expected relative tracking error between funds, the more similar they are to each other.

Once each hedge fund pair is analyzed we identify groups of funds with like exposures and build clusters (similar to phylogenic trees, or family trees) of the funds’ long portfolios. We use agglomerative hierarchical clustering with estimated future relative tracking error as the metric of differentiation or dissimilarity:

Chart of clustering of U.S. Hedge Funds’ Q2 2015 Long Equity Energy Sector Portfolios

Clusters of U.S. Hedge Funds’ Long Energy Sector Equity Portfolios: Q2 2015

The largest hedge fund energy sector cluster contains approximately 20 funds. Its members share similar systematic and idiosyncratic energy bets that we will now analyze in detail.

The Gateway-San Francisco Sentry Energy Cluster

The largest cluster is the Gateway-San Francisco Sentry Cluster, named after two of its large members with similar long energy bets: Gateway Investment Advisers LLC and San Francisco Sentry Investment Group:

Chart of clustering within the largest cluster of U.S. Hedge Funds’ Q2 2015 Long Equity Energy Sector Portfolios

The Largest Hedge Fund Long Energy Equity Portfolio Cluster: Q2 2015

A flat diagram of the cluster better illustrates the distances (estimated future tracking errors) among its members:

Chart of the flat view of the chart of clustering within the Gateway-San Francisco Sentry cluster of U.S. Hedge Funds’ Q2 2015 Long Energy Equity Portfolios

Flat View of the Gateway-San Francisco Sentry Long Energy Equity Portfolio Cluster: Q2 2015

About two thirds of this cluster’s risk relative to the (Market) Energy Aggregate (a capitalization-weighted portfolio of all U.S. energy stocks) comes from factor exposures:

Source Volatility (%) Share of Variance (%)
Factor 4.08 66.93
Residual 2.87 33.07
Total 4.99 100.00

We expect this cluster’s aggregate annual return to differ from the Energy Aggregate’s annual return by more than 5.0% only about a third of the time. We expect its factor (systematic) return to differ from the Energy Aggregate by more than 4.1% about a third of the time. In other words, this cluster will stand out from the Market Energy Portfolio little. When it does, this will be primarily due to high factor (systematic) risk that investors can purchase with cheap passive instruments. In fact, we show below that the cluster largely turns out to be a 1.2x levered version of the Market Energy Aggregate.

Gateway-San Francisco Sentry Energy Cluster’s Factor (Systematic) Crowding

Below are this cluster’s significant factor exposures (in red) relative to the Energy Aggregate (in gray):

Chart of exposures to the risk factors contributing most to the risk of the Gateway-San Francisco Sentry hedge fund long energy sector equity portfolio cluster relative to the U.S. Energy Sector Market Aggregate

Factor Exposures of the Gateway-San Francisco Sentry Energy Portfolio Cluster

Market (high market beta) and Energy (high energy sector beta) exposures are responsible for almost 90% of this cluster’s relative factor risk:

Chart of contributions to the relative factor (systematic) variance of the risk factors contributing most to the risk of the Gateway-San Francisco Sentry hedge fund long energy sector equity portfolio cluster relative to the U.S. Energy Sector Market Aggregate

Factors Contributing Most to Relative Variance of the Gateway-San Francisco Sentry Energy Portfolio Cluster

Factor Portfolio Relative Exposure (%) Factor Volatility (%) Portfolio Relative Factor Variance (%²) Share of Total Factor Variance (%)
Energy 18.56 12.63 7.83 47.01
Market 20.55 11.16 6.77 40.63
Oil Price 2.31 31.38 2.33 13.98
FX -3.54 7.71 0.76 4.58
Value 5.97 13.45 0.70 4.19
Size 2.63 8.00 -0.18 -1.06
Bond Index 23.48 3.37 -1.55 -9.32
Other Factors 0.00 0.00
Total 16.66 100.00

Funds in the cluster are currently taking and have tended to take 10-20% more sector risk and market risk than the Energy Aggregate. This is significant crowding towards higher systematic risk: The cluster will outperform when market and energy sector returns are positive simply due to high factor exposures. It will suffer in periods of stress.

Gateway-San Francisco Sentry Energy Cluster’s Residual (Idiosyncratic) Crowding

Six stocks in the Gateway-San Francisco Sentry Portfolio Cluster are responsible for over half of the relative residual risk. This crowding away from the majors (XOM and CVX) with low systematic risk and towards higher-risk independents helps explain high factor exposures:

Chart of contributions to the relative residual (idiosyncratic) variance of the stocks contributing most to the risk of the Gateway-San Francisco Sentry hedge fund long energy sector equity portfolio cluster relative to the U.S. Energy Sector Market Aggregate

Stocks Contributing Most to Relative Residual Variance of the Gateway-San Francisco Sentry Energy Portfolio Cluster

Symbol Name Relative Exposure (%) Residual Volatility (%) Portfolio Relative Residual Variance (%²) Share of Total Residual Variance (%)
XOM  Exxon Mobil Corporation -14.52 14.45 1.31 15.93
WLB  Westmoreland Coal Company 2.21 48.07 0.72 8.78
CHK  Chesapeake Energy Corporation 3.50 37.10 0.67 8.10
TSO  Tesoro Corporation 2.92 36.16 0.61 7.41
NBL  Noble Energy Inc. 4.54 27.04 0.48 5.81
SXCP  SunCoke Energy Partners LP 2.86 25.72 0.37 4.47
SXC  SunCoke Energy Inc. 2.60 36.02 0.37 4.46
VLO  Valero Energy Corporation -2.27 33.28 0.36 4.35
APC  Anadarko Petroleum Corporation 3.64 26.63 0.32 3.87
HFC  HollyFrontier Corporation 2.09 34.08 0.31 3.80
BBG  Bill Barrett Corporation 1.65 45.92 0.28 3.39
AR  Antero Resources Corporation 2.71 33.79 0.26 3.17
CVX  Chevron Corporation -6.39 17.84 0.26 3.14
OGZPY  Public Joint-Stock Company Gazprom 1.97 33.89 0.20 2.44
WPZ  Williams Partners L.P. -2.24 21.12 0.18 2.16
CVI  CVR Energy Inc. 1.14 41.06 0.15 1.84
AHGP  Alliance Holdings GP L.P. 2.07 21.94 0.15 1.76
EOG  EOG Resources Inc. -2.09 25.87 0.14 1.72
COP  ConocoPhillips -3.19 21.17 0.13 1.60
FANG  Diamondback Energy Inc. 1.45 35.29 0.09 1.07
 Other Positions -4.67 0.88 10.73
Total 8.23 100

Idiosyncratic crowding is not the main problem for investors in the cluster – systematic crowding into higher factor exposures is a bigger challenge: Allocators are at risk of paying high fees for mostly passive factor portfolios with high energy and market exposures.

Summary

  • An analysis of the underlying structure of hedge fund crowding reveals hedge fund clustering – groups of portfolios with similar bets.
  • Hedge fund clustering exists across aggregate and sector-specific portfolios.
  • The largest hedge fund energy cluster’s factor herding is towards high Market (high market beta) and high Energy (high energy sector beta) exposures.
  • This cluster’s residual herding is away from XOM and towards WLB, CHK, TSO, NBL, and SXCP.
  • Allocators unaware of their funds’ clustering may be exposed to unexpectedly high systematic risk due to factor crowding, costly in periods of stress.
The information herein is not represented or warranted to be accurate, correct, complete or timely.
Past performance is no guarantee of future results.
Copyright © 2012-2015, 
AlphaBetaWorks, a division of Alpha Beta Analytics, LLC. All rights reserved.
Content may not be republished without express written consent.


Hedge Fund Clustering: Q2 2015 Update

Fund crowding consists of investment bets shared by groups of funds – large pools of capital chasing similar strategies. Within the hedge fund industry, long equity portfolios crowd into several clusters with similar systematic (factor) and idiosyncratic (residual) bets. This hedge fund clustering is the internal structure of hedge fund crowding.

This piece illustrates the large-scale hedge fund clustering and examines the largest hedge fund cluster in which:

  • Factor crowding is due to two factors;
  • Residual crowding is moderate and four stock-specific bets stand out.

Allocators who are unaware of hedge fund clustering and hedge fund crowding may be invested in an undifferentiated portfolio, paying active fees for passive factor exposure.

Hedge Fund Crowding and Hedge Fund Clustering

Several of our earlier articles on hedge fund crowding analyzed the factor (systematic) and residual (idiosyncratic) bets of HF Aggregate, which consists of the popular equity holdings of all long U.S. hedge fund portfolios tractable from regulatory filings.

Analysis of overall industry crowding does not address bets shared by fund groups within the aggregate. To explore this internal structure of hedge fun crowding – clusters of funds with shared systematic (factor) and idiosyncratic (residual) bets – in 2014 we released pioneering research on hedge fund clustering. The 2014 work proved predictive and invaluable to allocators. This piece updates the analysis of hedge fund clustering with Q2 2015 holdings data.

Hedge Fund Clusters

To explore hedge fund clustering we analyze long portfolios of every pair of hedge funds analyzable using regulatory filings using the AlphaBetaWorks’ Statistical Equity Risk Model, a proven tool for forecasting portfolio risk and future performance. For each portfolio pair we estimate the future relative volatility (tracking error). The lower the expected relative tracking error between two funds, the more similar they are to each other.

Once each hedge fund pair is analyzed – hundreds of thousands of factor-based risk analyses – we identify groups of funds with similar factor and residual exposures and build clusters (similar to phylogenic trees, or family trees) of the funds’ long portfolios. We use agglomerative hierarchical clustering with estimated future relative tracking error as the metric of differentiation or dissimilarity. The result is a picture of clustering among all analyzable U.S. hedge funds’ long portfolios:

Chart of clustering of U.S. Hedge Funds’ Q2 2015 Long Equity Portfolios

Clusters of U.S. Hedge Funds’ Long Equity Portfolios: Q2 2015

The largest cluster contains approximately 50 funds. A number of portfolios had exposures that were so similar, we expect their relative annual volatility to be under 3% – their annual returns should differ from one another by less than 3% about two thirds of the time.

This is critical for allocators: if they are invested in clustered funds, they may be paying high active fees for a handful of passive factor bets and consensus stock picks.

The AQR-Adage Hedge Fund Cluster

The largest cluster is currently the AQR-Adage Cluster, named after two of its large members with similar long exposures:

Chart of clustering within the largest cluster of U.S. Hedge Funds’ Q2 2015 Long Equity Portfolios

The Largest Hedge Fund Long Equity Portfolio Cluster: Q2 2015

A flat diagram of the cluster better illustrates the distances (estimated future tracking errors) between its members:

Chart of the flat view of the chart of clustering within the AQR-Adage cluster of U.S. Hedge Funds’ Q2 2015 Long Equity Portfolios

Flat View of the AQR-Adage Long Equity Portfolio Cluster: Q2 2015

In aggregate, this cluster’s risk is very close to that of the U.S. equity market. We estimate the AQR-Adage Cluster’s expected tracking error relative to the Russell 3000 Index at 1.4%.

Source

Volatility (%)

Share of Variance (%)

Factor

0.97

48.18

Residual

1.01

51.82

Total

1.40

100.00

Put differently, we expect this cluster’s aggregate long portfolio return to differ from the market by more than 1.4% only about a third of the time.

AQR-Adage Cluster Factor (Systematic) Crowding

Below are this cluster’s significant factor exposures (in red) relative to the Russell 3000’s exposures (in gray):

Chart of exposures to the risk factors contributing most to the risk of the AQR-Adage hedge fund long equity portfolio cluster relative to the U.S. Market

Factor Exposures of the AQR-Adage Hedge Fund Cluster: Q2 2015

Market (high-beta) and Size (small-cap) exposures are responsible for most of this cluster’s relative factor risk:

Chart of contributions to the relative factor (systematic) variance of the risk factors contributing most to the risk of the AQR-Adage hedge fund long equity portfolio cluster relative to the U.S. Market

Factors Contributing Most to Relative Variance of the AQR-Adage Hedge Fund Cluster: Q2 2015

Factor

Relative Exposure (%)

Portfolio Variance (%²)

Share of Systematic Variance (%)

Market

5.18

0.44

46.48

Size

-4.65

0.16

16.46

Oil Price

0.90

0.15

15.38

Finance

-5.61

0.12

12.19

Utilities

-2.58

0.10

10.29

Other Factors

-0.03

-0.80

Total

0.94

100.00

AQR-Adage Cluster Residual (Idiosyncratic) Crowding

There is less residual crowding in the AQR-Adage Cluster than in HF Aggregate. For HF Aggregate, just three stocks were responsible for over half of the relative residual risk in Q2 2015. By contrast, in the AQR-Adage Cluster, four stocks are responsible for approximately a quarter of the relative residual risk:

Chart of contributions to the relative residual (idiosyncratic) variance of the stocks contributing most to the risk of the AQR-Adage hedge fund long equity portfolio cluster relative to the U.S. Market

Stocks Contributing Most to Relative Residual Variance of the AQR-Adage Hedge Fund Cluster: Q2 2015

Symbol Name

Exposure (%)

Share of Idiosyncratic Variance (%)

AAPL Apple Inc.

-1.67

8.34

CHTR Charter Communications, Inc. Class A

1.09

5.97

FOLD Amicus Therapeutics, Inc.

0.35

5.60

SBAC SBA Communications Corporation

1.40

3.57

PCRX Pacira Pharmaceuticals, Inc.

0.37

2.56

LBTYK Liberty Global Plc Class C

1.08

2.47

SQBG Sequential Brands Group, Inc.

0.09

2.16

BAC Bank of America Corporation

-0.73

1.71

VRX Valeant Pharmaceuticals International, Inc.

0.50

1.66

LVLT Level 3 Communications, Inc.

0.41

1.45

Crowding within the AQR-Adage Cluster may not affect AAPL, CHTR, FOLD, and SBAC. However, these consensus bets will be the key contributors to the active returns of the AQR-Adage Cluster and many members. These stocks will also be the key drivers of some allocators’ idiosyncratic performance.

Idiosyncratic crowding is not the main problem with the cluster, since the expected idiosyncratic tracking error is low. Passivity is a bigger problem: Allocators to diversified portfolios of hedge funds within this cluster may be paying high fees for what’s effectively an index fund of passive factor bets. Closet indexing may be practiced by 70% of “active” U.S. mutual fund capital, but the high fees charged by hedge funds make fund differentiation especially important.

Summary

  • An analysis of the underlying structure of hedge fund crowding reveals hedge fund clustering – groups of portfolios with similar bets.
  • The largest hedge fund cluster consists of approximately 50 funds with shared factor and residual exposures.
  • The largest cluster’s factor herding is towards Market (high-beta) and short Size (small-cap) exposures.
  • This cluster’s residual herding is away from AAPL and towards CHTR, FOLD, and SBAC.
  • Allocators unaware of the clustering of their funds may be paying active fees for an effectively passive factor portfolio.
The information herein is not represented or warranted to be accurate, correct, complete or timely.
Past performance is no guarantee of future results.
Copyright © 2012-2015, 
AlphaBetaWorks, a division of Alpha Beta Analytics, LLC. All rights reserved.
Content may not be republished without express written consent.

Hedge Fund Crowding Update – Q2 2015

Hedge funds share a few bets. These crowded systematic and idiosyncratic exposures are the main sources of the industry’s relative performance and of many firms’ returns. Two factors and three stocks were behind most herding of hedge fund long U.S. equity positions in Q2 2015.

Investors should treat consensus ideas with caution: Crowded stocks are prone to mass liquidation. Crowded hedge fund bets tend to do poorly in most sectors, though there are some exceptions.

Identifying Hedge Fund Crowding

This piece follows the approach of our earlier articles on crowding: We created a position-weighted portfolio (HF Aggregate) consisting of the popular U.S. equity holdings of all long hedge fund portfolios tractable from regulatory filings. We then analyzed HF Aggregate’s risk relative to U.S. Market Aggregate (similar to the Russell 3000 index) using AlphaBetaWorks’ Statistical Equity Risk Model to identify sources of crowding.

Hedge Fund Aggregate’s Risk

The Q2 2015 HF Aggregate had 3.2% estimated future tracking error relative to U.S. Market. Factor (systematic) bets were the primary source of risk and systematic crowding increased slightly from prior quarters:

The components of HF Aggregate’s relative risk on 6/30/2015 were the following:

 Source Volatility (%) Share of Variance (%)
Factor 2.46 60.01
Residual 2.01 39.99
Total 3.17 100.00

Because of the close relationship between active risk and active performance, the low estimated future volatility (tracking error) indicates that the long book of a diversified portfolio of hedge funds will behave similarly to a passive factor portfolio. Even if its active bets pay off, HF Aggregate will have a hard time earning a typical fee. Consequently, the long portion of highly diversified hedge fund portfolios will struggle to outperform a passive alternative.

Hedge Fund Factor (Systematic) Crowding

Below are HF Aggregate’s principal factor exposures (in red) relative to U.S. Market’s (in gray) as of 6/30/2015:

Chart of the factor exposures contributing most to the factor variance of Hedge Fund Aggregate Portfolio relative to Market on 6/30/2015

Factor Exposures Contributing Most to the Relative Risk for U.S. Hedge Fund Aggregate

Of these bets, Market (Beta) and Oil are responsible for 90% of the relative factor risk. These are the components of the 2.46% Factor Volatility in the first table:

Chart of the main factors and their cumulative contribution to the factor variance of Hedge Fund Aggregate Portfolio relative to Market on 6/30/2015

Factors Contributing Most to Relative Factor Variance of U.S. Hedge Fund Aggregate

Factor Relative Exposure (%) Portfolio Variance (%²) Share of Systematic Variance (%)
Market 15.76 3.68 60.91
Oil Price 2.93 1.75 28.94
Industrial 9.72 0.53 8.72
Finance -8.36 0.46 7.58
Utilities -2.78 0.25 4.13
Other Factors -0.62 -10.28
Total 6.04 100.00

Exposures to the three main factor bets are near 10-year highs.

Hedge Fund U.S. Market Factor Exposure History

HF Aggregate’s market exposure is approximately 115% (its Market Beta is approximately 1.15). Hedge fund’s long books are taking approximately 15% more market risk than U.S. equities and approximately 20% more market risk than S&P 500. This bet has proven costly in August of 2015:

Chart of the historical exposure of Hedge Fund Aggregate Portfolio to the U.S. Market Factor

U.S. Hedge Fund Aggregate’s U.S. Market Factor Exposure History

Also note that long hedge fund portfolios consistently take 5-15% more market risk than S&P500 and other broad benchmarks. This is why simple comparison of long hedge fund portfolio performance to market indices is misleading.

Hedge Fund Oil Price Exposure History

HF Aggregate’s oil exposure, near 3%, is also close to the 10-year highs last reached in 2009:

Chart of the historical exposure of Hedge Fund Aggregate Portfolio to the Oil Price Factor

U.S. Hedge Fund Aggregate’s Oil Factor Exposure History

As oil prices collapsed in 2014, hedge funds rapidly boosted oil exposure. This contrarian bet is a weak bullish indicator for the commodity.

Hedge Fund Industrial Factor Exposure History

HF Aggregate’s industrials factor exposure remained near the all-time high:

Chart of the historical exposure of Hedge Fund Aggregate Portfolio to the Industrial Factor

U.S. Hedge Fund Aggregate’s Industrial Factor Exposure History

This has been a losing contrarian bet since 2014 and it is a weak bearish indicator for the sector.

Hedge Fund Residual (Idiosyncratic) Crowding

About 40% of hedge fund crowding is due to residual (idiosyncratic, stock-specific) risk. Just three names are responsible for over half of it:

Chart of the main stock-specific bets and their cumulative contribution to the residual variance of Hedge Fund Aggregate Portfolio relative to Market on 6/30/2015

Stocks Contributing Most to Relative Residual Variance of U.S. Hedge Fund Aggregate

These stocks will be primary drivers of HF Aggregate’s and of the most crowded firms’ stock-specific performance. Investors should be ready for seemingly inexplicable volatility due to portfolio liquidation and rebalancing. Though individual crowded names may be wonderful investments, they have tended to underperform:

Symbol Name Exposure (%) Share of Idiosyncratic Variance (%)
VRX Valeant Pharmaceuticals International, Inc. 4.78 36.25
LNG Cheniere Energy, Inc. 1.58 10.53
JD JD.com, Inc. Sponsored ADR Class A 1.59 4.60
NFLX Netflix, Inc. 0.74 4.55
SUNE SunEdison, Inc. 0.92 4.03
CHTR Charter Communications, Inc. Class A 1.55 3.04
PCLN Priceline Group Inc 1.36 2.37
EBAY eBay Inc. 1.47 1.58
FLT FleetCor Technologies, Inc. 1.10 1.17
TWC Time Warner Cable Inc. 1.27 1.17

Investors drawn to these names should not use hedge fund ownership as a plus. Instead, this ownership should trigger particularly thorough due-diligence. Any company slip-ups will be magnified as impatient investors stampede out of positions.

Fund allocators should also pay attention to crowding: Historically, consensus bets have done worse than a passive portfolio with the same risk. Investing in crowded books is investing in a pool of undifferentiated bets destined to disappoint.

AlphaBetaWorks’ analytics identify hedge fund herding in each equity sector. Our fund analytics measure hedge fund differentiation and identify specific skills in each sector that are strongly predictive of future performance.

Summary

  • There is both factor (systematic/market) and residual (idiosyncratic/security-specific) crowding of hedge funds’ long U.S. equity portfolios.
  • Hedge fund crowding is approximately 60% systematic and 40% idiosyncratic.
  • The main sources of systematic crowding are Market (Beta) and Oil.
  • The main sources of idiosyncratic crowding are VRX, LNG, JD, NFLX, and SUNE.
  • The crowded hedge fund portfolio has historically underperformed its passive alternative – allocators and fund followers should pay close attention to these consensus bets.
The information herein is not represented or warranted to be accurate, correct, complete or timely.
Past performance is no guarantee of future results.
Copyright © 2012-2015, AlphaBetaWorks, a division of Alpha Beta Analytics, LLC. All rights reserved.
Content may not be republished without express written consent.