Tag Archives: active return

The Predictive Power of Active Share

Active Share is a popular metric that purports to measure portfolio activity. Though Active Share’s fragility and ease of manipulation are increasingly well-understood, there has been no research on its predictive power. This paper quantifies the predictive power of Active Share and finds that, though Active Share is a statistically significant predictor of the performance difference between portfolio and benchmark (there is a relationship between Active Share and how active a fund is relative to a given benchmark), it is a weak one. The relationship explains only about 5% of the variation in activity across U.S. equity mutual funds. The predictive power of Active Share is a small fraction of that achieved with robust and predictive equity risk models.

The Breakdown of Active Share

Active Share — the absolute percentage difference between portfolio and benchmark holdings – is a common metric of fund activity. The flaws of this measure are evident from some simple examples:

  • If a fund with S&P 500 benchmark buys SPXL (S&P 500 Bull 3x ETF), it becomes more passive and more similar to its benchmark, yet its Active Share increases.
  • If a fund uses the S&P 500 as its benchmark but indexes Russell 2000, it is passive, yet its Active Share is 100%.
  • If a fund differs from a benchmark by a single 5% position with 20% residual (idiosyncratic, stock-specific) volatility, and another fund differs from the benchmark by a single 10% position with 5% residual volatility, the second fund is less active, yet it has a higher Active Share.
  • If a fund holds a secondary listing of a benchmark holding that tracks the primary holding exactly, it becomes no more active, yet its Active Share increases.

Given the flows above, the evidence that Active Share funds that outperform may merely index higher-risk benchmarks is unsurprising.

Measuring Active Management

A common defense is that these criticisms are pathological or esoteric, and unrepresentative of the actual portfolios. Such defense asserts that Active Share measures active management of real-world portfolios.

Astonishingly, we have not seen a single paper assess whether Active Share has any effectiveness in doing what it is supposed to do – identify which funds are more and which are less active. This paper provides such an assessment.

We consider two metrics of fund activity: Tracking Error and monthly active returns (measured as Mean Absolute Difference between portfolio and benchmark returns). Both these metrics measure how different the portfolios are in practice. Whether Active Share measures actual fund activity depends on whether it can differentiate among more and less active funds. 

The study dataset comprises portfolio histories of approximately 3,000 U.S. equity mutual funds that are analyzable from regulatory filings. The funds all had 2-10 years of history. Our study uses the bootstrapping statistical technique – we select 10,000 samples and perform the following steps for each sample:

  • Select a random fund F and a random date D.
  • Calculate Active Share of F to the S&P 500 ETF (SPY) at D.
  • Keep only those samples with Active Share between 0 and 0.75. This filter ensures that SPY may be an appropriate benchmark, and excludes small- and mid-capitalization funds that share no holdings with SPY. Such funds would all collapse into a single point with Active Share of 100, impairing statistical analysis.
  • Measure the activity of F for the following 12 months (period D to D + 12 months). We determine how active a fund is relative to a benchmark by quantifying how similar its performance is to that of the benchmark.

After the above steps, we have 10,000 observations of fund activity as estimated by Active Share versus the funds’ actual activity for the subsequent 12 months.

The Predictive Power of Active Share for U.S. Equity Mutual Funds

The following results quantify the predictive power of Active Share to differentiate among more and less active U.S. equity mutual funds. For perspective, we also include results on the predictive power of robust equity risk models. These results illustrate the relative weakness of Active Share as a measure of fund activity. They also indicate that, far from mitigating legal risk by reliance upon a claimed “best practice,” the use of Active Share to detect closet indexing may instead create legal risk.

The Predictive Power of Active Share to Forecast Future Tracking Error

Although Active Share is a statistically significant metric of fund activity, it is a weak one. Active Share predicts only about 5% of the variation in tracking error across mutual funds:
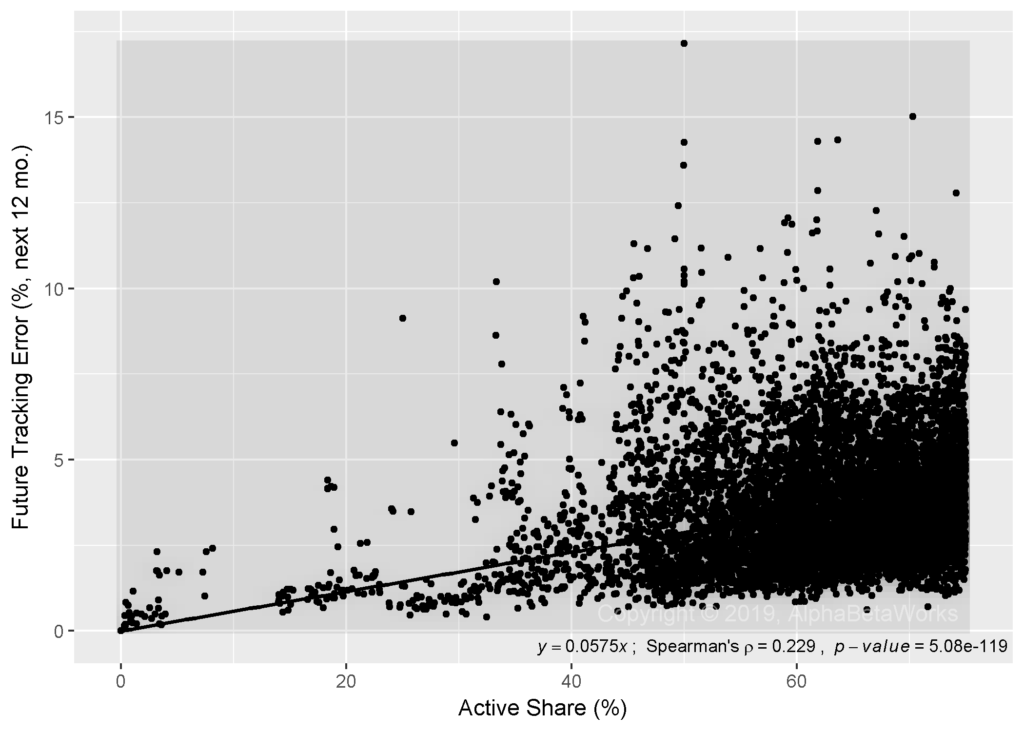
Chart of the predictive power of Active Share to forecast future tracking error of U.S. equity mutual funds illustrating a weak predictive power.
U.S. Equity Mutual Fund Portfolios: The Predictive Power of Active Share to Forecast Future Tracking Error
Residual standard error: 1.702 on 9998 degrees of freedom
Multiple R-squared:  0.05163,   Adjusted R-squared:  0.05154
F-statistic: 544.3 on 1 and 9998 DF,  p-value: < 2.2e-16

The distributions clearly suffer from heteroscedasticity, which can invalidate tests of statistical significance. To control for this, we also consider the relationship between the rankings of Active Share and future tracking errors. This alternative approach does not affect the results:
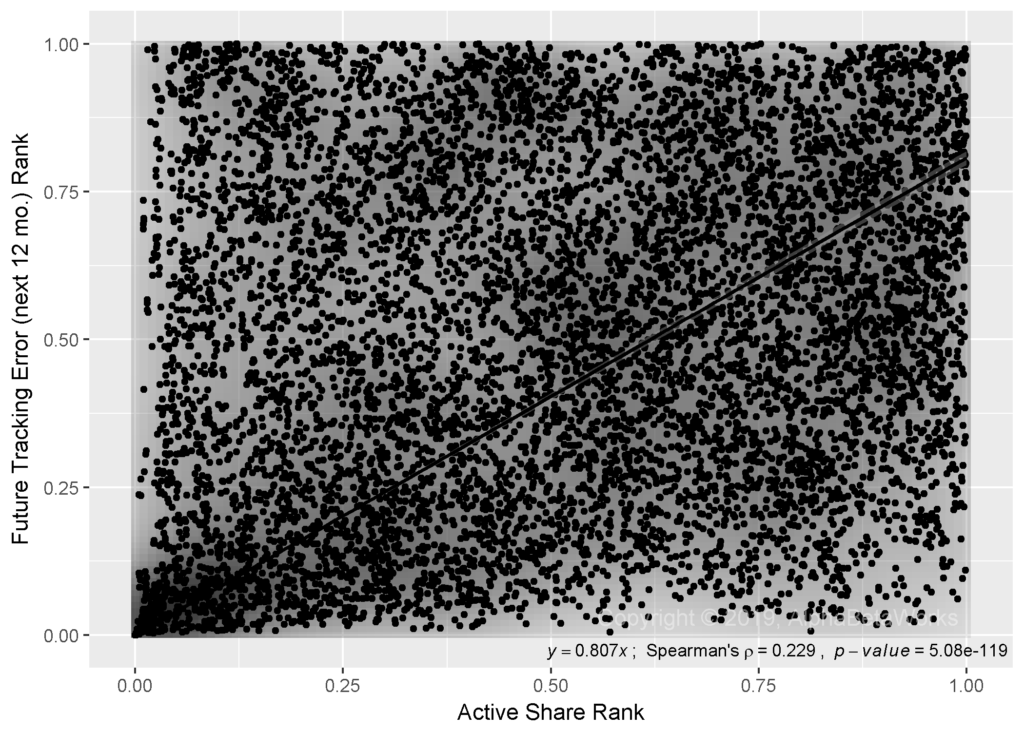
Chart of the predictive power of Active Share to forecast future tracking error rank of U.S. equity mutual funds illustrating a weak predictive power.
U.S. Equity Mutual Fund Portfolios: The Predictive Power of Active Share to Forecast Future Tracking Error Rank
Residual standard error: 2811 on 9998 degrees of freedom
Multiple R-squared:  0.05226,   Adjusted R-squared:  0.05217
F-statistic: 551.3 on 1 and 9998 DF,  p-value: < 2.2e-16

The Predictive Power of Active Share to Forecast Future Active Returns

Active Share also predicts approximately 5% of the variation in monthly absolute active returns across mutual funds:
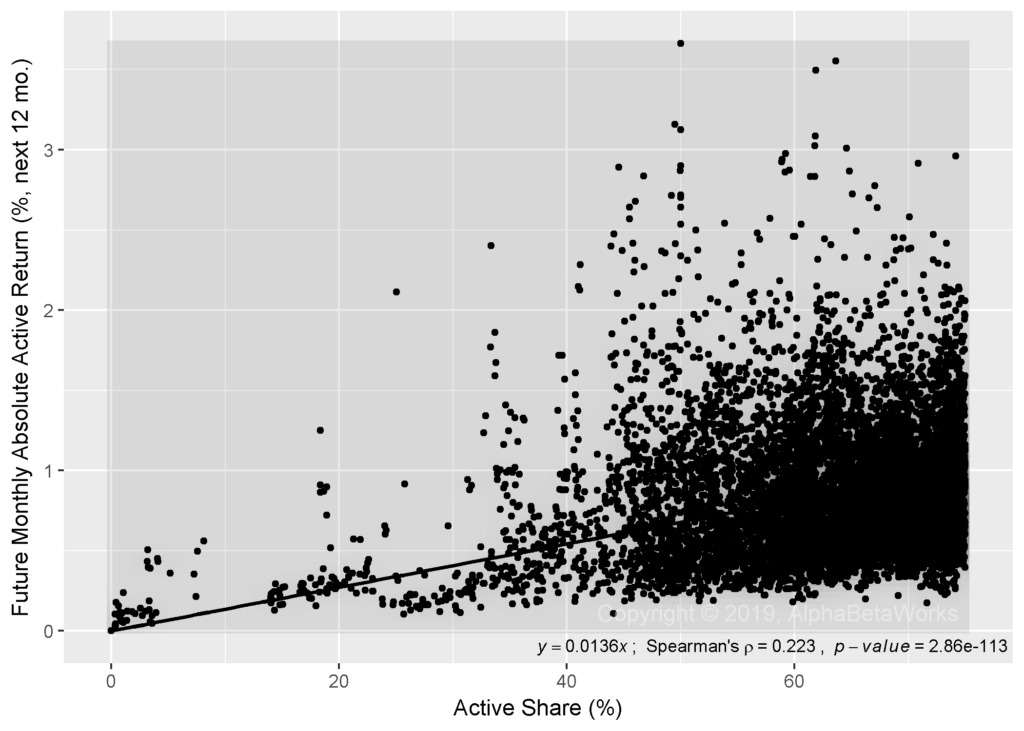
Chart of the predictive power of Active Share to forecast monthly absolute active return of U.S. equity mutual funds illustrating a weak predictive power.
U.S. Equity Mutual Fund Portfolios: The Predictive Power of Active Share to Forecast Future Active Return
Residual standard error: 0.3986 on 9998 degrees of freedom
Multiple R-squared:  0.04999,   Adjusted R-squared:  0.04989
F-statistic: 526.1 on 1 and 9998 DF,  p-value: < 2.2e-16

The above results make a generous assumption that all relative returns are due to active management. In fact, much relative performance is attributable to passive differences between a portfolio and a benchmark. We will illustrate this complexity in our follow-up research.

The Predictive Power of Robust Equity Risk Models

To put the predictive power of Active Share into perspective, we compare it to the predictive power of tracking error as estimated by robust and predictive equity risk models. Instead of Active Share, we use AlphaBetaWorks’ default Statistical U.S. Equity Risk Model to forecast tracking error of a fund F at date D.

The Predictive Power of Equity Risk Models to Forecast Future Tracking Error

The equity risk model predicts approximately 38% of the variation in tracking error across mutual funds:
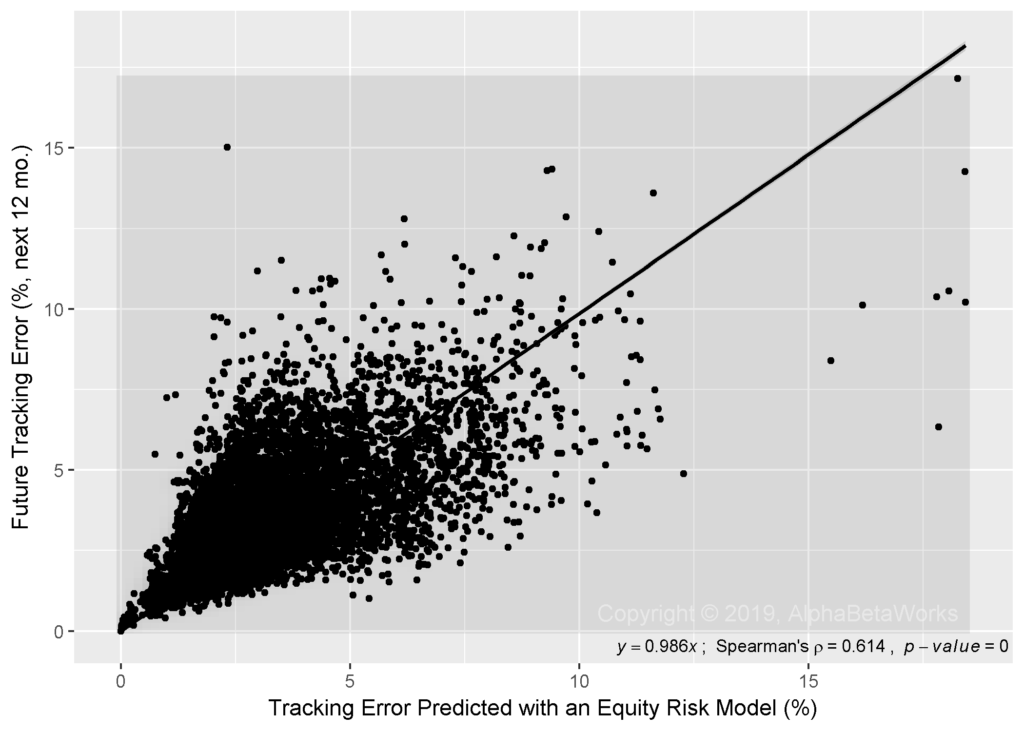
Chart of the predictive power of robust equity risk models to forecast future tracking error of U.S. equity mutual funds illustrating a strong predictive power.
U.S. Equity Mutual Fund Portfolios: The Predictive Power of Robust Equity Risk Models to Forecast Future Tracking Error
Residual standard error: 1.379 on 9998 degrees of freedom
Multiple R-squared: 0.3776, Adjusted R-squared: 0.3776
F-statistic: 6067 on 1 and 9998 DF, p-value: < 2.2e-16

As with Active Share above, heteroscedasticity does not affect the results. We see a similar relationship when we consider ranks instead of values:
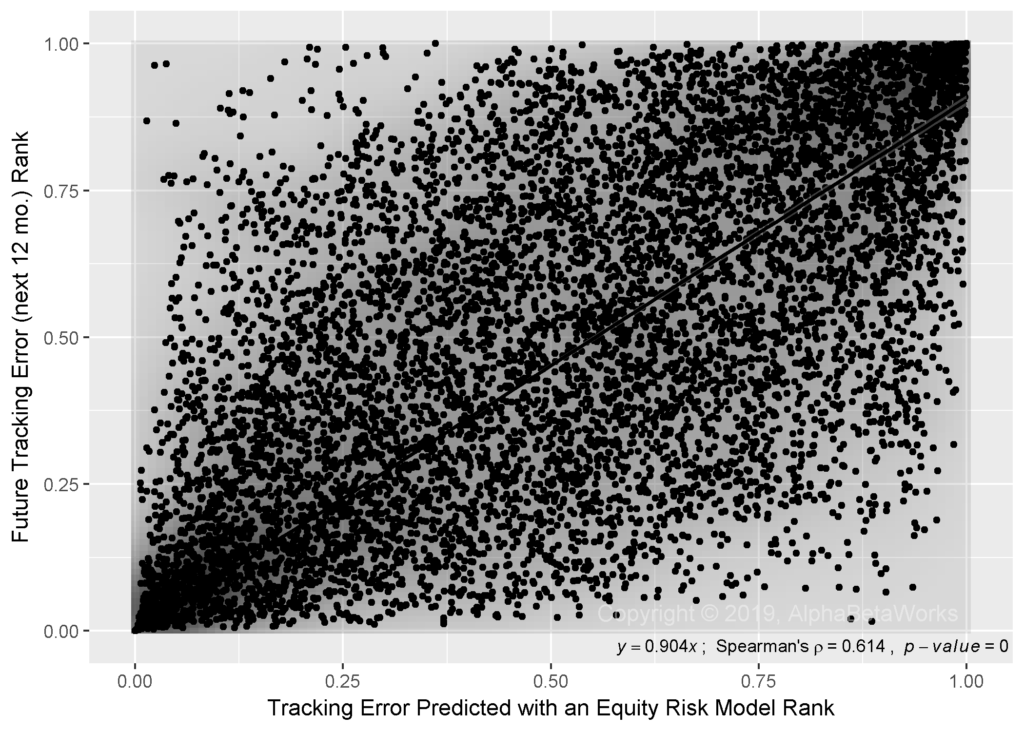
Chart of the predictive power of robust equity risk models to forecast future tracking error rank of U.S. equity mutual funds illustrating a strong predictive power.
U.S. Equity Mutual Fund Portfolios: The Predictive Power of Robust Equity Risk Models to Forecast Future Tracking Error Rank
Residual standard error: 2278 on 9998 degrees of freedom
Multiple R-squared: 0.3773, Adjusted R-squared: 0.3772
F-statistic: 6058 on 1 and 9998 DF, p-value: < 2.2e-16

The Predictive Power of Equity Risk Models to Forecast Future Active Returns

The equity risk model predicts approximately 44% of the variation in monthly absolute active returns across mutual funds:
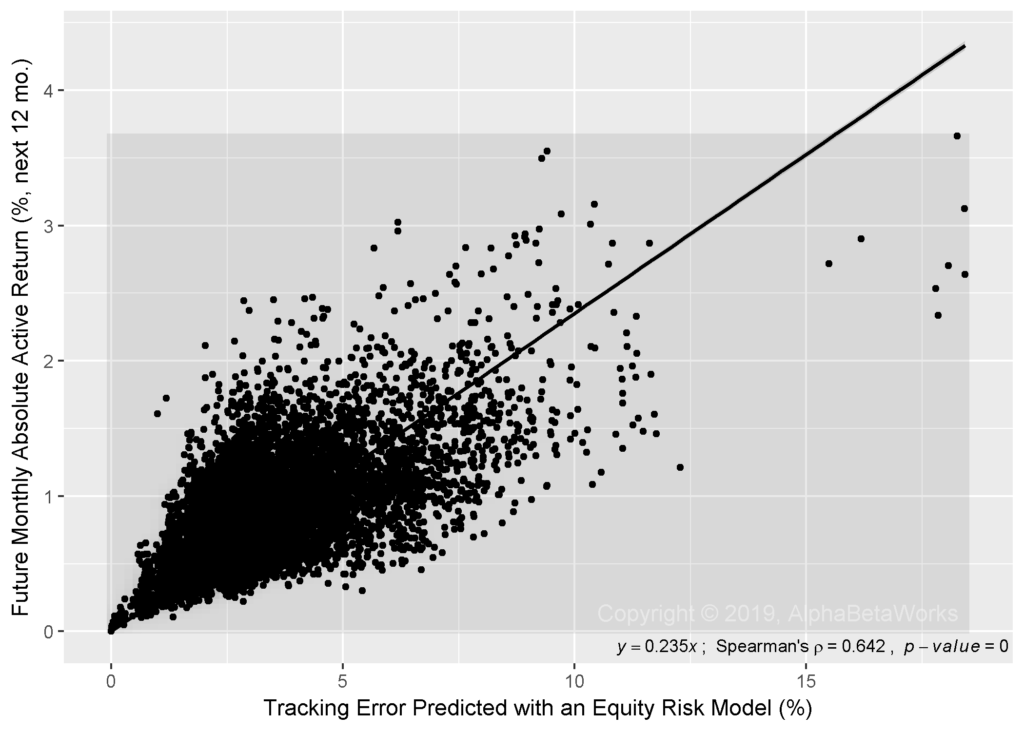
Chart of the predictive power of robust equity risk models to forecast monthly absolute active return of U.S. equity mutual funds illustrating a strong predictive power.
U.S. Equity Mutual Fund Portfolios: The Predictive Power of Robust Equity Risk Models to Forecast Future Active Return
Residual standard error: 0.3068 on 9998 degrees of freedom
Multiple R-squared: 0.4375, Adjusted R-squared: 0.4374
F-statistic: 7776 on 1 and 9998 DF, p-value: < 2.2e-16

Conclusions

  • Active Share is a statistically significant metric of active management (there is a relationship between Active Share and how active a fund is relative to a given benchmark), but the predictive power of Active Share is very weak.
  • Active Share predicts approximately 5% of the variation in tracking error and active returns across U.S. equity mutual funds. 
  • A robust and predictive equity risk model is roughly 7-9-times more effective than Active Share, predicting approximately 40% of the variation in tracking error and active returns across U.S. equity mutual funds.
  • In the following articles, we will put the above predictive statistics into context and quantify how likely Active Share is to identify closet indexers.

The information herein is not represented or warranted to be accurate, correct, complete or timely. Past performance is no guarantee of future results. Copyright © 2012-2019, AlphaBetaWorks, a division of Alpha Beta Analytics, LLC. All rights reserved. Content may not be republished without express written consent.


Performance of the Top U.S. Stock Pickers in 2016

And What They Owned at Year-end

Though 2016 was a poor year for most institutional portfolio managers, it was a satisfactory year for the most skilled ones. Security selection returns of the top U.S. stock pickers in 2016 were positive. When hedged to match market risk, a consensus portfolio of the top intuitional U.S. stock pickers outperformed the Market by approximately 2%.

This article demonstrates how a robust equity risk model and predictive performance analytics identify the top stock pickers – the hard part of measuring investment skill. Since genuine investment skill persists, the top stock pickers of the past tend to generate positive stock picking returns in the future. We illustrate this performance and share the top consensus positions driving it. These consensus positions of the top U.S. stock pickers are a profitable resource for investors searching for ideas. The method for tracking the top active managers and this method’s performance are benchmarks against which capital allocators can evaluate qualitative and quantitative manager selection processes.

Identifying the Top U.S. Stock Pickers

This study updates our analysis for 2015 and follows a similar method:  We analyzed long U.S. equity portfolios of all institutions that have filed Forms 13F. This survivorship-free portfolio database comprises thousands of firms. The database covers all institutions that have managed over $100 million in long U.S. assets. Some of these firms were not suitable for skill evaluation, for instance due to short filings histories or high turnover. Approximately 4,000 firms were evaluated.

During bullish market regimes, the top-performing portfolios are those that take the most factor (systematic) risk. During bearish market regimes, the top-performing portfolios are those that take the least risk. Hence, when the regimes change the leaders revert. This is the main reason nominal returns and related simplistic metrics of investment skill (Sharpe Ratio, Win/Loss Ratio, etc.) revert and fail. This is also the evidence behind most purported proofs of the futility of active manager selection. These arguments assume that, since the flawed performance metrics are non-predictive, all performance metrics are non-predictive, and it is impossible to identify future outperformers.

To eliminate the systematic noise that is the source of performance reversion, the AlphaBetaWorks Performance Analytics Platform calculates portfolio return from security selection – αReturn. αReturn is the performance a portfolio would have generated if all factor returns had been flat. This is the estimated residual performance due to stock picking skill, net of all factor effects. Each month we identify the top five percent among 13F-filers with the most consistently positive αReturns over the prior 36 months. This expert panel of the top stock pickers typically includes 100-150 firms. Data is lagged 2 months to account for the filing delay. We construct the aggregate expert portfolio (the ABW Expert Aggregate) by equal-weighting the expert portfolios and position-weighting stocks within the expert portfolios.

Manager fame and firm size are poor proxies for skill. Consequently, the ABW Expert Aggregate is an eclectic collection that includes hedge funds and asset management firms, banks, endowments, trust companies, and other institutions.

Market-Neutral Performance of the Top U.S. Stock Pickers

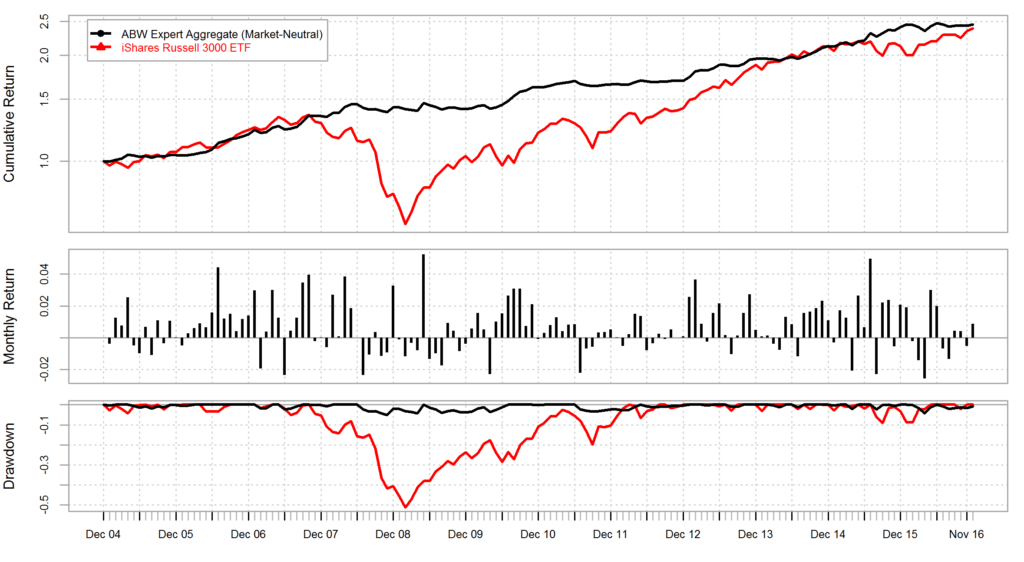
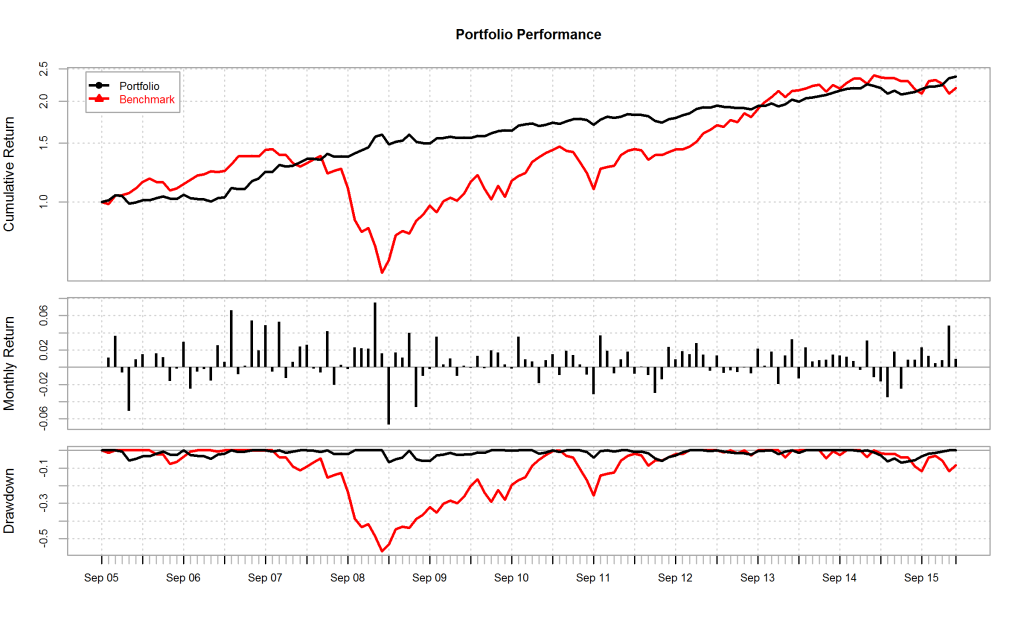
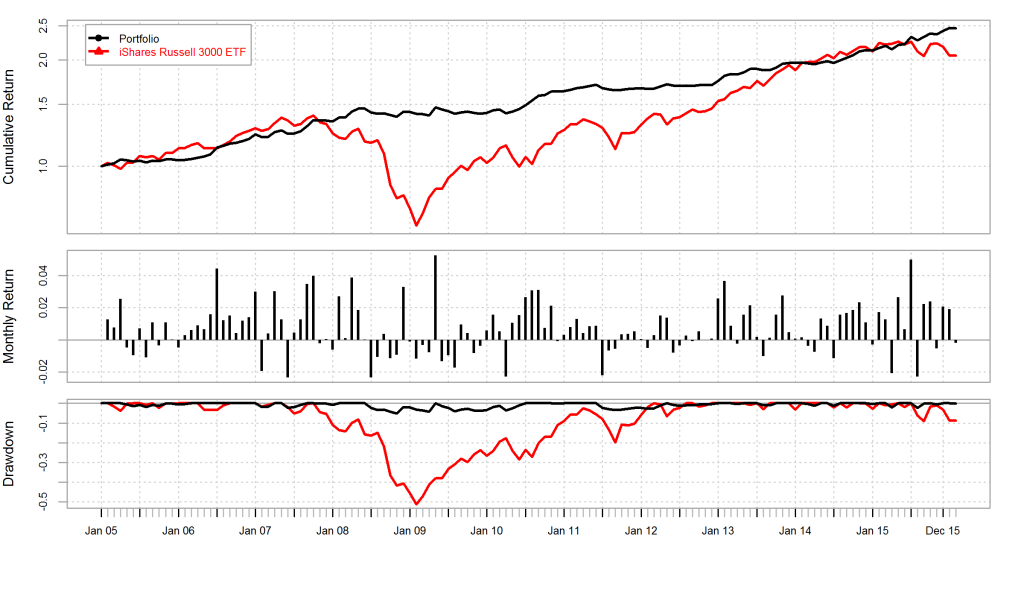
Since security selection skill persists, portfolios that have generated positive αReturns in the past are likely to generate them in the future. Consequently, a hedged aggregate of such portfolios (the Market-Neutral ABW Expert Aggregate) delivers consistent positive returns:

Chart of the cumulative return of the Market (Russell 3000) and the cumulative return of the market-neutral portfolio that combines the to 5% U.S. institutional long stock pickers net consensus exposures

Cumulative Market-Neutral Portfolio Return: Top U.S. Stock Pickers’ Net Consensus Longs

2005 2006 2007 2008 2009 2010 2011 2012 2013 2014 2015 2016
Market-Neutral
ABW Expert Aggregate
4.15 14.43 12.74 5.95 -1.25 15.35 2.20 2.24 15.47 8.81 13.16 1.72
iShares Russell
3000 ETF
6.08 15.65 4.57 -37.16 28.21 16.81 0.78 16.43 32.97 12.41 0.34 12.61

ABW Expert Aggregate outperformed the broad market with less than half the volatility:

Market-Neutral
ABW Expert Aggregate
iShares Russell 3000 ETF
Annualized Return 7.69 7.49
Annualized Standard Deviation 5.29 14.71
Annualized Sharpe Ratio (Rf=0%) 1.45 0.51

There are several ways to reconcile the positive stock picking performance above with the apparently challenging environment for fundamental stock picking in 2016:

  • Performance of an average manager is a poor proxy for the performance of a top manager.
  • Some skilled managers may suffer from underdeveloped risk systems, and losses from hidden systematic risks conceal their stock-picking results.
  • Many skilled stock pickers are poor market timers, or they may have experienced a challenging market-timing environment.

ABW Expert Aggregate is different than the crowded portfolios, which we have written about at length. Whereas crowded bets are shared by the entire universe of investors, ABW Expert Aggregate is a small subset covering the consistently best stock pickers. It is common for crowded hedge fund longs (overweights) to be shorts (underweights) of ABW Expert Aggregate, and vice versa.

Market Performance of the Top U.S. Stock Pickers

The Market-Neutral ABW Expert Aggregate is fully hedged. Accordingly, it has insignificant market exposure and will, by definition, underperform the Market during the bullish regimes. Therefore, the Market-Neutral ABW Expert Aggregate is not suitable as a core holding and is not directly comparable to long portfolios.

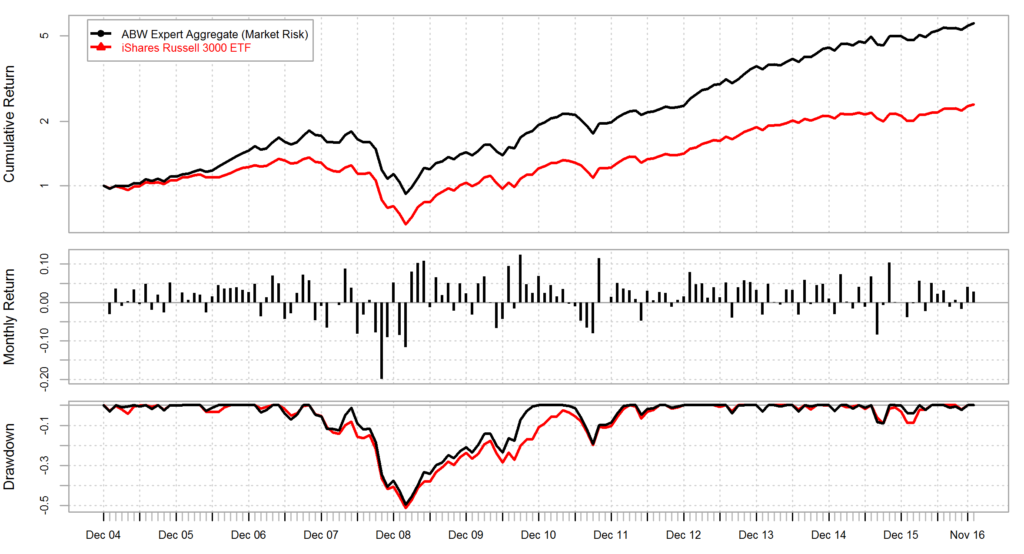
The aggregate portfolio of the top stock pickers can be hedged to match the market risk. This portfolio (the Market-Risk ABW Expert Aggregate) delivers consistent outperformance, instead of the consistent absolute returns of the Market-Neutral ABW Expert Aggregate:

Chart of the cumulative return of the Market (Russell 3000) and the cumulative return of the portfolio with market risk that combines the to 5% U.S. institutional long stock pickers net consensus exposures

Cumulative Market-Risk Portfolio Return: Top U.S. Stock Pickers’ Net Consensus Longs

2005 2006 2007 2008 2009 2010 2011 2012 2013 2014 2015 2016
Market-Risk
ABW Expert Aggregate
10.43 32.20 17.32 -33.79 26.43 34.52 2.78 19.15 52.93 22.07 13.10 14.77
iShares Russell
3000 ETF
6.08 15.65 4.57 -37.16 28.21 16.81 0.78 16.43 32.97 12.41 0.34 12.61


Market-Risk
ABW Expert Aggregate
iShares Russell 3000 ETF
Annualized Return 15.53 7.49
Annualized Standard Deviation 16.57 14.71
Annualized Sharpe Ratio (Rf=0%) 0.94 0.51

Top U.S. Stock Pickers’ Consensus Positions

Just as few celebrated firms were the top U.S. stock pickers in 2016, few celebrated stocks were their top ideas. Below are the top 10 consensus overweights of the ABW Expert Aggregate at year-end 2016:

Symbol Name Exposure (%)
EA Electronic Arts Inc. 1.41
NTES NetEase, Inc. 1.00
OXY Occidental Petroleum Corporation 0.69
PXD Pioneer Natural Resources 0.68
PEP PepsiCo, Inc. 0.63
SCHW Charles Schwab Corporation 0.55
ACN Accenture Plc 0.52
JNJ Johnson & Johnson 0.48
NKE NIKE, Inc. 0.46
V Visa Inc. 0.44

Many of these positions remained since year-end 2015, illustrating the stability of the ABW Expert Aggregate.

Top Stock Pickers’ Exposure to Electronic Arts (EA)

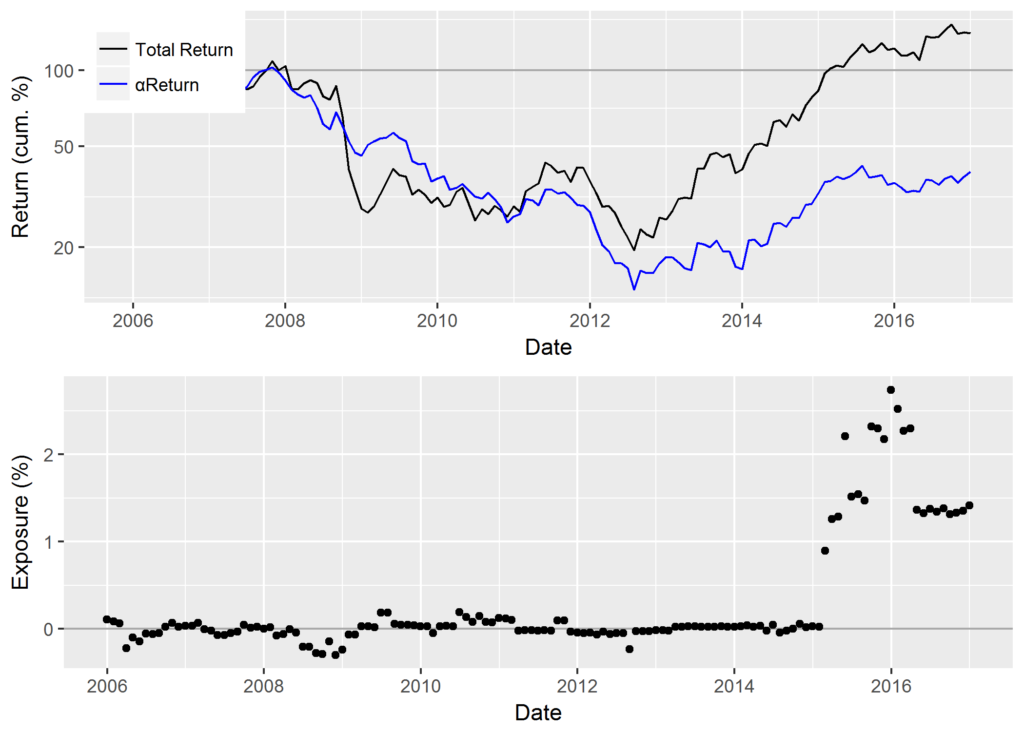
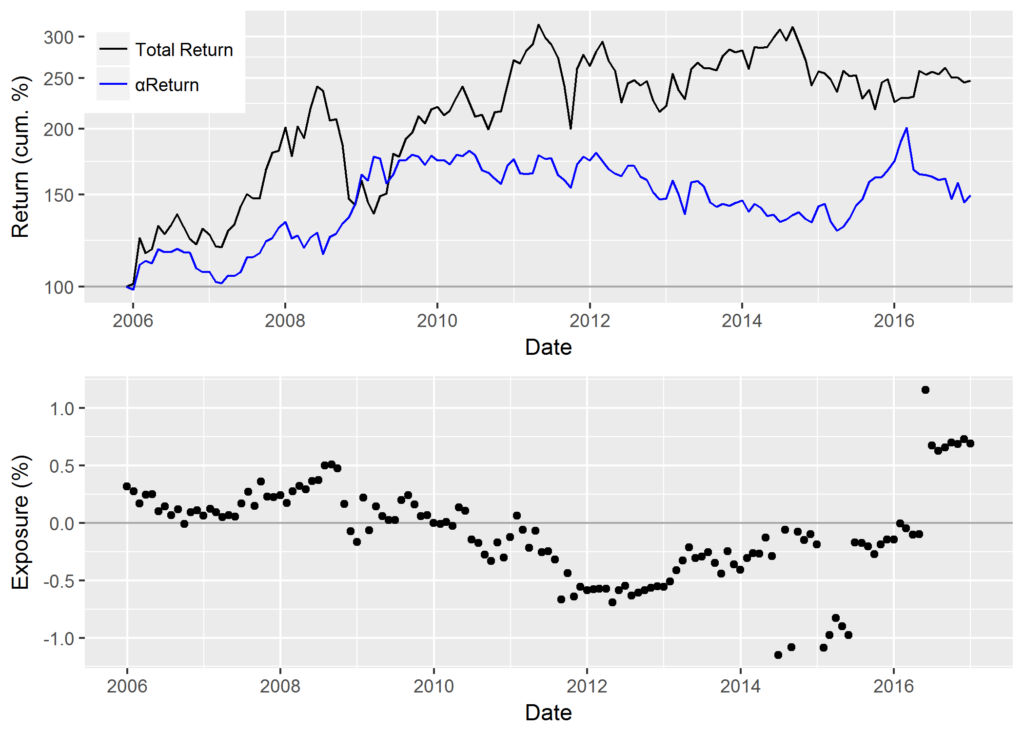
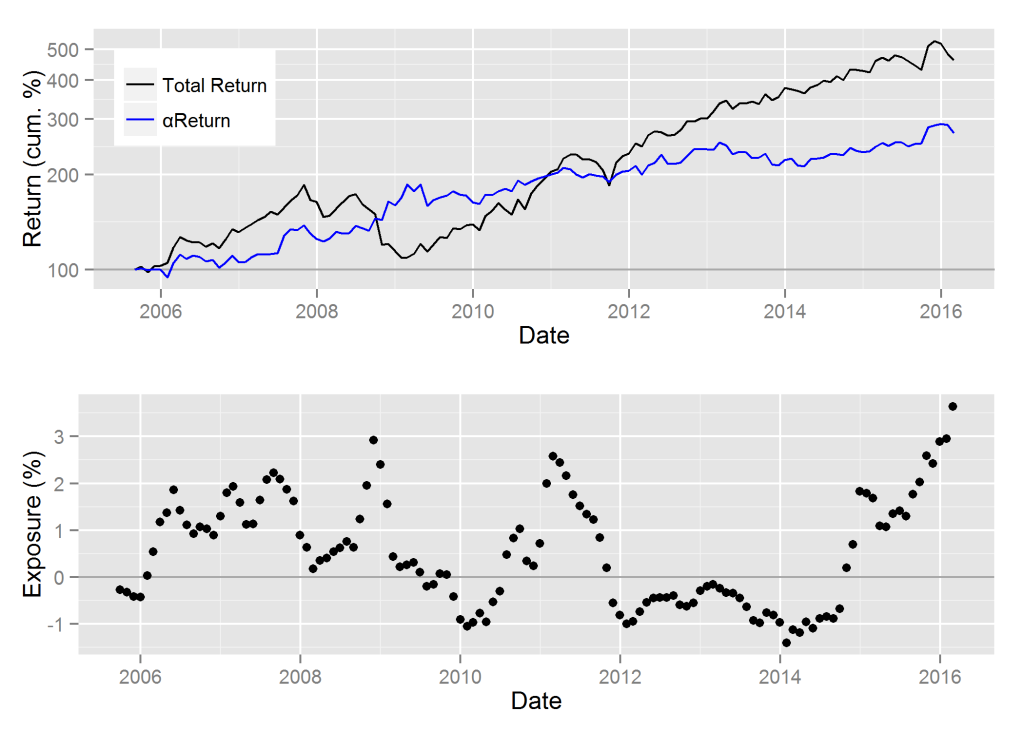
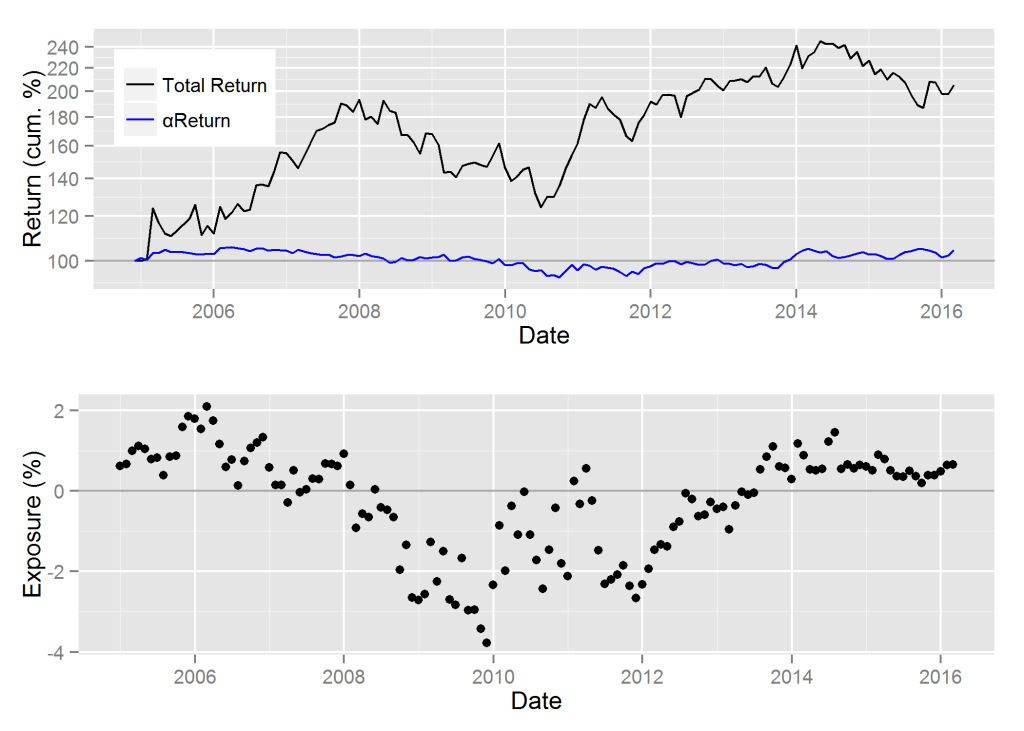
The top panel on the following chart shows EA’s cumulative nominal return in black and cumulative residual return (αReturn) in blue. Recall that residual return or αReturn is the performance EA would have generated if all factor returns had been zero. The bottom panel shows exposure to EA within the ABW Expert Aggregate. Top stock pickers had negligible exposure to EA until 2015. In early-2015 EA became one of the largest exposures within the Expert Aggregate, and it remained a top position through 2016:

Chart of the cumulative αReturn (residual return) of EA and exposure to EA within the hedged portfolio that combines the to 5% U.S. long stock pickers net consensus exposures

Cumulative αReturns of EA and Exposure to EA within the Hedged Portfolio of the Top U.S. Stock Pickers’ Net Consensus Longs

Top Stock Pickers’ Exposure to NetEase (NTES)

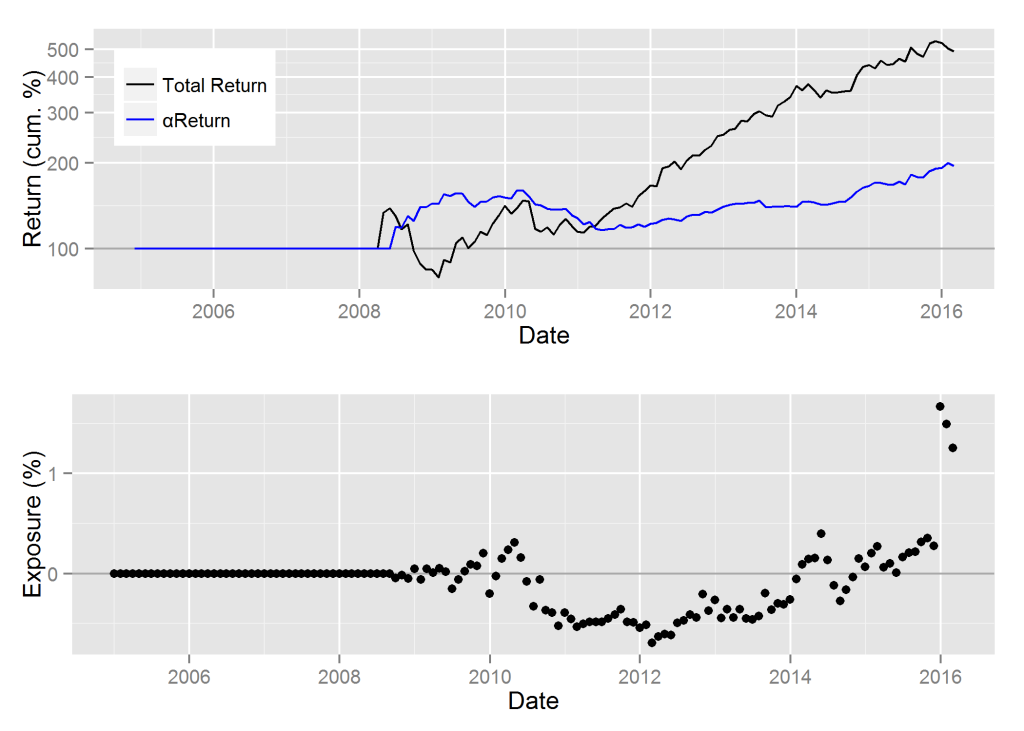
ABW Expert Aggregate had negligible exposure to NTES until early 2016. NTES became a consensus long by early-2016. The strong positive αReturn of NTES continued through 2016:

Chart of the cumulative αReturn (residual return) of NTES and exposure to NTES within the hedged portfolio that combines the to 5% U.S. long stock pickers net consensus exposures

Cumulative αReturns of NTES and Exposure to NTES within the Hedged Portfolio of the Top U.S. Stock Pickers’ Net Consensus Longs

Top Stock Pickers’ Exposure to Occidental Petroleum (OXY)

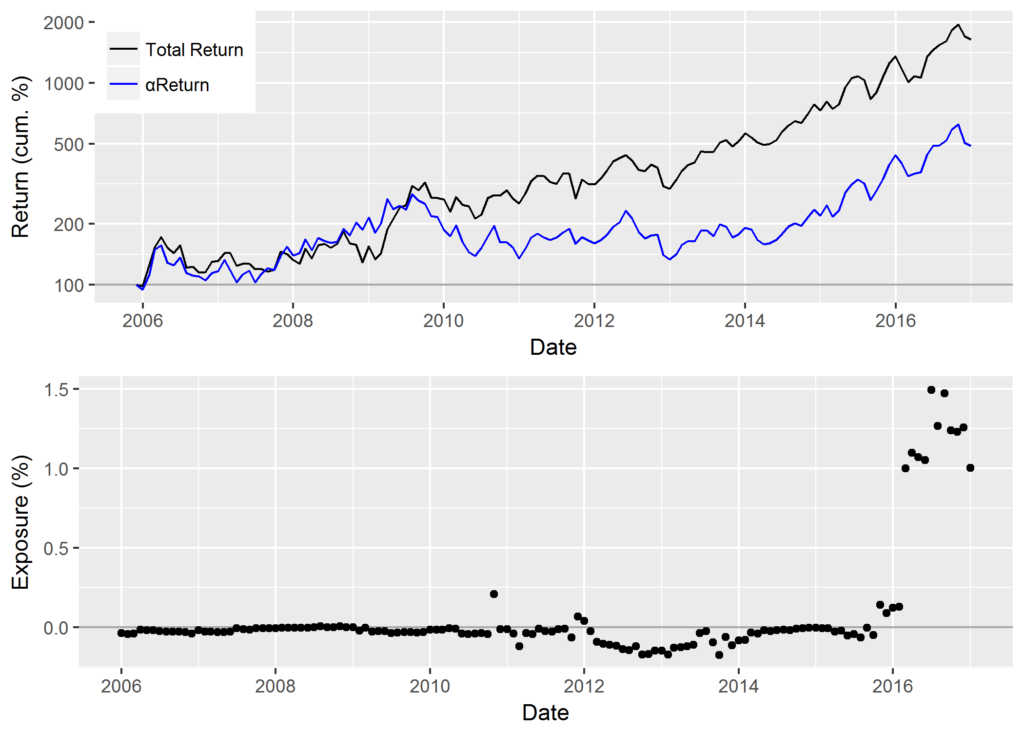
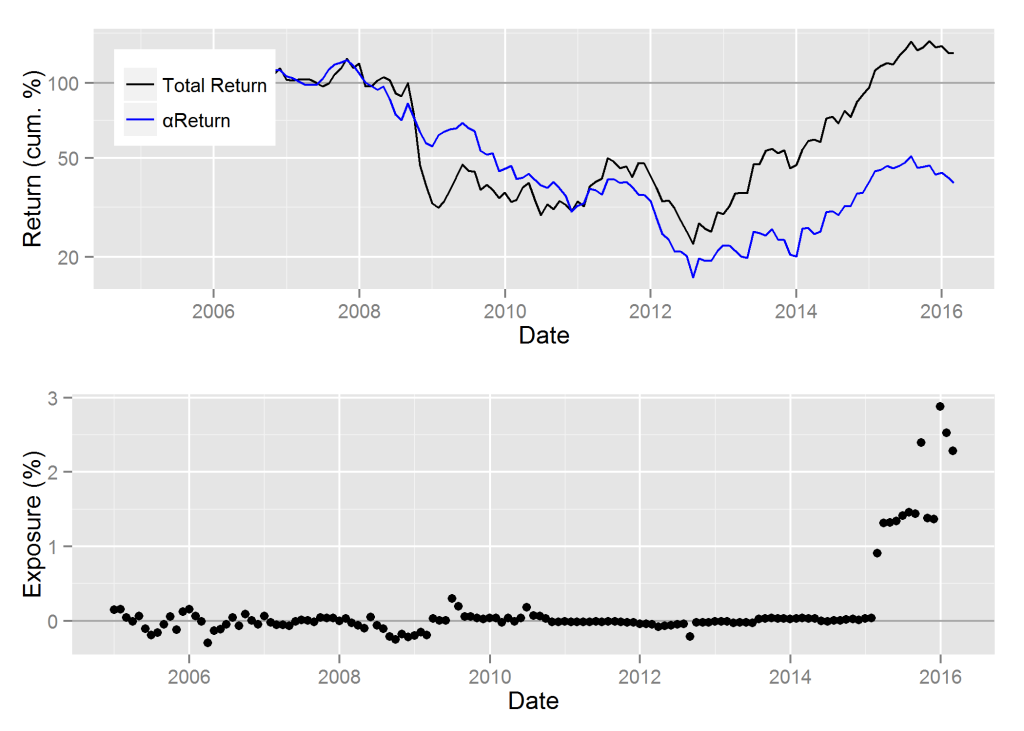
The Aggregate was mostly underweight (short) OXY between 2010 and 2016. This means that the top U.S. stock pickers were underweight the stock. Their exposure to OXY grew through 2016 and by year-end it was a top bet. The smart money has added to OXY in 2016 even as it underperformed:

Chart of the cumulative αReturn (residual return) of NTES and exposure to NTES within the hedged portfolio that combines the to 5% U.S. long stock pickers net consensus exposures

Cumulative αReturns of OXY and Exposure to OXY within the Hedged Portfolio of the Top U.S. Stock Pickers’ Net Consensus Longs

Conclusions

  • Robust equity risk models and predictive performance analytics can identify the top stock pickers in the sea of mediocrity.
  • The market-neutral aggregate of the top stock pickers’ portfolios delivers consistent absolute performance.
  • The aggregate of the top stock pickers’ portfolios matching market risk delivers consistent outperformance relative to the Market.
  • Consensus portfolio of the top stock pickers is a profitable source of investment ideas.
  • Provided they control properly for systematic (factor) effects, simple rules for manager selection tend to select future outperformers.
The information herein is not represented or warranted to be accurate, correct, complete or timely.
Past performance is no guarantee of future results.
Copyright © 2012-2017, AlphaBetaWorks, a division of Alpha Beta Analytics, LLC. All rights reserved.
Content may not be republished without express written consent.
U.S. Patents Pending.

The Top U.S. Stock Pickers’ Industrials Performance

And Their Consensus Industrials Ideas in 2016

The challenges of identifying good investors and distilling their skill obscure the top stock pickers’ consistently strong performance. For instance, contrary to popular wisdom 2015 was a good year for stock picking. These results also generally apply to large market sub-segments such as the Industrials sector. In this piece we use a robust risk model to identify the best U.S. stock pickers, distill their skills, and monitor their Industrials performance. We then track their consensus Industrials portfolio and reveal its top positions.

Identifying the Top U.S. Stock Pickers

Nominal returns and related simplistic metrics of investment skill are dominated by systematic factors and hence revert. Therefore, we must eliminate these systematic effects to get an accurate picture. The AlphaBetaWorks Performance Analytics Platform calculates each portfolio’s return from security selection, or αReturn. It is the residual performance net of factor effects and the performance a portfolio would have generated if all factor returns had been flat.

This study covers portfolios of all institutions that have filed Form 13F. Of these, approximately 5,000 filers had holdings histories suitable for skill evaluation. The AlphaBetaWorks Expert Aggregate (ABW Expert Aggregate) consists of the top five percent with the most consistently positive 36-month αReturns. This expert panel typically includes 100-150 firms. Manager fame and firm size are poor proxies for skill, so the panel is an eclectic collection light on celebrities but heavy on skill.

Industrials Performance of the Top U.S. Stock Pickers’

Since security selection skill persists, managers with above-average αReturns in the past are likely to maintain them in the future. This applies both to aggregate portfolios and to large portfolio subsets, such as sector holdings. To illustrate, we consider the top stock pickers’ Industrials performance.

A hedged portfolio that combines the top U.S. stock pickers’ net consensus Industrials longs (relative Industrials overweights), lagged 2 months to account for filing delay (the ABW Industrials Expert Aggregate), delivers consistent positive returns:

Chart of the cumulative return of the Industrials Benchmark (Vanguard Industrials ETF (VIS)) and the cumulative Industrials performance of the hedged portfolio that combines the to 5% U.S. long stock pickers’ net consensus industrials positions

Cumulative Hedged Portfolio Return: Top U.S. Stock Pickers’ Net Consensus Industrials Longs

For illustration, we include the performance of the Vanguard Industrials ETF (VIS) (Benchmark above).

2005 2006 2007 2008 2009 2010 2011 2012 2013 2014 2015 2016
ABW Industrials Expert Aggregate 4.13 -2.25 25.24 14.37 7.67 9.47 3.93 6.11 2.06 12.94 2.48 5.84
Vanguard Industrials ETF (VIS) 4.88 15.35 14.14 -39.37 23.15 27.74 -2.48 17.71 42.08 9.00 -3.73 -2.82

The top stock pickers’ consistently positive Industrials αReturns yield consistently positive returns, low volatility, and low drawdowns for the ABW Industrials Expert Aggregate:

ABW Industrials Expert Aggregate Vanguard Industrials ETF (VIS)
Annualized Return 8.56 7.75
Annualized Standard Deviation 7.38 19.24
Annualized Sharpe Ratio (Rf=0%) 1.16 0.40
ABW Industrials Expert Aggregate Vanguard Industrials ETF (VIS)
Semi Deviation 1.50 4.20
Gain Deviation 1.50 3.35
Loss Deviation 1.42 4.46
Downside Deviation (MAR=10%) 1.57 4.22
Downside Deviation (Rf=0%) 1.17 3.84
Downside Deviation (0%) 1.17 3.84
Maximum Drawdown 6.95 57.33
Historical VaR (95%) -2.52 -8.66
Historical ES (95%) -4.09 -13.08

Unfortunately, some highly skilled managers with strong Industrials books have fallen far short of the above results. Poor risk systems and losses from overlooked factor exposures often conceal stock-picking skill. The consistent absolute returns above are due in part to robust hedging that mitigates systematic noise.

Top U.S. Stock Pickers’ Consensus Industrials Positions

The top stock pickers are rarely the hottest funds and their consensus longs are rarely the hottest stocks. Below are the top 10 holdings of the ABW Industrials Expert Aggregate at year-end 2015:

Symbol Name Exposure (%)
MMM 3M Company 17.37
GE General Electric Company 5.47
ROP Roper Technologies, Inc. 3.64
UNP Union Pacific Corporation 3.61
DHR Danaher Corporation 3.26
UTX United Technologies Corporation 2.84
AGX Argan, Inc. 2.77
LMT Lockheed Martin Corporation 2.56
EMR Emerson Electric Co. 2.47
LUV Southwest Airlines Co. 2.37

It is worth noting that the above positions represent a consensus among stock-pickers who have proven their skill. This is not to be confused with crowding, which we have written about at length. Hedge fund crowding is a consensus among (often impatient and performance-sensitive) hedge funds, irrespective of their skill.

Top Stock Pickers’ Exposure to 3M (MMM)

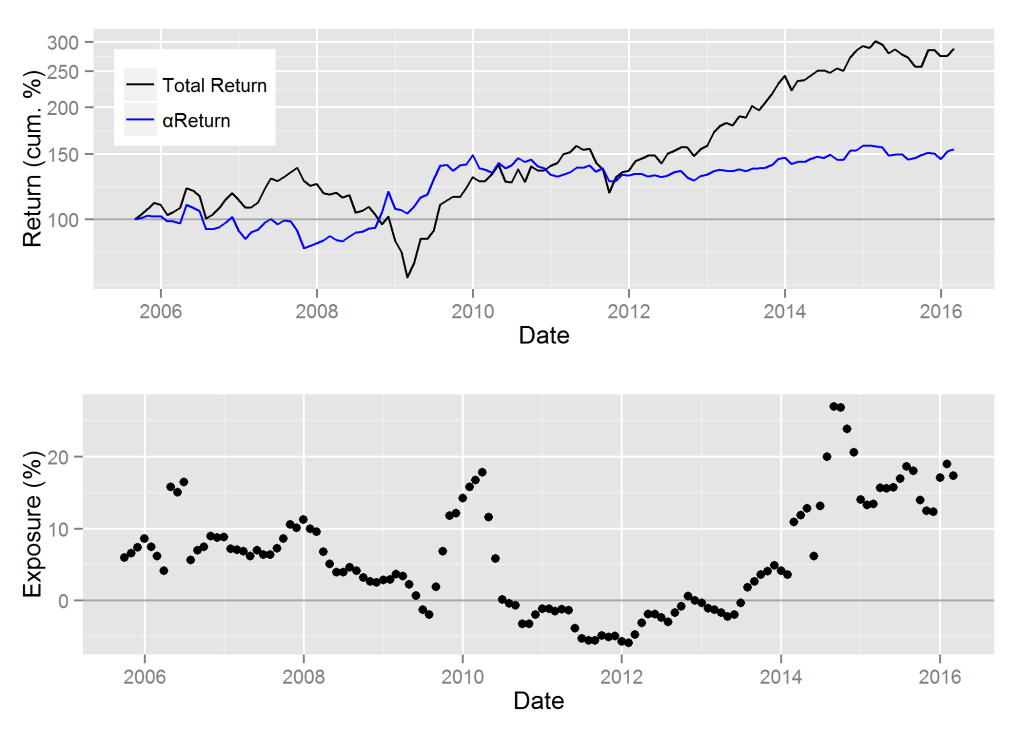
The largest position within the ABW Industrials Expert Aggregate is 3M (MMM). The top panel on the following chart shows MMM’s cumulative nominal returns in black and cumulative residual returns (αReturns) in blue. Residual return or αReturn is the performance net of the systematic factors defined by the AlphaBetaWorks Statistical Equity Risk Model – the performance MMM would have generated if factor returns had been flat. The bottom panel shows exposure to MMM within the Aggregate:

Chart of the cumulative αReturn (residual return) of MMM and exposure to MMM within the hedged portfolio that combines the to 5% U.S. long stock pickers’ net consensus industrials positions

Cumulative αReturns of MMM and ABW Industrials Expert Aggregate’s MMM Exposure

Top Stock Pickers’ Exposure to General Electric (GE)

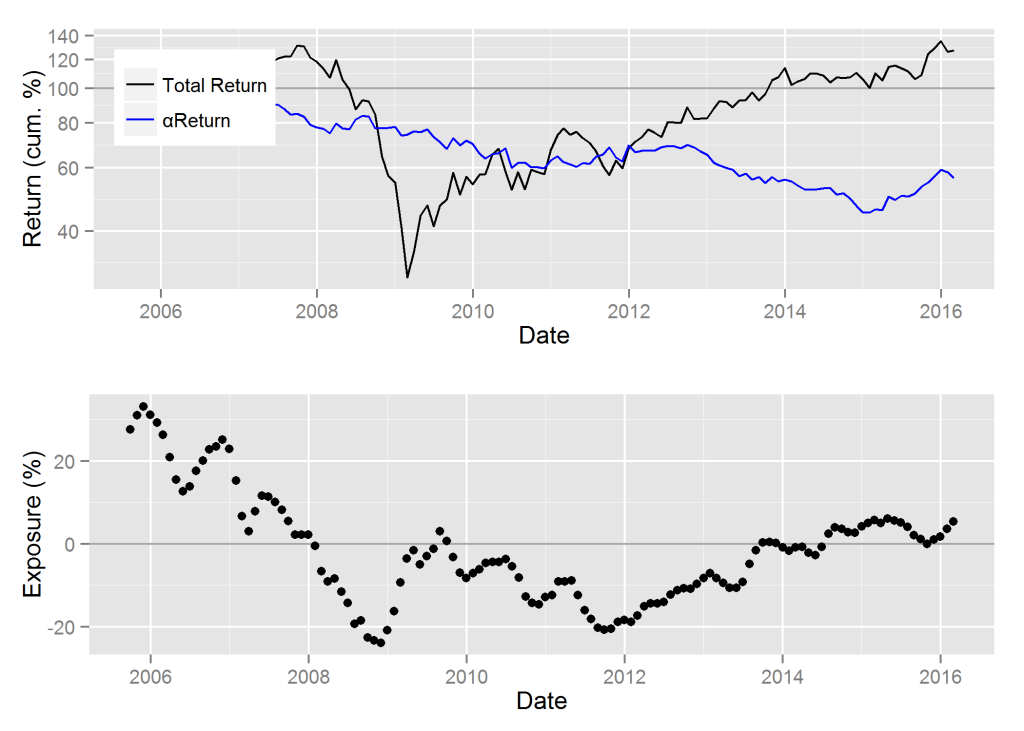
The second largest position within the ABW Industrials Expert Aggregate is General Electric (GE). The Expert Aggregate was mostly underweight (short) GE between 2008 and 2014 – a challenging period for GE. GE became experts’ consensus long in 2014 – about a year ahead of the 2015 turnaround in residual performance:

Chart of the cumulative αReturn (residual return) of GE and exposure to GE within the hedged portfolio that combines the to 5% U.S. long stock pickers’ net consensus industrials positions

Cumulative αReturns of GE and ABW Industrials Expert Aggregate’s GE Exposure

Top Stock Pickers’ Exposure to Roper Technologies (ROP)

The third largest position within the ABW Industrials Expert Aggregate is Roper Technologies (ROP). The Aggregate has had varied but mostly positive exposure to ROP over the past 10 years. Current exposure is at historic heights:

Chart of the cumulative αReturn (residual return) of ROP and exposure to ROP within the hedged portfolio that combines the to 5% U.S. long stock pickers’ net consensus industrials positions

Cumulative αReturns of ROP and ABW Industrials Expert Aggregate’s ROP Exposure

Conclusions

  • Robust analytics built on predictive risk models identify the top stock pickers in the sea of mediocrity.
  • When hedged, top stock pickers’ net consensus Industrials longs (relative overweights) tend to generate positive future absolute returns and net consensus industrials shorts (relative underweights) tend to generate negative future absolute returns.
  • The top stock pickers are often unglamorous firms and their consensus Industrials longs are often unglamorous stocks – both tend to outperform.
The information herein is not represented or warranted to be accurate, correct, complete or timely.
Past performance is no guarantee of future results.
Copyright © 2012-2016, AlphaBetaWorks, a division of Alpha Beta Analytics, LLC. All rights reserved.
Content may not be republished without express written consent.
U.S. Patents Pending.

How Did the Top U.S. Stock Pickers Do in 2015?

And What Did They Own at Year-end?

Contrary to popular wisdom, 2015 was a good year for stock picking. The problem is that few know who the good stock pickers are. Further, good stock pickers may be poor risk managers. In this article we use a robust risk model to track the top U.S. stock pickers and to distill their skill.

Since genuine investment skill persists, top U.S. stock pickers tend to generate persistently positive returns from security selection. Consequently, a hedged (market-neutral) portfolio of their net consensus longs (relative overweights) tends to generate positive returns, independent of the Market. Below we illustrate this portfolio’s performance and reveal its top positions.

Identifying the Top U.S. Stock Pickers

This study covers portfolios of all institutions that have filed Form 13F. This is the broadest and most representative survivorship-free portfolio database comprising thousands of firms: hedge funds, mutual fund companies, investment advisors, and all other institutions with over $100 million in U.S. long assets. Approximately 5,000 firms had sufficiently long histories, low turnover, and broad portfolios suitable for skill evaluation.

Nominal returns and related simplistic metrics of investment skill (Sharpe Ratio, Win/Loss Ratio, etc.) are dominated by Market and other systematic factors and hence revert. As market regimes change, top performers tend to become bottom performers. To eliminate these systematic effects and estimate residual performance due to stock picking skill, the AlphaBetaWorks Performance Analytics Platform calculates each portfolio’s return from security selection – αReturn. αReturn is the performance a portfolio would have generated if all factor returns had been flat.

Each month we identify the five percent of 13F-filers with the most consistently positive αReturns over the prior 36 months. This expert panel of the top stock pickers typically includes 100-150 firms. Since manager fame and firm size are poor proxies for skill, the panel is an eclectic bunch. It currently includes some hedge funds (Lumina Fund Management, Palo Alto Investors, and Chilton Investment Company), though few of the famed gurus. Many of the top long stock pickers are investment management firms (Eaton Vance Management, Fiduciary Management Inc., and Aristotle Capital Management), as well as banks, endowments, and trust companies.

Performance of the Top U.S. Stock Pickers

Since security selection skill persists, managers with above-average αReturns in the past are likely to maintain them in the future. Therefore, a hedged portfolio that combines the top U.S. stock pickers’ net consensus longs (relative overweights), lagged 2 months to account for filing delay (the ABW Expert Aggregate), delivers consistent positive returns as illustrated below:

Chart of the cumulative return of the Market (Russell 3000) and the cumulative return of the hedged portfolio that combines the to 5% U.S. long stock pickers net consensus exposures

Cumulative Hedged Portfolio Return: Top U.S. Stock Pickers’ Net Consensus Longs

  2005 2006 2007 2008 2009 2010 2011 2012 2013 2014 2015 2016
ABW Expert Aggregate 4.56 14.43 12.74 5.95 -1.25 15.35 2.20 2.24 15.47 8.81 13.16 1.70
iShares Russell 3000 ETF 9.04 15.65 4.57 -37.16 28.21 16.81 0.78 16.43 32.97 12.41 0.34 -5.72

ABW Expert Aggregate achieved higher returns than those of the broad market with less than half of its volatility:

ABW Expert Aggregate iShares Russell 3000 ETF
Annualized Return 8.36 6.40
Annualized Standard Deviation 5.25 15.50
Annualized Sharpe Ratio (Rf=0%) 1.59 0.41

The consistency of top stock pickers’ αReturns manifests itself as low downside volatility and low losses of the ABW Expert Aggregate:

ABW Expert Aggregate iShares Russell 3000 ETF
Semi Deviation 1.00 3.33
Gain Deviation 1.19 2.40
Loss Deviation 0.70 3.45
Downside Deviation (MAR=10%) 1.09 3.43
Downside Deviation (Rf=0%) 0.64 3.04
Downside Deviation (0%) 0.64 3.04
Maximum Drawdown 5.06 51.24
Historical VaR (95%) -1.81 -7.58
Historical ES (95%) -2.21 -9.96

One often reads commentary on the challenges stock pickers faced in 2015. This analysis typically fails to identify skill and merely reveals the obvious: average managers do poorly in a low-return environment. In fact, 2015 was one of the strongest years for top stock pickers. It is the indiscriminate rallies such as that of 2009 that prove challenging.

Unfortunately, some skilled managers suffered from underdeveloped risk systems, and losses from hidden systematic risks concealed their stock-picking results. For instance, some highly skilled stock pickers with unintended small-cap (short Size) exposure experienced 5-10% systematic headwinds in 2015. A robust risk management program would have partially or wholly mitigated these.

Top U.S. Stock Pickers’ Consensus Positions

Since the top stock pickers are rarely the most celebrated firms, their top consensus longs are rarely the hottest stocks. Below are the top 10 holdings of the ABW Expert Aggregate at year-end 2015:

Symbol Name Exposure (%)
EA Electronic Arts Inc. 2.29
V Visa Inc. Class A 1.26
XOM Exxon Mobil Corporation 0.66
GTE Gran Tierra Energy Inc. 0.65
DIS Walt Disney Company 0.58
PEP PepsiCo, Inc. 0.57
MNST Monster Beverage Corporation 0.57
ORLY O’Reilly Automotive, Inc. 0.56
JKHY Jack Henry & Associates, Inc. 0.51
TTGT TechTarget, Inc. 0.50

Top Stock Pickers’ Exposure to Electronic Arts (EA)

Top stock pickers had negligible exposure to EA until 2015. In early-2015 EA became one of the largest exposures within our Expert Aggregate.

The top panel on the following chart shows cumulative nominal returns in black and cumulative residual returns (αReturns) in blue. Residual return or αReturn is the performance net of the systematic factors defined by the AlphaBetaWorks Statistical Equity Risk Model – the performance EA would have generated if systematic return had been flat. The bottom panel shows exposure to EA within the ABW Expert Aggregate:

Chart of the cumulative αReturn (residual return) of EA and exposure to EA within the hedged portfolio that combines the to 5% U.S. long stock pickers net consensus exposures

Cumulative αReturns of EA and Exposure to EA within the Hedged Portfolio of the Top U.S. Stock Pickers’ Net Consensus Longs

Top Stock Pickers’ Exposure to Visa Inc (V)

Our Expert Aggregate was underweight (short) V between 2011 and 2014 – a period of flat-to-negative αReturn when V lagged a passive portfolio with matching risk. V became an ABW Expert Aggregate consensus long by early 2014 – the start of a strong positive αReturn period:

Chart of the cumulative αReturn (residual return) of V and exposure to V within the hedged portfolio that combines the to 5% U.S. long stock pickers net consensus exposures

Cumulative αReturns of V and Exposure to V within the Hedged Portfolio of the Top U.S. Stock Pickers’ Net Consensus Longs

Top Stock Pickers’ Exposure to Exxon Mobil (XOM)

The Expert Aggregate was mostly underweight (short) XOM between 2008 and 2013, but grew exposure from 2012. By 2014 XOM was a top bet. This proved profitable during the 2014-2015 energy rout when XOM remained an island of stability, delivering positive αReturn:

Chart of the cumulative αReturn (residual return) of XOM and exposure to XOM within the hedged portfolio that combines the to 5% U.S. long stock pickers net consensus exposures

Cumulative αReturns of XOM and Exposure to XOM within the Hedged Portfolio of the Top U.S. Stock Pickers’ Net Consensus Longs

Conclusions

  • Robust analytics built on predictive risk models identify the top stock pickers in the sea of mediocrity.
  • Top stock pickers’ portfolios deliver consistently positive αReturns (residual returns), independent of the Market.
  • Top stock pickers’ net consensus longs (relative overweights) tend to generate positive future αReturns and net consensus shorts (relative underweights) tend to generate negative future αReturns .
  • Top stock pickers are rarely the most celebrated firms and their consensus longs are rarely the most celebrated stocks.
  • The most celebrated stocks frequently appear as top stock pickers’ consensus shorts.
The information herein is not represented or warranted to be accurate, correct, complete or timely.
Past performance is no guarantee of future results.
Copyright © 2012-2016, AlphaBetaWorks, a division of Alpha Beta Analytics, LLC. All rights reserved.
Content may not be republished without express written consent.
U.S. Patents Pending.

Are Momentum ETFs Delivering Momentum Returns?

There is a large difference between momentum strategies in theory and in practice. Given that much of its model performance derives from illiquid securities and high turnover, the academic momentum factor is a theoretical ideal that is not directly investable. Consequently, real-world momentum products, such as momentum ETFs, are restricted to investable liquid securities and usually reduce the approximately 200% annual turnover of theoretical momentum portfolios. After these modifications, their idiosyncratic momentum returns mostly vanish.

We consider a popular momentum ETF and illustrate that its historical performance is almost entirely attributable to passive exposures to simple non-momentum factors, such as Market and Sectors. Investors may thus be able to achieve and even surpass the performance of popular momentum ETFs with transparent, passive, and potentially lower-cost portfolios of simpler funds.

Attributing the Performance of Momentum ETFs to Simpler Factors

We analyzed iShares MSCI USA Momentum Factor ETF (MTUM) using the AlphaBetaWorks Statistical Equity Risk Model – a proven tool for forecasting portfolio risk and performance. We estimated monthly positions from regulatory filings, retrieved positions’ factor (systematic) exposures, and aggregated these. This produced a series of monthly portfolio exposures to simple investable risk factors such as Market, Sector, and Size. The factor exposures at the end of Month 1 and factor returns during Month 2 are used to calculate factor returns during Month 2 and any residual (security-selection, idiosyncratic, stock-specific) returns un-attributable to factors.

There are only two ways for a fund to deviate from a passive portfolio: residual returns un-attributable to factors and factor timing returns due to variation in factor exposures over time. We define and measure both components below.

iShares MSCI USA Momentum Factor (MTUM): Performance Attribution

We used iShares MSCI USA Momentum Factor (MTUM) as an example of a practical implementation of a theoretical momentum portfolio. MTUM is a $1.1bil ETF that seeks to track an index of U.S. large- and mid-cap stocks with high momentum. The fund’s turnover, around 100% annually, is about half that of the theoretical momentum factor.

iShares MSCI USA Momentum Factor (MTUM): Factor Exposures

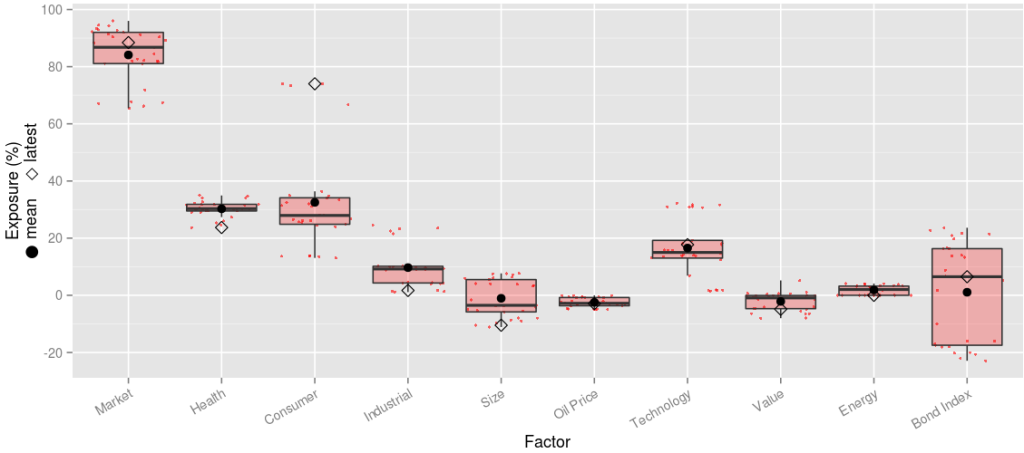
The following factors are responsible for most of the historical returns and variance of MTUM:

Chart of exposures to the risk factors contributing most to the historical performance of MSCI USA Momentum Factor (MTUM)

MSCI USA Momentum Factor (MTUM): Significant Historical Factor Exposures

Latest Mean Min. Max.
Market 88.44 84.12 65.46 96.03
Health 23.73 30.28 23.73 34.94
Consumer 74.02 32.53 13.10 74.06
Industrial 1.69 9.71 1.13 24.51
Size -10.47 -1.04 -11.09 7.67
Oil Price -2.90 -2.45 -4.94 -0.04
Technology 17.72 16.56 1.50 32.29
Value -4.86 -2.13 -8.00 5.20
Energy 0.00 1.86 0.00 4.12
Bond Index 6.51 1.08 -22.90 23.64

iShares MSCI USA Momentum Factor (MTUM): Active Return

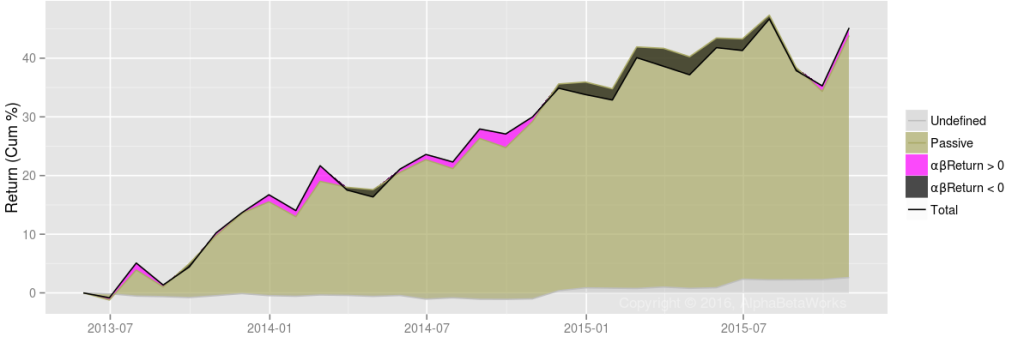
To replicate MTUM with simple non-momentum factors, one can use a passive portfolio of these simple non-momentum factors with MTUM’s mean exposures as weights. This portfolio defined the Passive Return in the following chart. Active return, or αβReturn, is the performance in excess of this passive replicating portfolio. It is the active return due to residual stock performance and factor timing:

Chart of the cumulative historical active return from security selection and factor timing of MSCI USA Momentum Factor (MTUM)

MSCI USA Momentum Factor (MTUM): Cumulative Passive and Active Returns

MTUM’s performance closely tracks the passive replicating portfolio. Pearson’s correlation between Total Return and Passive Return is 0.96. Consequently, 93% of the variance of monthly returns is attributable to passive factor exposures, primarily to Market and Sector factors.

Once passive exposures to simpler factors have been removed, MTUM’s active return is negligible. Since MTUM’s launch, the cumulative return difference from such passive replicating portfolio has been approximately 1%:

2013 2014 2015 Total
Total Return 16.73 14.62 8.50 45.18
  Passive Return 16.06 16.48 4.55 41.34
  αβReturn 1.11 -2.46 2.54 1.12
    αReturn 3.91 0.05 0.29 4.27
    βReturn -2.71 -2.52 2.23 -3.05

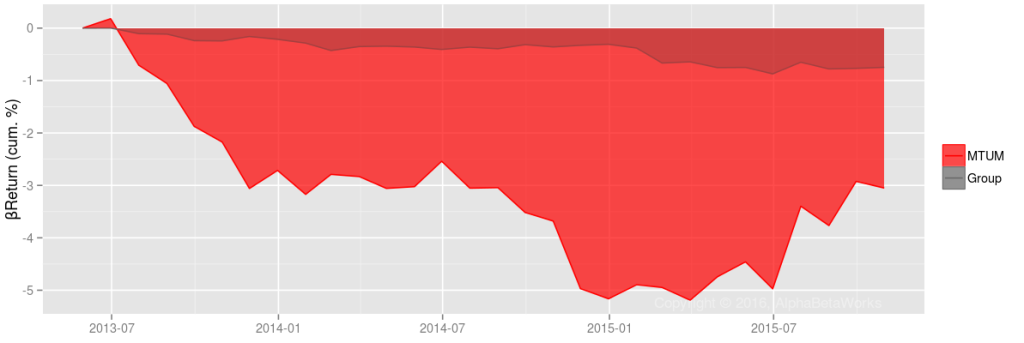
This active return can be further decomposed into security selection (αReturn) and factor timing (βReturn). These active return components generated low volatility, around 1% annually, mostly offsetting each other as illustrated below:

iShares MSCI USA Momentum Factor (MTUM): Active Return from Security Selection

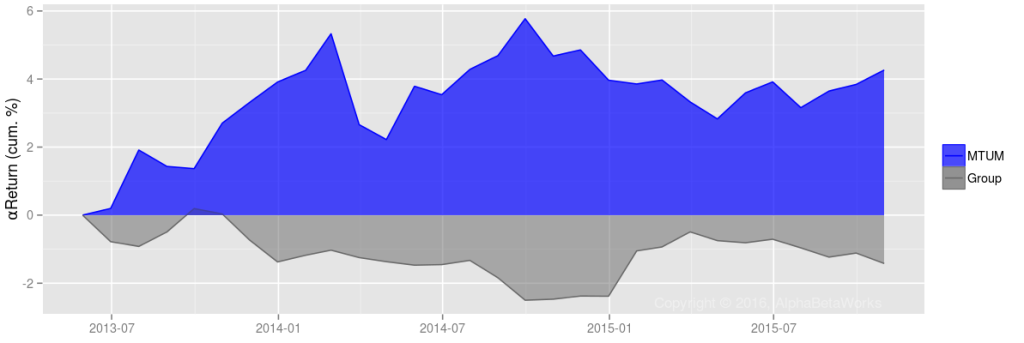
AlphaBetaWorks’ measure of residual security selection performance is αReturn – performance relative to a factor portfolio that matches the funds’ historical factor exposures. αReturn is the return a fund would have generated if markets had been flat. MTUM has generated approximately 4% cumulative αReturn, primarily in 2013, compared to roughly 1.5% decline for the average U.S. equity ETF:

Chart of the cumulative historical active return from security selection of MSCI USA Momentum Factor (MTUM)

MSCI USA Momentum Factor (MTUM): Cumulative Active Return from Security Selection

iShares MSCI USA Momentum Factor (MTUM): Active Return from Factor Timing

AlphaBetaWorks’ measure of factor timing performance is βReturn – performance due to variation in factor exposures. βReturn is the fund’s outperformance relative to a portfolio with the same mean, but constant, factor exposures as the fund. MTUM generates approximately -3% cumulative βReturn, compared to a roughly 1% decline for the average U.S. equity ETF:

Chart of the cumulative historical active return from factor timing of MSCI USA Momentum Factor (MTUM)

MSCI USA Momentum Factor (MTUM): Cumulative Active Return from Factor Timing

These low active returns are consistent with our earlier findings that many “smart beta” funds are merely high-beta and offer no value over portfolios of conventional dumb-beta funds. It is thus vital to test any new resident of the Factor Zoo to determine whether they are merely exotic breeds of its more boring residents.

Conclusion

  • Theoretical, or academic, momentum portfolios are not directly investable.
  • A popular momentum ETF, MSCI USA Momentum Factor (MTUM), did not deviate significantly from a passive portfolio of simpler non-momentum factors.
  • Investors may be able to achieve and surpass the performance of the popular momentum ETFs with transparent, passive, and potentially lower-cost portfolios of simpler index funds and ETFs.
The information herein is not represented or warranted to be accurate, correct, complete or timely.
Past performance is no guarantee of future results.
Copyright © 2012-2016, AlphaBetaWorks, a division of Alpha Beta Analytics, LLC. All rights reserved.
Content may not be republished without express written consent.

Hedge Funds’ Best and Worst Sectors

Due to the congestion of their investor base, crowded hedge fund stocks are volatile and vulnerable to mass selling. The risk-adjusted performance of consensus bets tends to disappoint. In two past pieces we illustrated the toll of crowding on exploration and production as well as internet companies. We also reviewed two specific crowded bets: SanDisk and eHealth.

While crowded hedge fund ideas do poorly most of the time, they don’t always. Market efficiency varies across sectors, and some industries are more analytically tractable than others. In this article we survey the sectors with the best and worst hedge fund performance records. We will illustrate when investors should stay clear of crowded ideas and when they can embrace them.

Analyzing Hedge Fund Performance and Crowding

To explore performance and crowding we analyze hedge fund sector holdings (HF Sector Aggregate) relative to the Sector Market Portfolio (Sector Aggregate). HF Sector Aggregate is position-weighted, and Sector Aggregate is capitalization-weighted. This follows the approach of our earlier articles on aggregate and sector-specific hedge fund crowding.

Hedge Funds’ Worst Sector: Miscellaneous Metals and Mining

Historical Hedge Fund Performance: Miscellaneous Metals and Mining

Hedge funds’ worst security selection performance for the past ten years has been in the Miscellaneous Metals and Mining sector. The figure below plots historical HF Miscellaneous Metals and Mining Aggregate’s return. Factor return is due to systematic (market) risk. It is the return of a portfolio that replicates HF Sector Aggregate’s market risk. The blue area represents positive and the gray area represents negative risk-adjusted returns from security selection (αReturn).

Chart of the historical total, factor, and security selection performance of the Hedge Fund Miscellaneous Metals and Mining Sector Aggregate

Hedge Fund Miscellaneous Metals and Mining Sector Aggregate Historical Performance

Even without adjusting for risk, crowded bets have done poorly. They consistently underperformed the factor portfolio, missing out on over 300% in gains.

The HF Sector Aggregate’s risk-adjusted return from security selection (αReturn) is the return it would have generated if markets were flat – all market effects on performance have been eliminated. This idiosyncratic performance of the crowded portfolio is a decline of 87%. Crowded bets in this sector are especially dangerous, given their persistently poor performance:

Chart of the historical security selection performance of the Hedge Fund Miscellaneous Metals and Mining Sector Aggregate

Hedge Fund Miscellaneous Metals and Mining Sector Aggregate Historical Security Selection Performance

In this sector, hedge funds lost $900 million to other market participants. In commodity industries, the recipients of this value transfer are usually private investors and insiders.

Current Hedge Fund Bets: Miscellaneous Metals and Mining

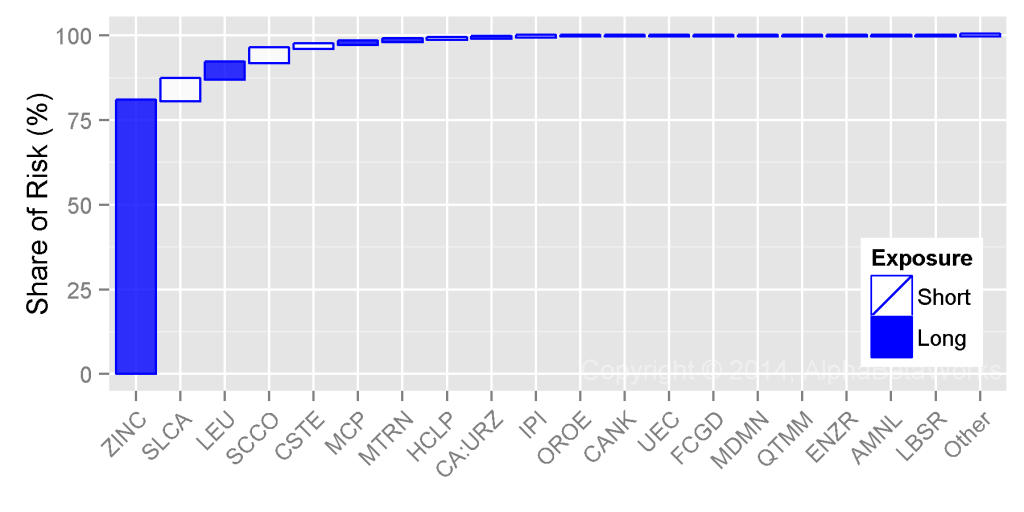
The following stocks contributed most to the relative residual (security-specific) risk of the HF Miscellaneous Metals and Mining Sector Aggregate as of Q3 2014. Blue bars represent long (overweight) exposures relative to the Sector Aggregate. White bars represent short (underweight) exposures. Bar height represents contribution to relative stock-specific risk:

Chart of the top contributors' contribution to the Hedge Fund Miscellaneous Metals and Mining Sector Aggregate's risk

Crowded Hedge Fund Miscellaneous Metals and Mining Sector Bets

The following table contains detailed data on these crowded bets. Large and illiquid long (overweight) bets are most at risk of volatility, mass liquidation, and underperformance:

Exposure (%) Net Exposure Share of Risk (%)
HF Sector Aggr. Sector Aggr. % $mil Days of Trading
ZINC Horsehead Holding Corp. 72.74 2.41 70.33 148.5 15.6 80.55
SLCA U.S. Silica Holdings, Inc. 0.30 9.68 -9.39 -19.8 -0.2 6.45
LEU Centrus Energy Corp. Class A 4.54 0.22 4.32 9.1 17.2 4.85
SCCO Southern Copper Corporation 7.69 70.19 -62.51 -132.0 -2.3 4.18
CSTE CaesarStone Sdot-Yam Ltd. 0.00 5.18 -5.18 -10.9 -0.8 1.14
MCP Molycorp, Inc. 3.84 0.84 3.01 6.3 1.7 0.92
MTRN Materion Corporation 7.15 1.82 5.33 11.3 2.1 0.69
HCLP Hi-Crush Partners LP 0.49 2.90 -2.41 -5.1 -0.2 0.35
CA:URZ Uranerz Energy Corporation 2.00 0.27 1.72 3.6 11.7 0.29
IPI Intrepid Potash, Inc. 0.36 3.38 -3.02 -6.4 -0.5 0.22
OROE Oro East Mining, Inc. 0.00 0.52 -0.52 -1.1 -39.9 0.05
CANK Cannabis Kinetics Corp. 0.00 0.10 -0.10 -0.2 -2.7 0.05
UEC Uranium Energy Corp. 0.00 0.33 -0.33 -0.7 -0.4 0.02
FCGD First Colombia Gold Corp. 0.00 0.09 -0.09 -0.2 -19.0 0.02
MDMN Medinah Minerals, Inc. 0.00 0.16 -0.16 -0.3 -4.8 0.01
QTMM Quantum Materials Corp. 0.00 0.13 -0.13 -0.3 -6.3 0.00
ENZR Energizer Resources Inc. 0.00 0.12 -0.12 -0.3 -11.7 0.00
AMNL Applied Minerals, Inc. 0.00 0.20 -0.20 -0.4 -18.5 0.00
LBSR Liberty Star Uranium and Metals Corp. 0.00 0.03 -0.03 -0.1 -4.9 0.00
Other Positions 0.61 0.21
Total 100.00

Hedge Funds’ Best Sector: Real Estate Development

Historical Hedge Fund Performance: Real Estate Development

Hedge funds’ best security selection performance has been in the Real Estate Development Sector. The figure below plots the historical return of HF Real Estate Development Aggregate. Factor return and αReturn are defined as above:

Chart of the historical total, factor, and security selection returns of the Hedge Fund Real Estate Development Sector Aggregate

Hedge Fund Real Estate Development Sector Aggregate Historical Performance

Since 2004, the HF Sector Aggregate outperformed the portfolio with equivalent market risk by approximately 200%. In a flat market, HF Sector Aggregate would have gained approximately 180%:

Chart of the historical security selection (residual) return of the Hedge Fund Real Estate Development Sector Aggregate

Hedge Fund Real Estate Development Sector Aggregate Historical Security Selection Performance

In this sector, hedge funds gained $1 billion at the expense of other market participants. The Real Estate Development Sector appears less efficient but tractable, providing hedge funds with consistent stock picking gains.

Current Hedge Fund Real Estate Development Bets

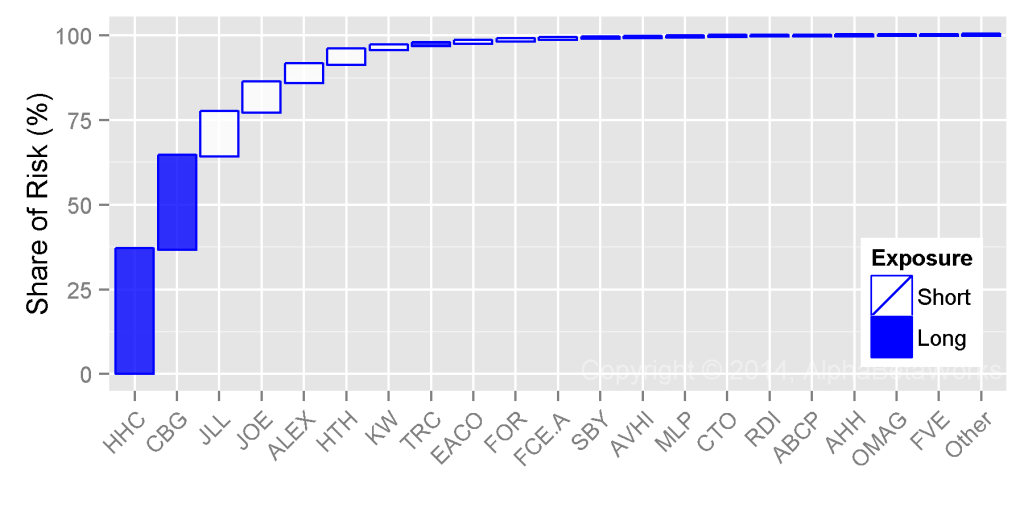
The following stocks contributed most to the relative residual (security-specific) risk of the HF Real Estate Development Sector Aggregate as of Q3 2014:

Chart of the contribution to the residual (stock-specific) risk of the various hedge fund Crowded Hedge Fund Real Estate Development Sector bets

Crowded Hedge Fund Real Estate Development Sector Bets

The following table contains detailed data on these crowded bets. Since in this sector hedge funds are “smart money,” large long (overweight) bets are most likely to outperform and large short (underweight) bets at most likely to do poorly:

Exposure (%) Net Exposure Share of Risk (%)
HF Sector Aggr. Sector Aggr. % $mil Days of Trading
HHC Howard Hughes Corporation 28.47 15.98 12.49 326.5 17.5 36.73
CBG CBRE Group, Inc. Class A 52.28 26.54 25.74 672.7 10.8 27.58
JLL Jones Lang LaSalle Incorporated 0.14 15.21 -15.07 -393.9 -8.5 12.86
JOE St. Joe Company 0.04 4.94 -4.91 -128.2 -13.5 8.82
ALEX Alexander & Baldwin, Inc. 0.00 4.71 -4.71 -123.2 -13.5 5.38
HTH Hilltop Holdings Inc. 1.35 4.86 -3.51 -91.8 -18.3 4.29
KW Kennedy-Wilson Holdings, Inc. 3.60 6.11 -2.51 -65.6 -7.6 1.19
TRC Tejon Ranch Co. 3.36 1.55 1.81 47.2 37.9 0.77
EACO EACO Corporation 0.00 0.22 -0.22 -5.7 -436.1 0.65
FOR Forestar Group Inc. 0.62 1.66 -1.05 -27.3 -5.3 0.42
FCE.A Forest City Enterprises, Inc. Class A 8.78 10.56 -1.78 -46.5 -1.9 0.35
SBY Silver Bay Realty Trust Corp. 0.07 1.68 -1.61 -42.0 -8.4 0.23
AVHI A V Homes Inc 0.26 0.87 -0.61 -15.8 -28.7 0.20
MLP Maui Land & Pineapple Company, Inc. 0.00 0.29 -0.29 -7.5 -132.0 0.10
CTO Consolidated-Tomoka Land Co. 0.16 0.77 -0.61 -15.9 -24.5 0.09
RDI Reading International, Inc. Class A 0.02 0.54 -0.52 -13.7 -14.2 0.08
ABCP AmBase Corporation 0.00 0.15 -0.15 -3.8 -130.1 0.06
AHH Armada Hoffler Properties, Inc. 0.00 0.59 -0.59 -15.5 -9.4 0.06
OMAG Omagine, Inc. 0.00 0.07 -0.07 -1.9 -24.7 0.05
FVE Five Star Quality Care, Inc. 0.26 0.49 -0.23 -6.1 -5.1 0.04
Other Positions 0.01 0.07
Total 100.00

Real Estate Development is not the only sector where hedge funds excel. Crowded Coal, Hotels, and Forest Product sector ideas have also done well. Skills vary within each sector: The most skilled funds persistently generate returns in excess of the crowd, while the least skilled funds persistently fall short. Performance analytics built on robust risk models help investors and allocators reliably identify each.

Conclusions

  • With proper data, attention to hedge fund crowding prevents “unexpected” volatility and losses.
  • Market efficiency and tractability vary across sectors – crowded hedge fund bets do poorly in most sectors, but do well in some.
  • Investors should avoid crowded ideas in sectors of persistent hedge fund underperformance, such as Miscellaneous Metals and Mining.
  • Investors can embrace crowded ideas in sectors of persistent hedge fund outperformance, such as Real Estate Development.
  • Funds with significant and persistent stock picking skills exist in most sectors, even those with generally poor hedge fund performance. AlphaBetaWorks’ Skill Analytics identify best overall and sector-specific stock pickers.
The information herein is not represented or warranted to be accurate, correct, complete or timely.
Past performance is no guarantee of future results.
Copyright © 2012-2015, AlphaBetaWorks, a division of Alpha Beta Analytics, LLC. All rights reserved.
Content may not be republished without express written consent.

Upgrading Fund Active Returns

And Not Missing Out

Maybe your fund took extra risk to keep up with its benchmark. Maybe your fund should have made more – much more – given the risks it took. By the time market volatility reveals underlying exposures, it may be too late to avoid severe losses. There is a better way: Investors can continuously monitor a fund’s risk, the returns it should be generating, and the value it creates. This value should matter most to investors and allocators. Regrettably, most fund analysis tools and services pay no attention to it.

To illustrate, we analyze two funds: one that did much worse than it should have, and one that did better.

PRSCX – Negative Active Returns

The T. Rowe Price Science & Technology Fund (PRSCX) manages approximately $3 billion. This fund generally tracks its benchmark and it gets 3 star rating from a popular service. Notwithstanding this, PRSCX has produced persistently negative active returns. Given its historical risk, PRSCX should have made investors far more money: Over the past ten years, an investor would have made 50-80% more owning a passive portfolio with PRSCX’s risk profile.

Chart of the historical cumulative passive and active returns of T. Rowe Price Science & Technology Fund (PRSCX)

T. Rowe Price Science & Technology Fund (PRSCX) – Passive and Active Return History

While we seem to bolster arguments for passive investing, reality is more complex: Active returns (both positive and negative) persist over time. Thus, upgrading from PRSCX to a fund with persistently positive active returns is a superior move. We will provide one candidate.

PRSCX – Historical Risk

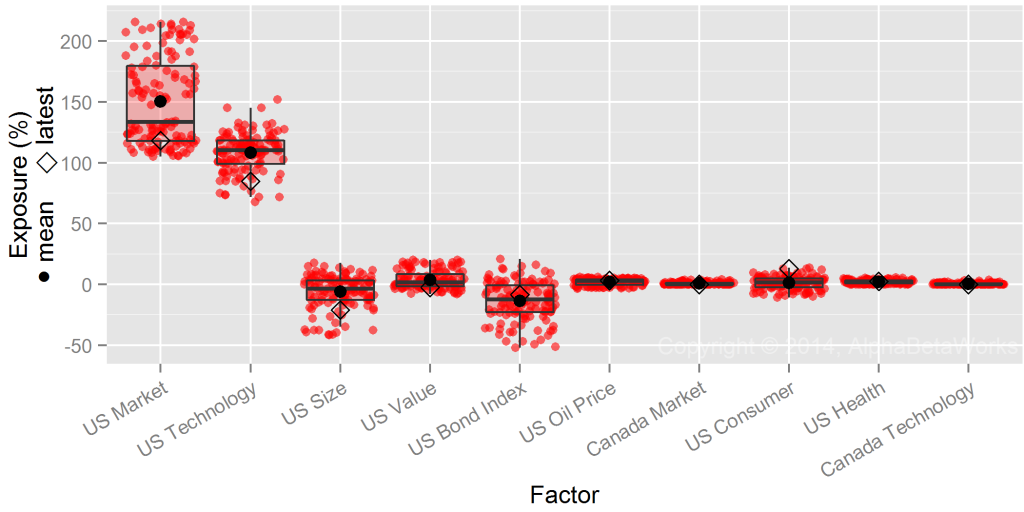
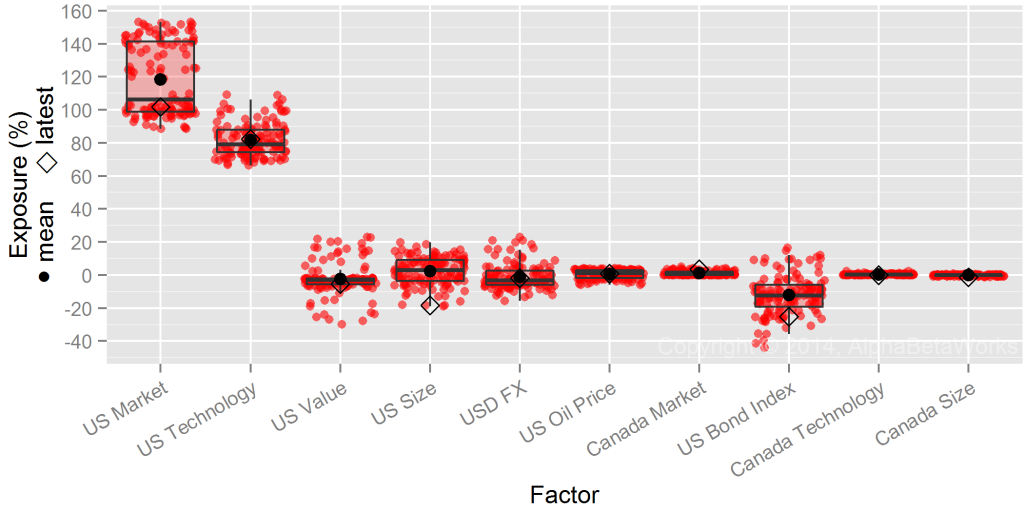
The chart below shows PRSCX’s historical risk (exposures to significant risk factors). The red dots indicate monthly exposures (as a percentage of assets) over the past 10 years; the black diamonds indicate latest exposures:

Chart of the historical exposures of T. Rowe Price Science & Technology Fund (PRSCX) to significant risk factors

T. Rowe Price Science & Technology Fund (PRSCX) – Exposure to Significant Risk Factors

PRSCX varied its exposures over time. U.S. Market is the most important exposure, reaching 200% (market beta of 2) at times. As expected for a technology fund, its U.S. Technology exposure has been near 100%. Also note PRSCX’s occasional short bond exposure. Many equity funds carry large hidden bond bets due to the risk profile of their equity holdings. Most investors and portfolio managers are not aware of these bets. Yet for these funds, bond risk is a key driver of portfolio returns and volatility.

PRSCX – Historical Active Returns

The above exposures define a passive replicating portfolio matching PRSCX’s risk. The fund manager’s job is to outperform this passive alternative by generating active returns.

To isolate active returns, we quantify passive factor exposures, estimate the passive return, and then calculate the remaining active return – αβReturn. We further break down αβReturn into risk-adjusted return from security selection, or stock picking (αReturn), and market timing (βReturn):

Component 2004 2005 2006 2007 2008 2009 2010 2011 2012 2013 2014
Total 1.6 2.46 7.1 11.88 -43.8 67.83 21.25 -4.51 6.25 43.7 9.39
Passive -0.69 1.4 5.45 19.26 -46.13 77.52 23.21 -3.42 20.36 51.54 13.61
αβReturn 0.98 -0.69 -2.2 -7.45 2.71 -11.61 -2.22 -8.24 -13.76 -14.14 -5.84
αReturn -1.95 -3.29 -6.45 -2.79 7.92 0.78 4.17 -12.31 -11.47 -4.54 1.11
βReturn 2.94 2.6 4.25 -4.66 -5.2 -12.39 -6.39 4.07 -2.29 -9.6 -6.95
Undefined 1.3 1.75 3.85 0.07 -0.38 1.92 0.26 7.15 -0.35 6.3 1.61

Note that we are unable to account for trades behind some of the returns – the “Undefined” component. It may be due to private securities or intra-period trading; it may be passive or active. Yet, even if we assume that all undefined returns above are active, PRSCX still delivered persistently negative αβReturn over the past ten years. Furthermore, the compounding of negative αβReturn leaves investors missing out on 50-80% in gains.

FSCSX – An Upgrade Option with Similar Historical Risk

While a passive portfolio would have been superior to PRSCX, it is not the best upgrade. Allocators and investors can do better owning a fund with consistently positive αβReturns, since αβReturns persist. One candidate is Fidelity Select Software & Computer Services Portfolio (FSCSX):

Chart of the historical exposures of Fidelity Select Software & Computer Services Portfolio (FSCSX) to significant risk factors

Fidelity Select Software & Computer Services Portfolio (FSCSX) – Exposure to Significant Risk Factors

Currently, FSCSX and PRCSX have similar exposures. AlphaBetaWorks’ risk analytics estimate the current annualized tracking error between the two funds at a 5.29% (about the same volatility as bonds, and less than one half of market volatility).

FSCSX – Historical Active Returns

FSCSX’s 3-year trailing average annual return of 23% is slightly ahead of PRSCX’s 20%. But most importantly, given its lower historical risk, FSCSX has delivered positive αβReturns versus PRSCX’s significantly negative ones. The chart below shows FSCSX’s ten-year performance. The purple area is the positive αβReturn. The gray area is FSCSX’s passive return:

Chart of the historical cumulative passive and active returns of Fidelity Select Software & Computer Services Portfolio (FSCSX)

Fidelity Select Software & Computer Services Portfolio (FSCSX) – Passive and Active Return History

FSCSX is superior to a passive portfolio with similar risk and to PRSCX. Mind you, this is not a sales pitch for FSCSX but merely a consequence of its positive αβReturn and αβReturn persistence.

Few fund investors and allocators possess the tools to quantify active returns. Yet, this knowledge is an essential competitive advantage, leading to improved client returns, client retention, and asset growth. Unfortunately, many are content to pick funds based on past nominal returns and to suffer the consequences: picking yesterday’s winners tends to pick tomorrow’s losers. AlphaBetaWorks spares clients from the data processing headaches, financial modeling, and statistical analysis of thousands of portfolios, delivering predictive risk and skill analytics on thousands of funds.

Conclusions

  • Analyzing a fund’s performance relative to a benchmark ignores the most important question: What should you have made given its risk?
  • Some mutual funds produce persistently negative active returns; others produce persistently positive active returns.
  • Upgrading from a fund with persistently negative active return (αβReturn) to a replicating passive portfolio tends to improve performance.
  • Upgrading from a passive portfolio to a fund with persistently positive αβReturn also tends to improve performance.
  • Tools that accurately estimate fund risk and active returns provide enduring competitive advantages for investors and professional allocators, leading to improved client returns, client retention, and asset growth.
The information herein is not represented or warranted to be accurate, correct, complete or timely.
Past performance is no guarantee of future results.
Copyright © 2012-2014, 
AlphaBetaWorks, a division of Alpha Beta Analytics, LLC. All rights reserved.
Content may not be republished without express written consent.