Category Archives: Mutual Funds

Upgrading Fund Active Returns

And Not Missing Out

Maybe your fund took extra risk to keep up with its benchmark. Maybe your fund should have made more – much more – given the risks it took. By the time market volatility reveals underlying exposures, it may be too late to avoid severe losses. There is a better way: Investors can continuously monitor a fund’s risk, the returns it should be generating, and the value it creates. This value should matter most to investors and allocators. Regrettably, most fund analysis tools and services pay no attention to it.

To illustrate, we analyze two funds: one that did much worse than it should have, and one that did better.

PRSCX – Negative Active Returns

The T. Rowe Price Science & Technology Fund (PRSCX) manages approximately $3 billion. This fund generally tracks its benchmark and it gets 3 star rating from a popular service. Notwithstanding this, PRSCX has produced persistently negative active returns. Given its historical risk, PRSCX should have made investors far more money: Over the past ten years, an investor would have made 50-80% more owning a passive portfolio with PRSCX’s risk profile.

Chart of the historical cumulative passive and active returns of T. Rowe Price Science & Technology Fund (PRSCX)

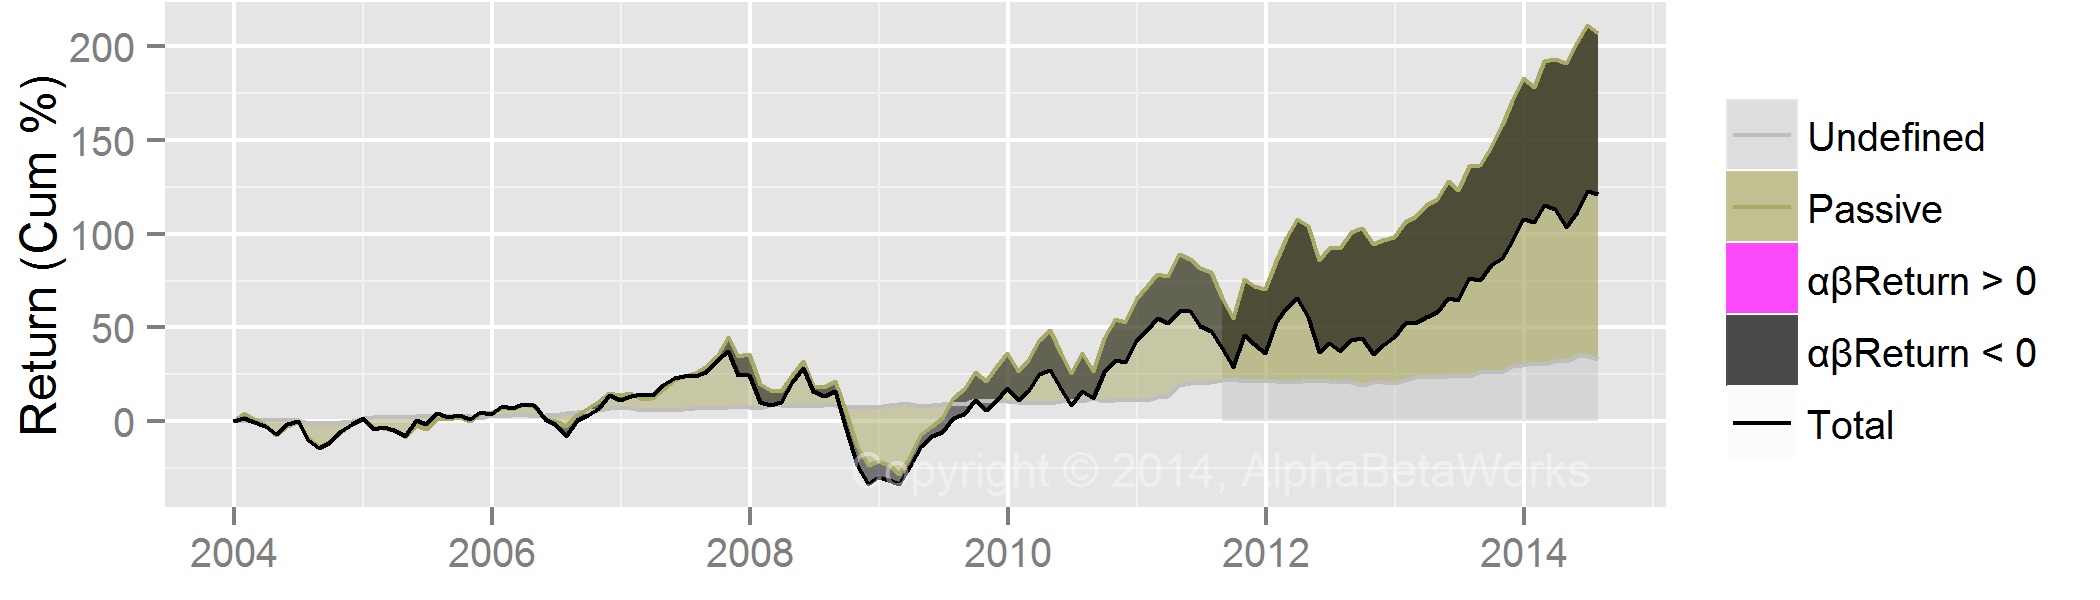
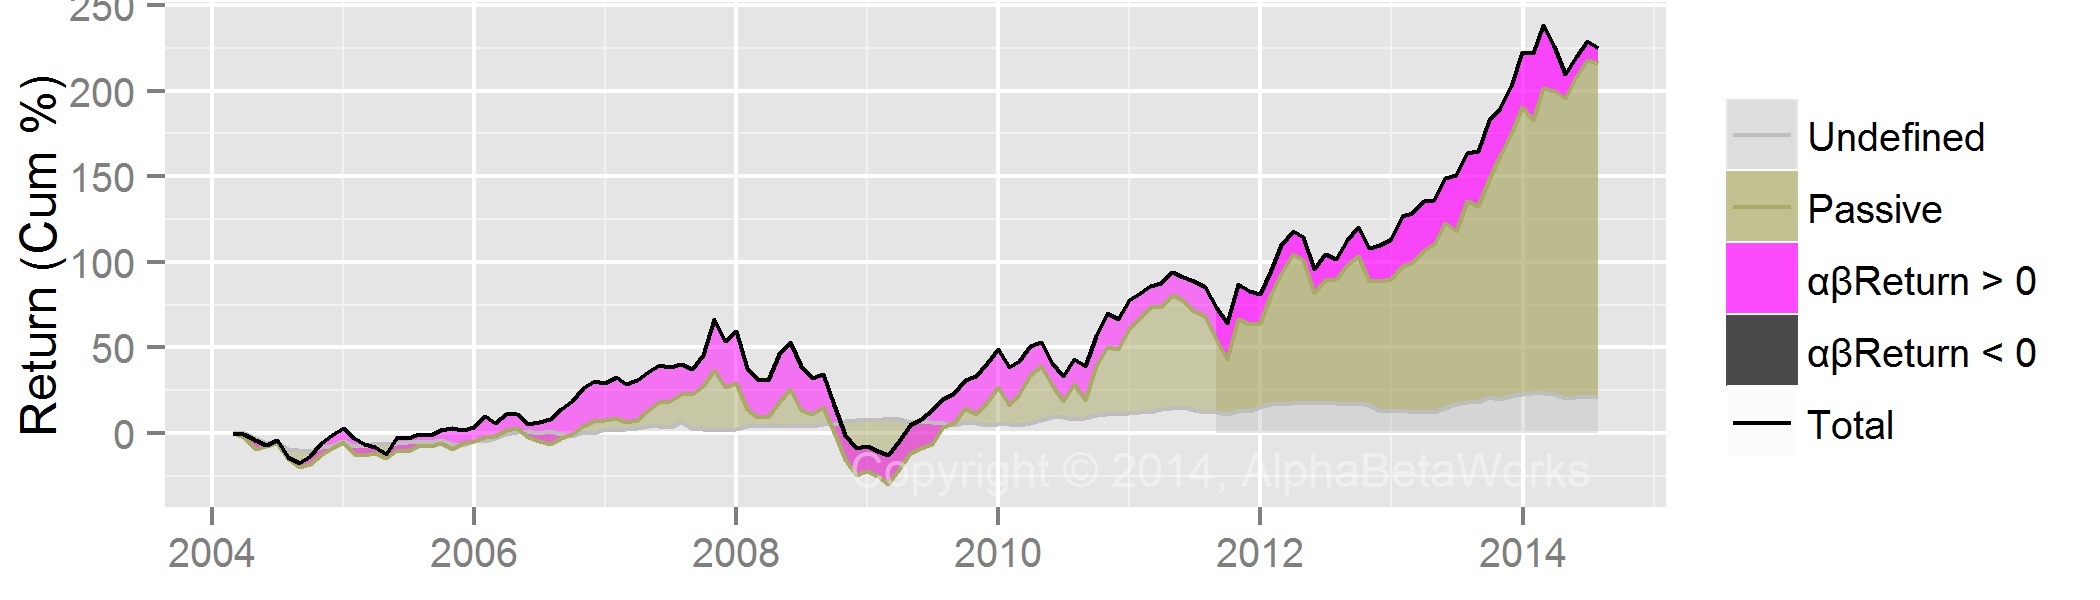
T. Rowe Price Science & Technology Fund (PRSCX) – Passive and Active Return History

While we seem to bolster arguments for passive investing, reality is more complex: Active returns (both positive and negative) persist over time. Thus, upgrading from PRSCX to a fund with persistently positive active returns is a superior move. We will provide one candidate.

PRSCX – Historical Risk

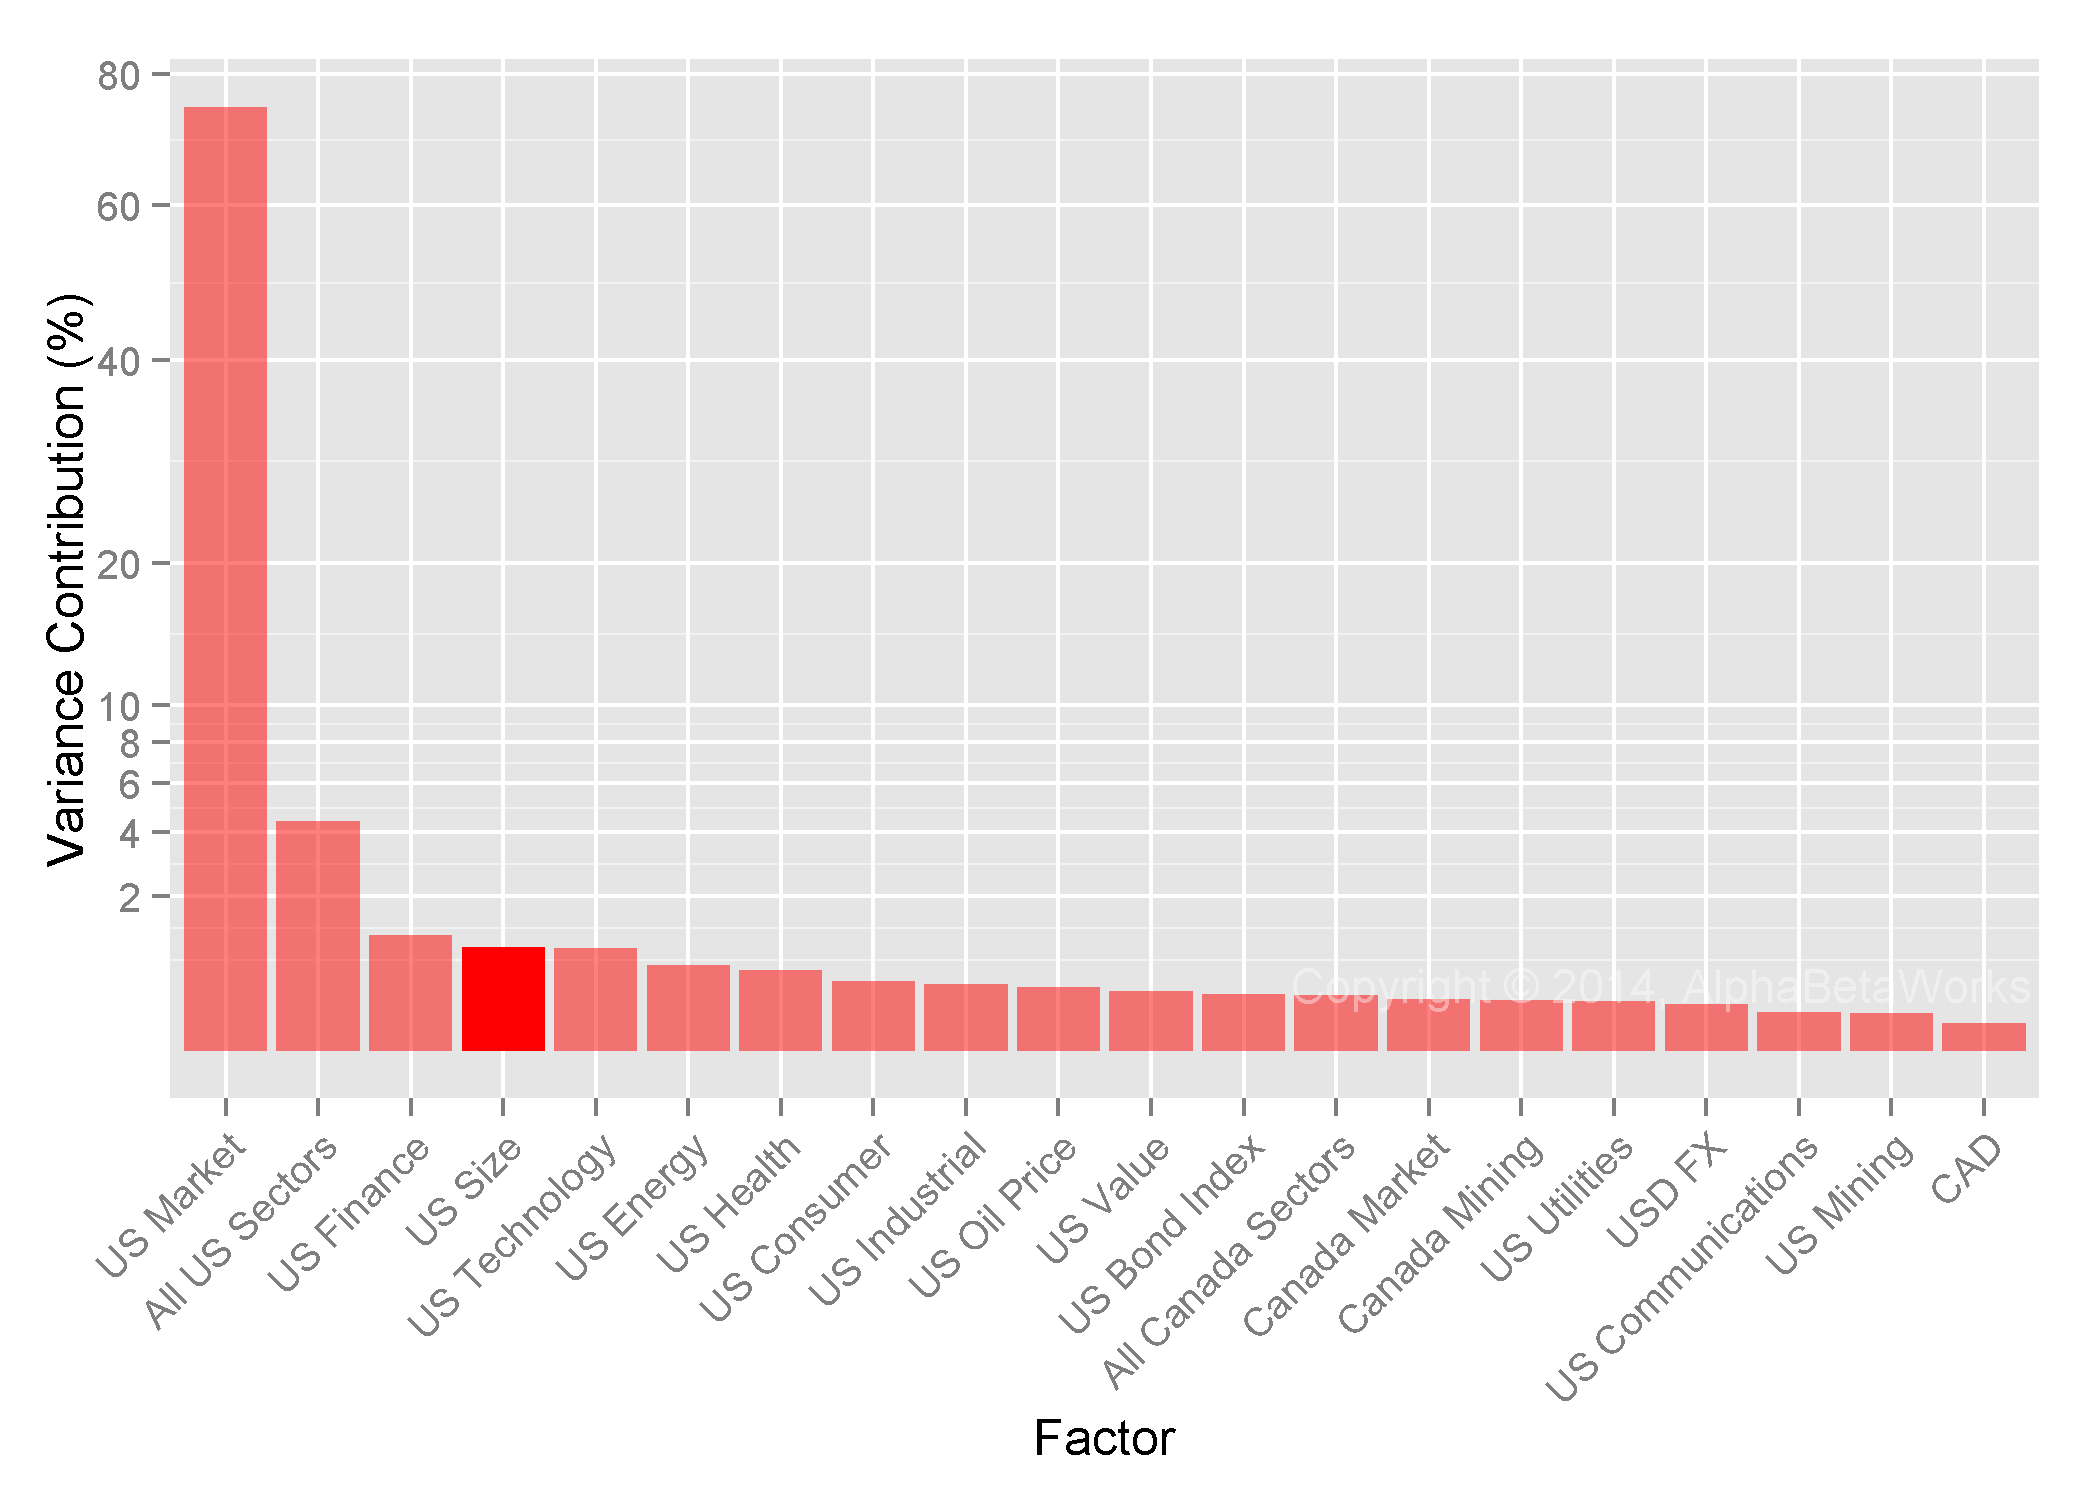
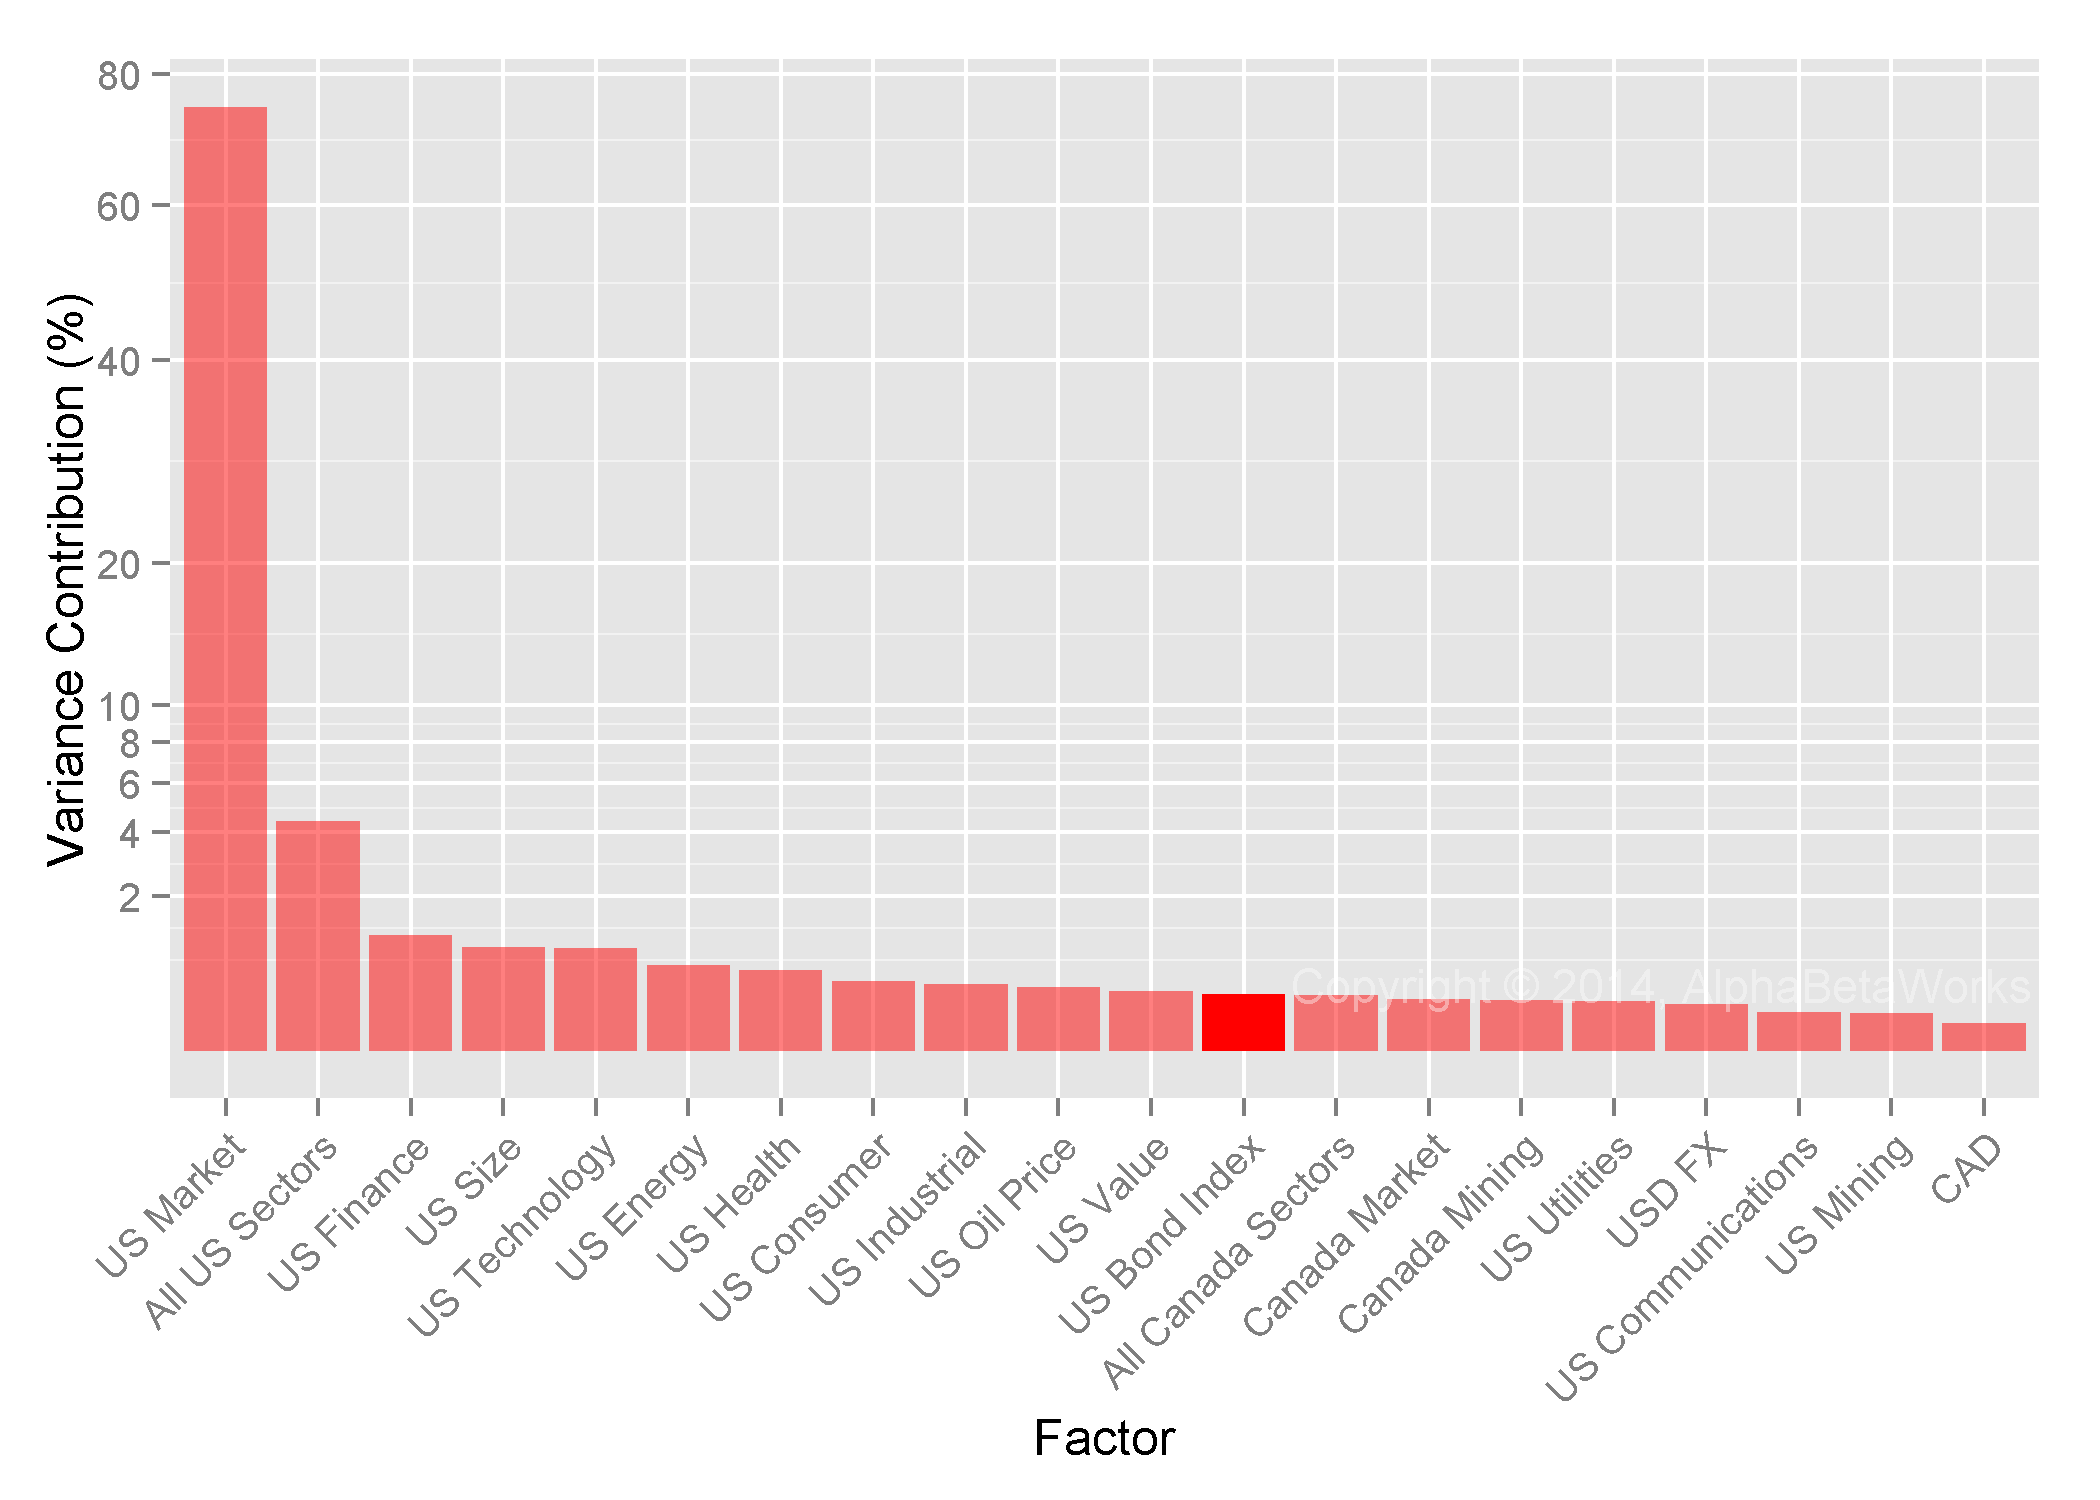
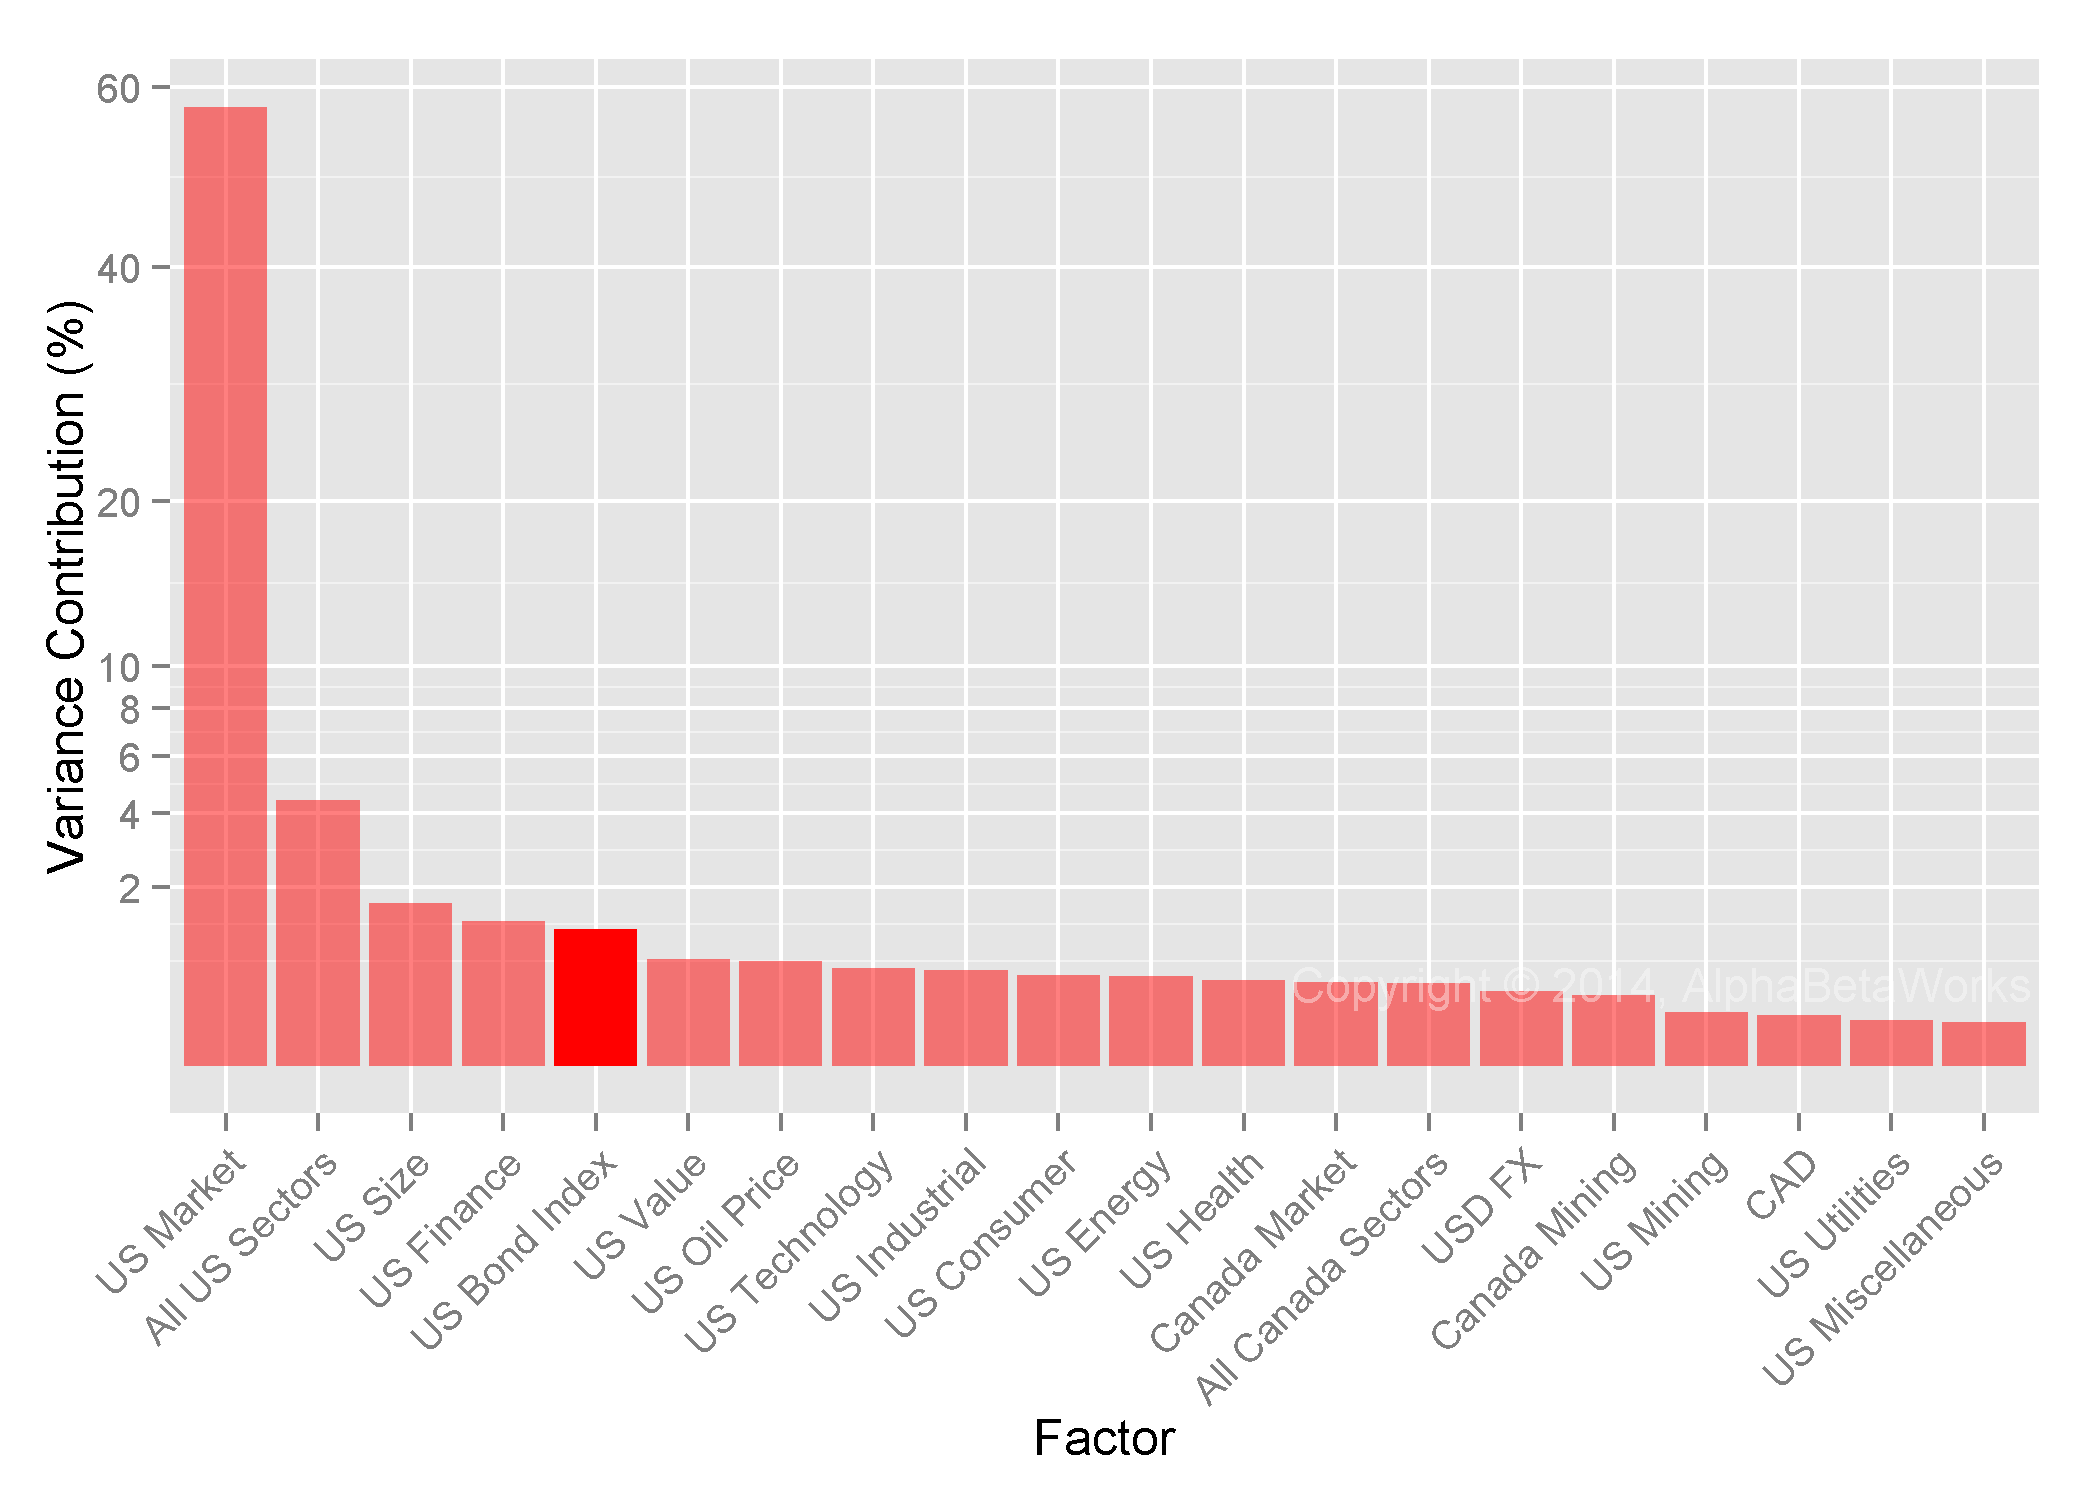
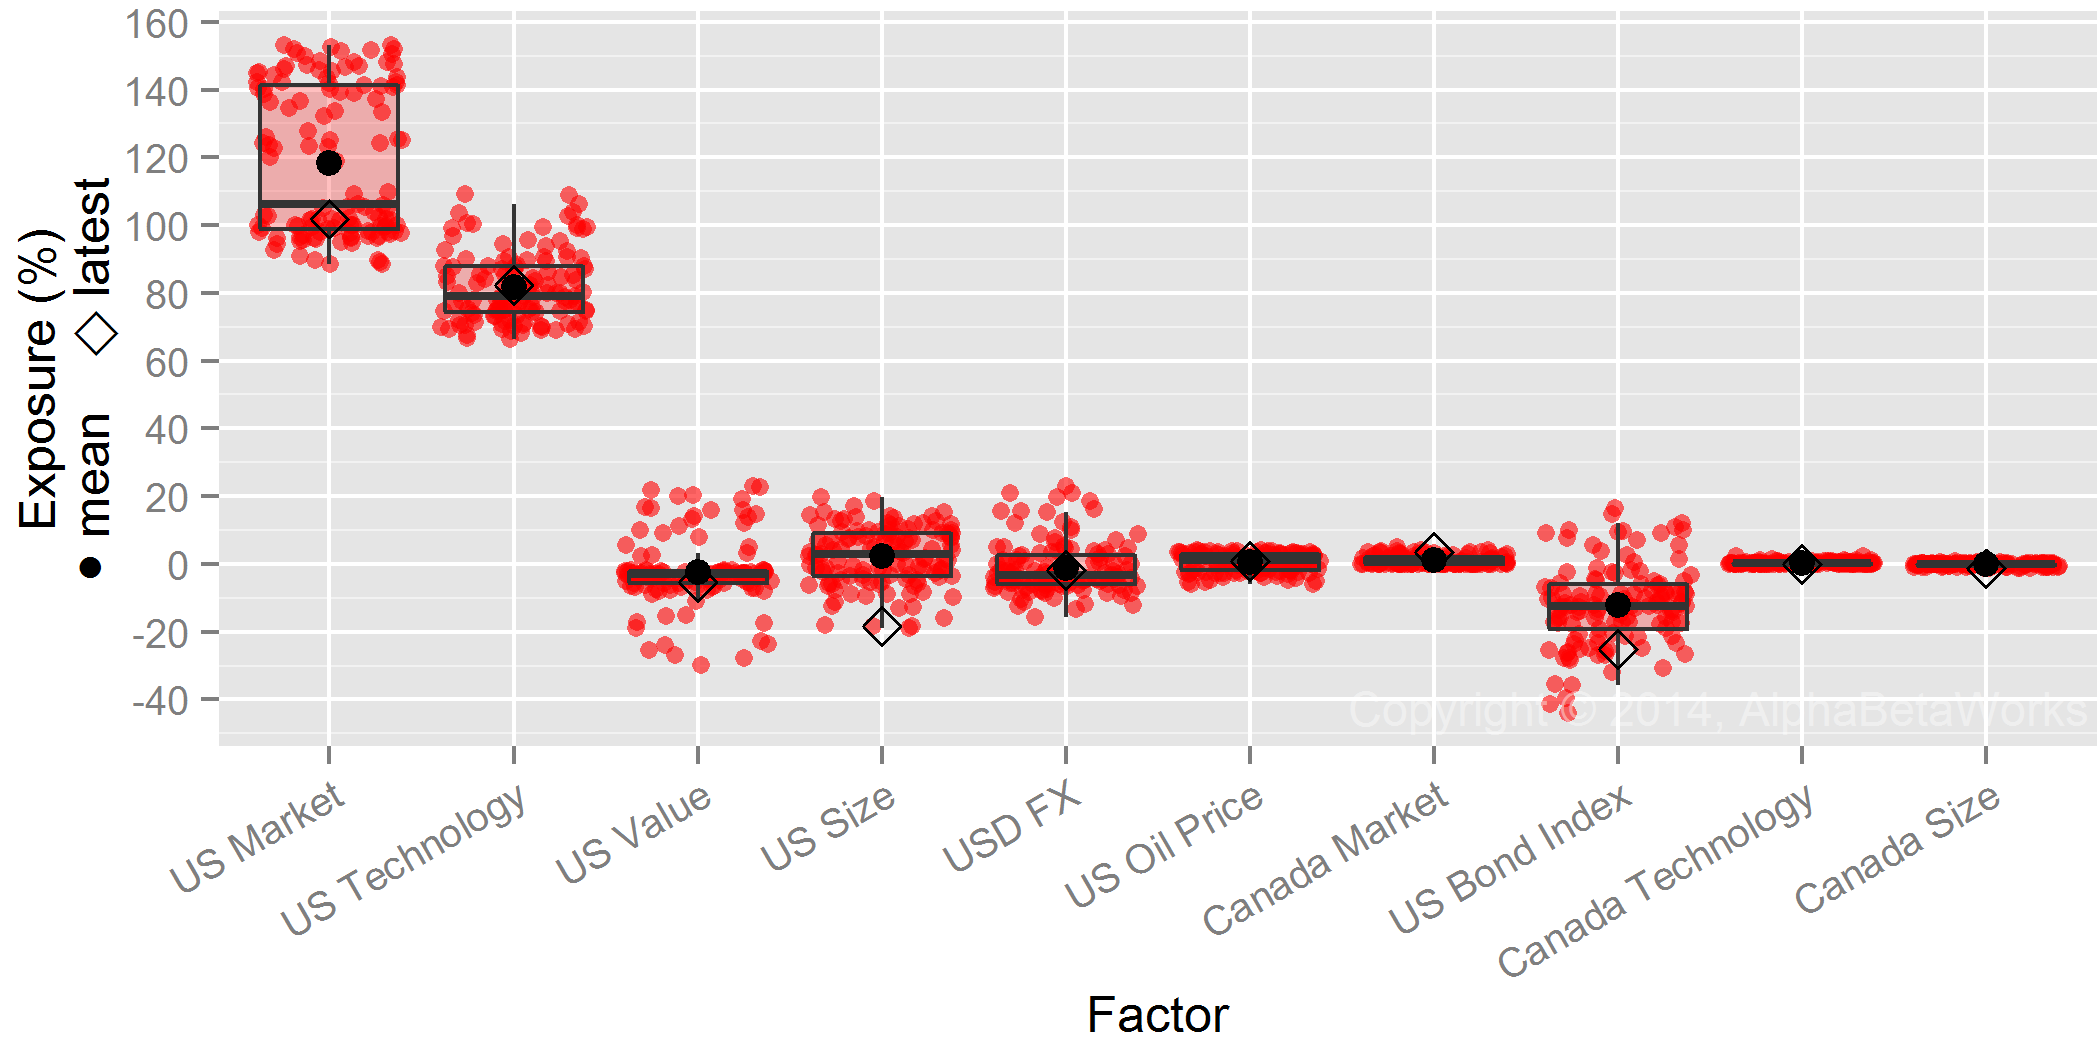
The chart below shows PRSCX’s historical risk (exposures to significant risk factors). The red dots indicate monthly exposures (as a percentage of assets) over the past 10 years; the black diamonds indicate latest exposures:

Chart of the historical exposures of T. Rowe Price Science & Technology Fund (PRSCX) to significant risk factors

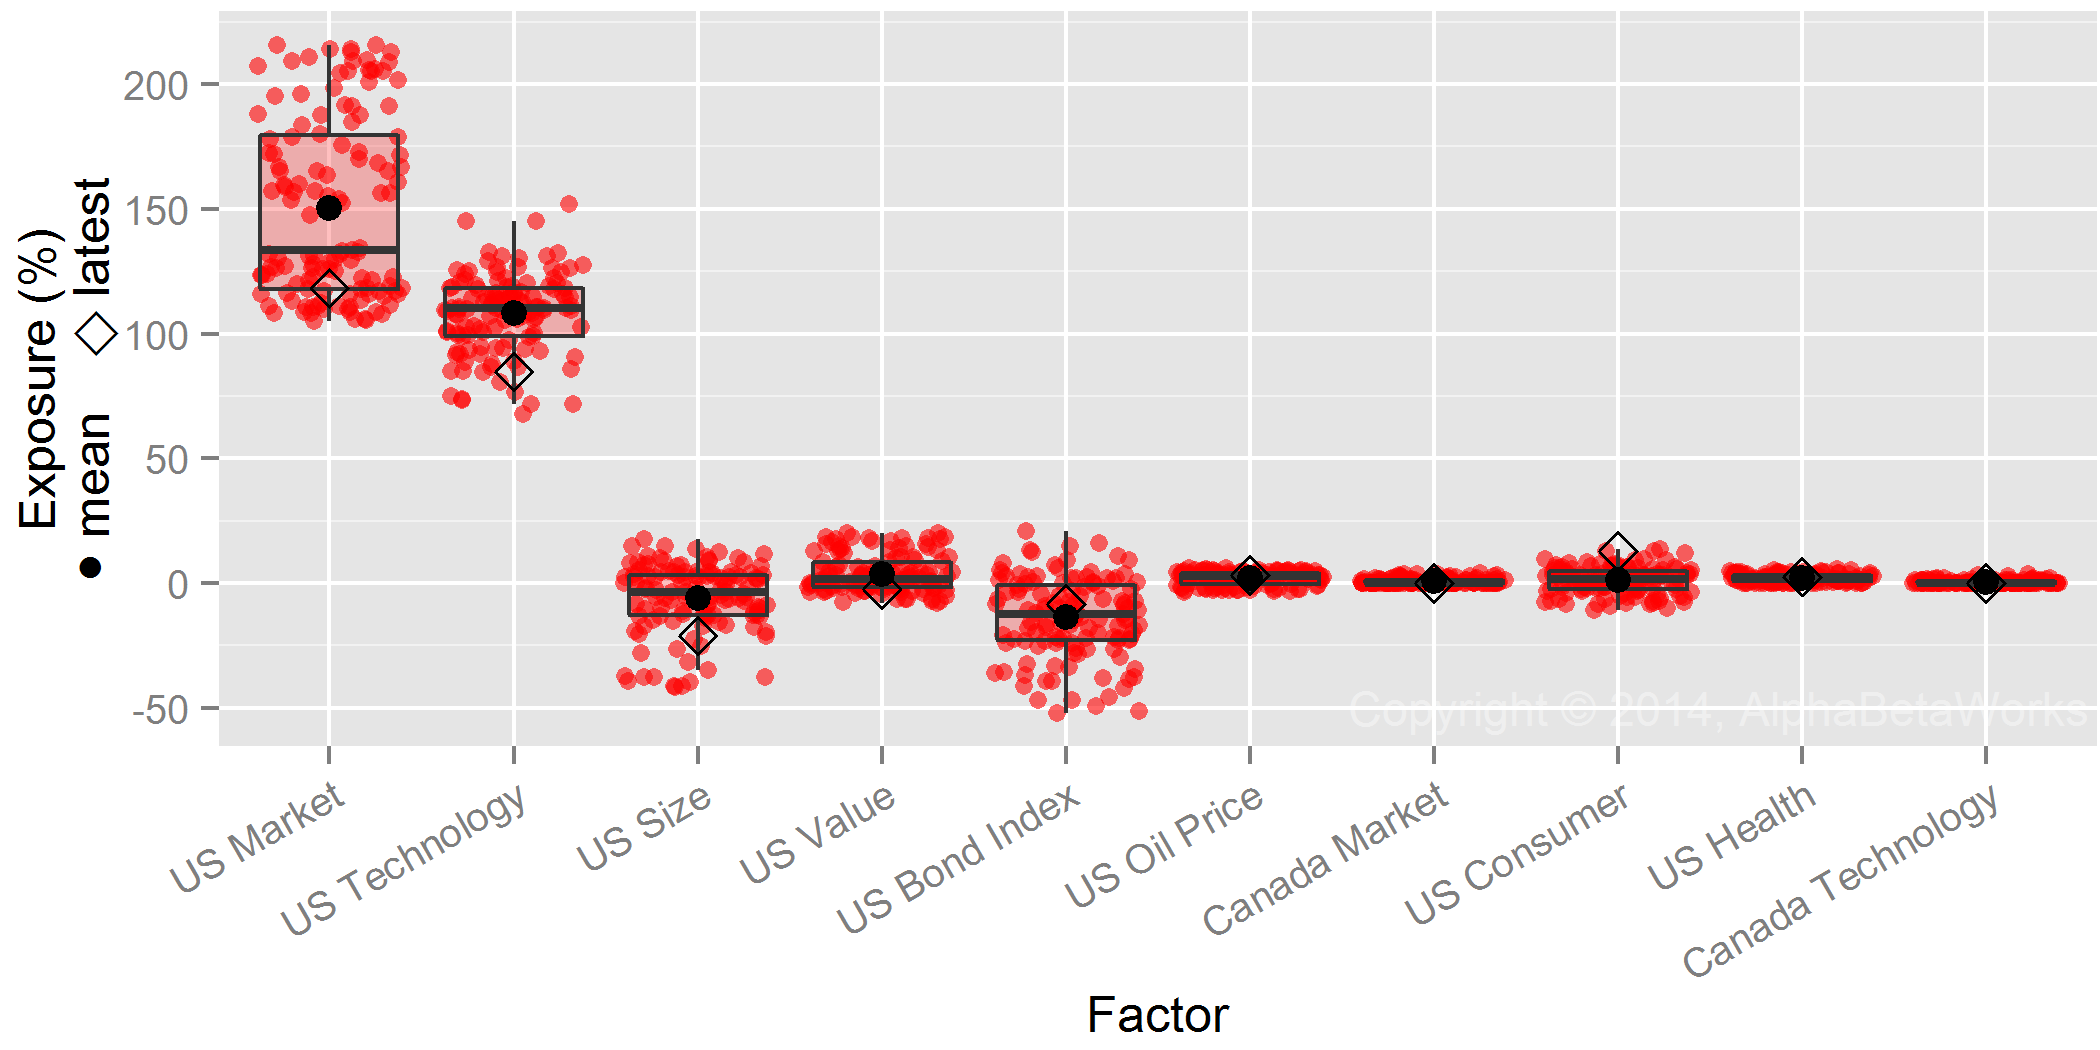
T. Rowe Price Science & Technology Fund (PRSCX) – Exposure to Significant Risk Factors

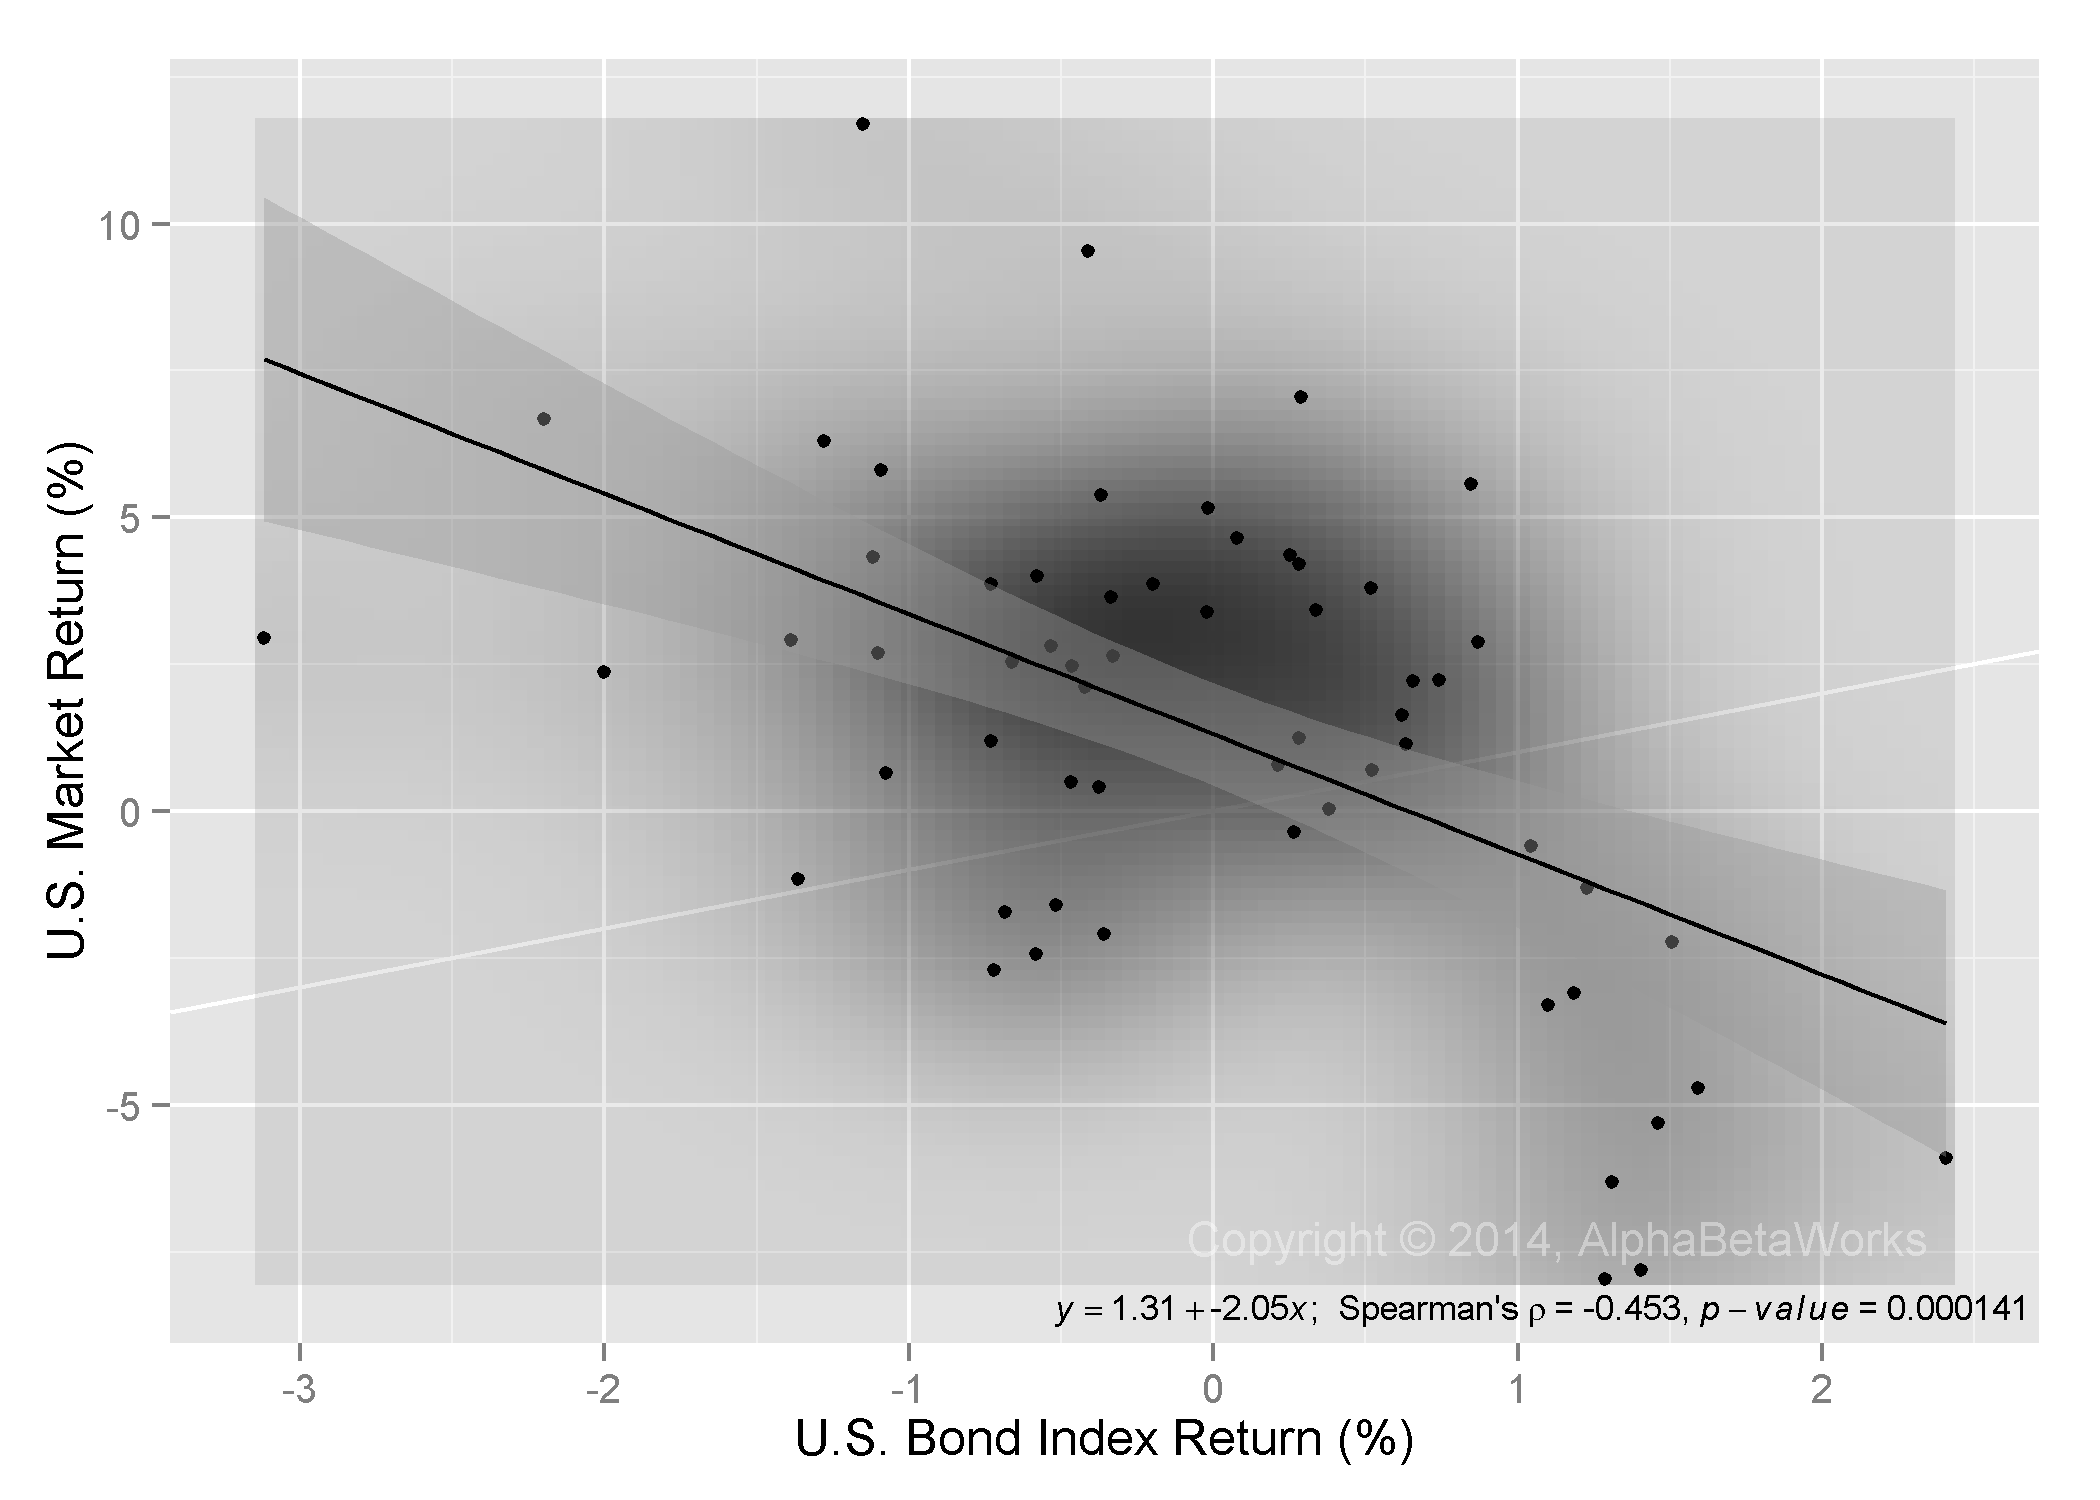
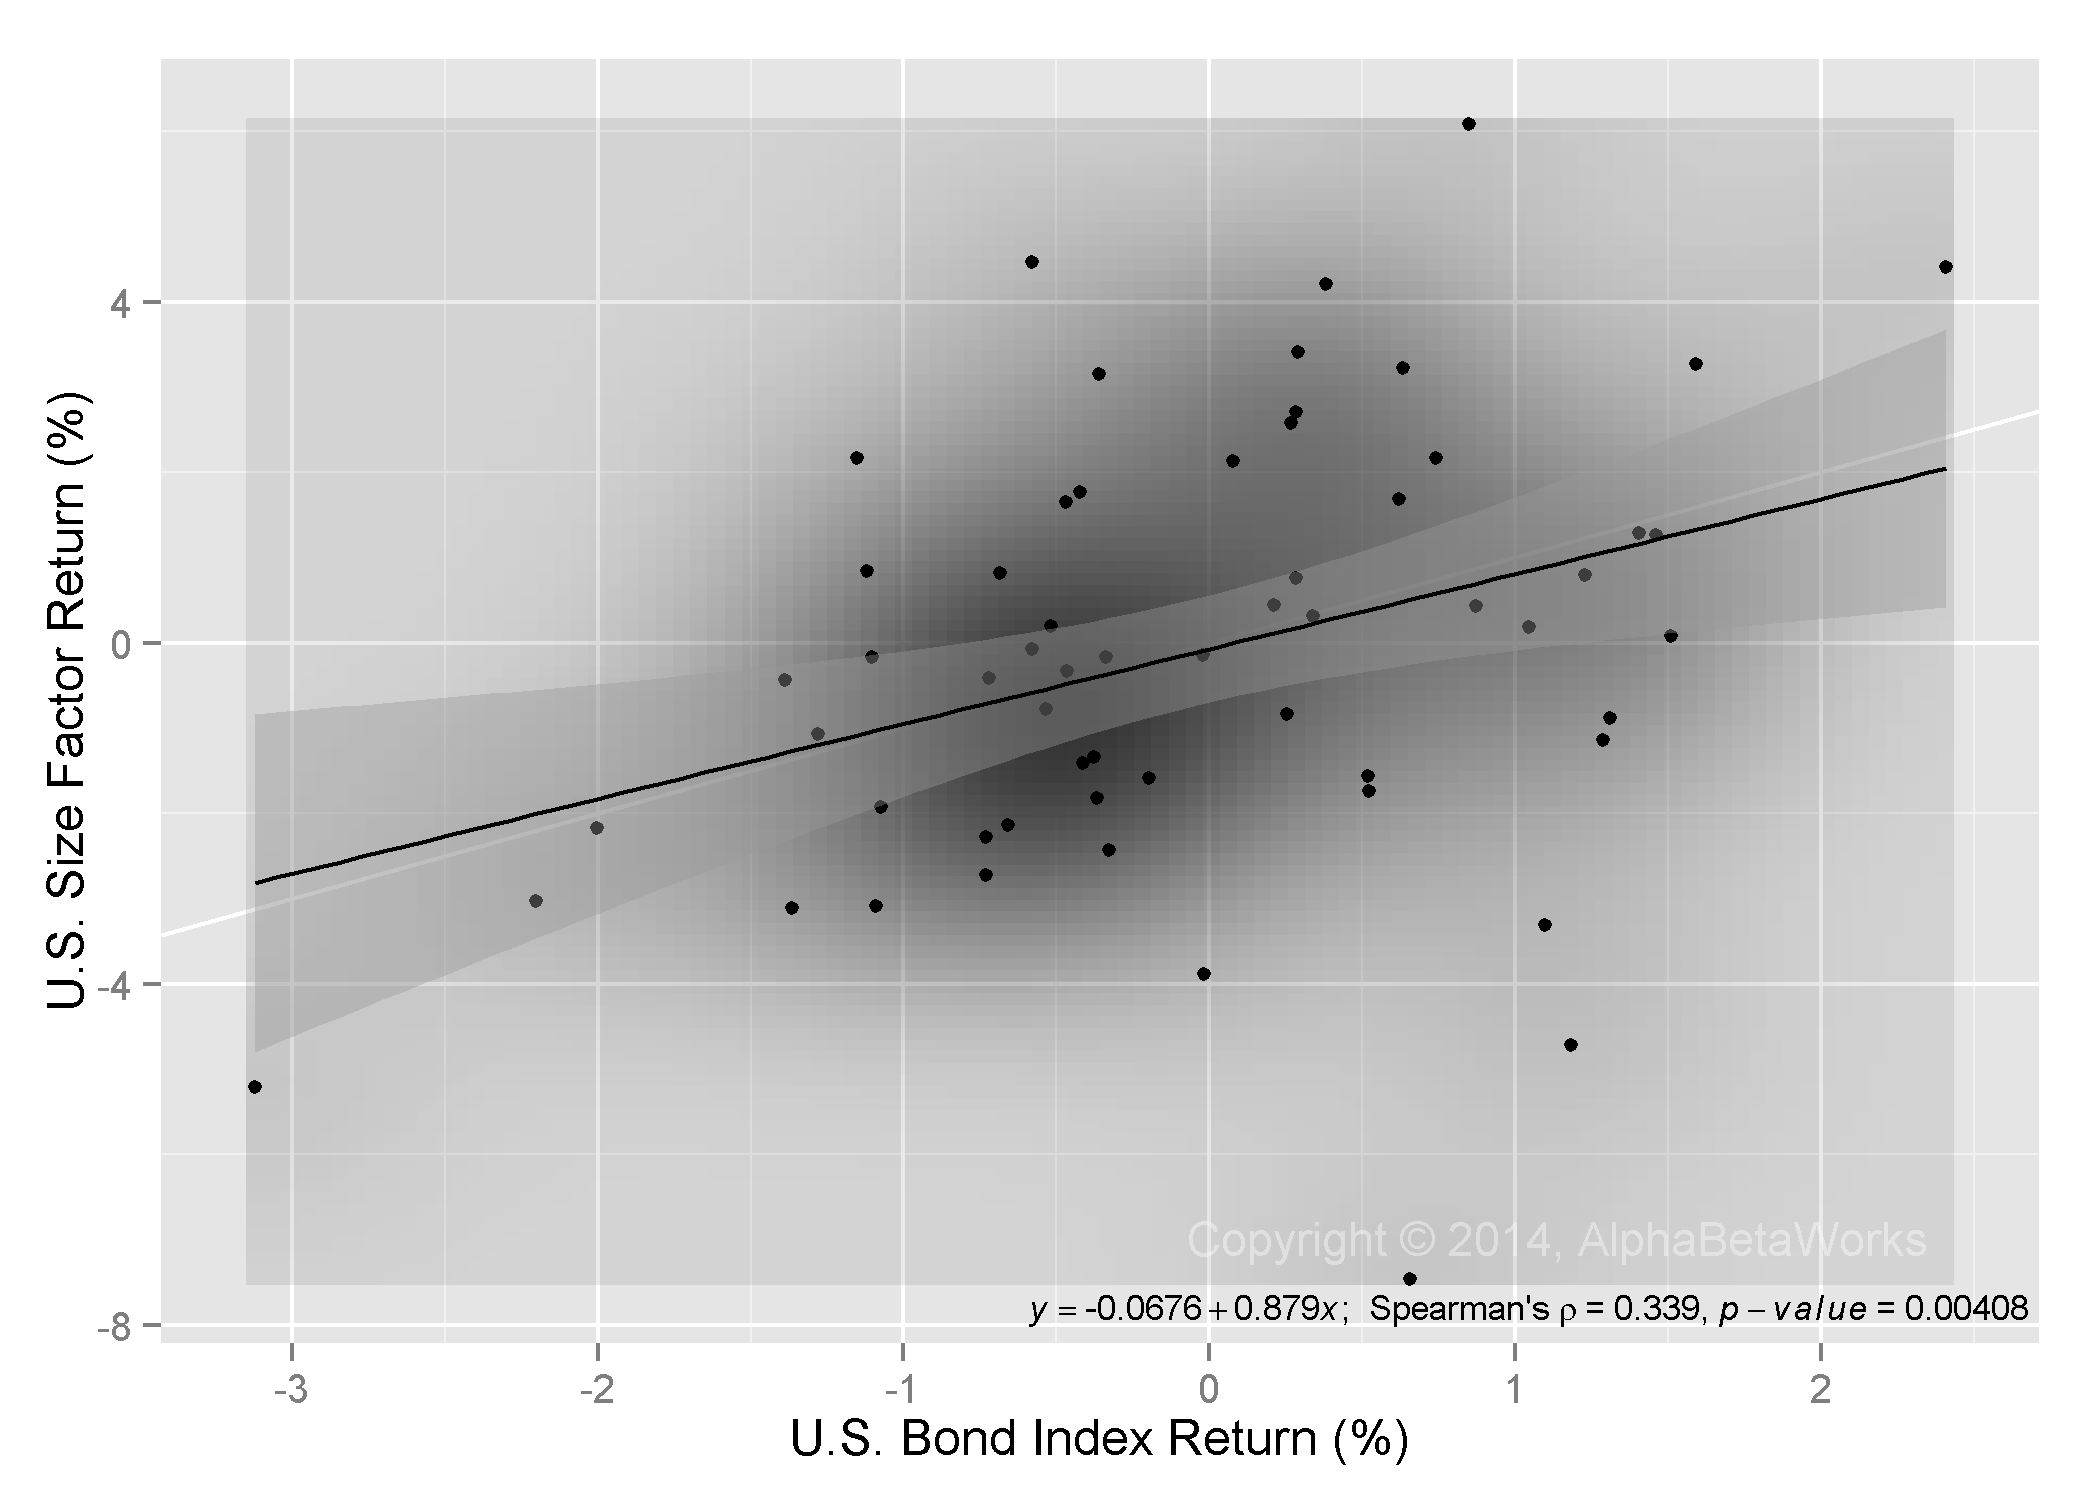
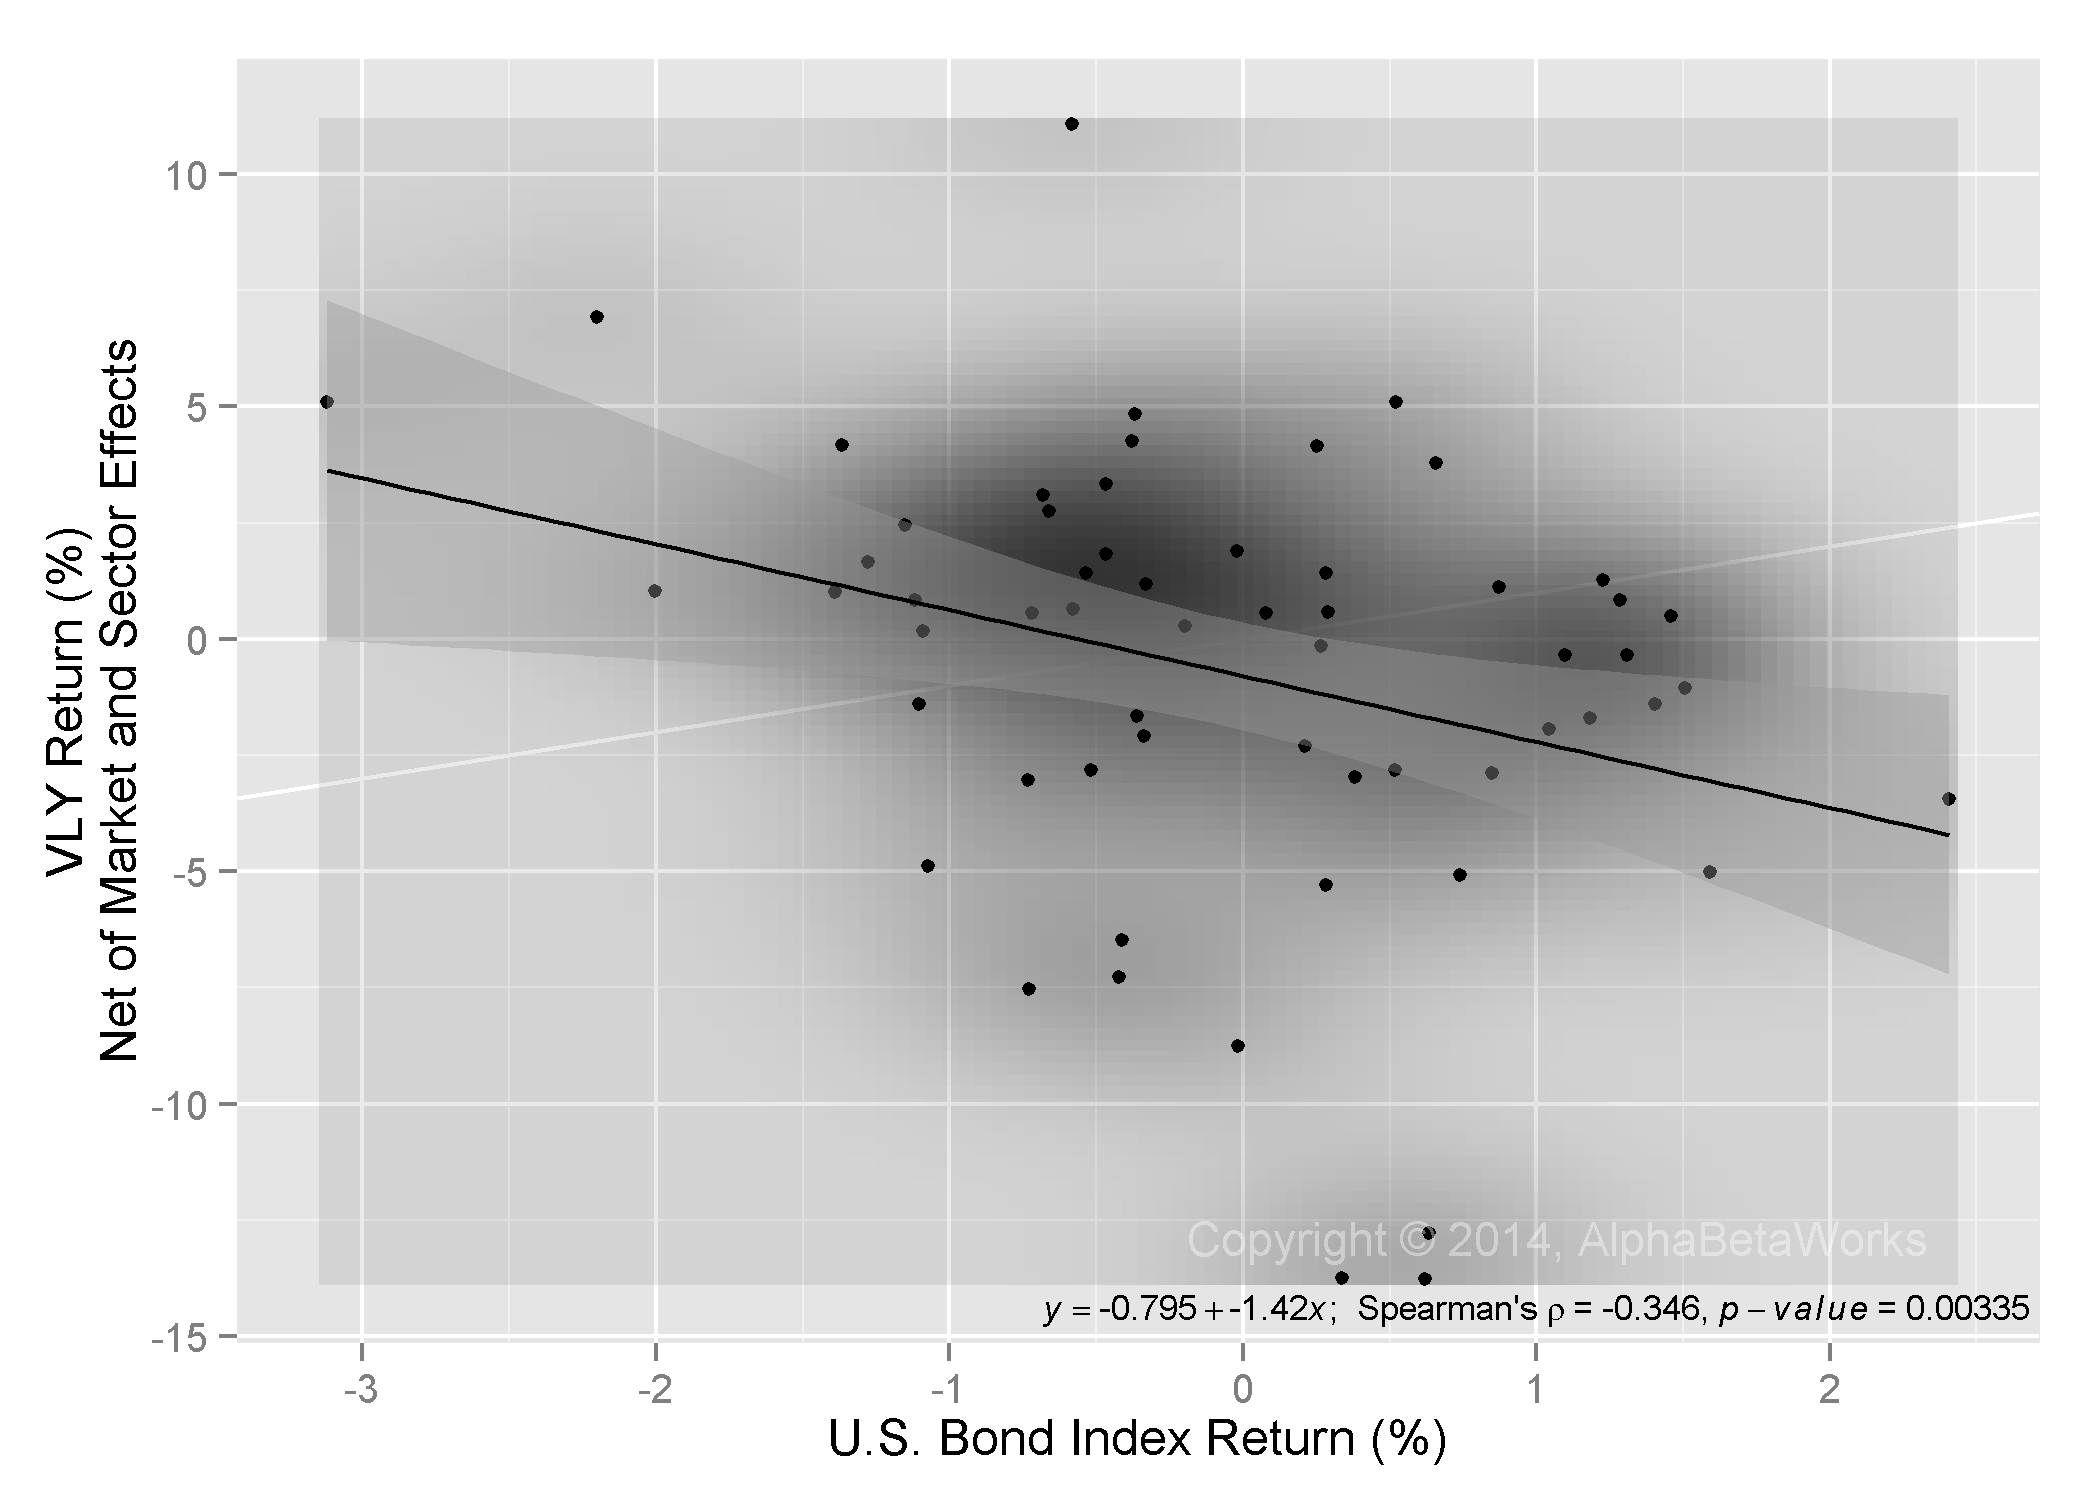
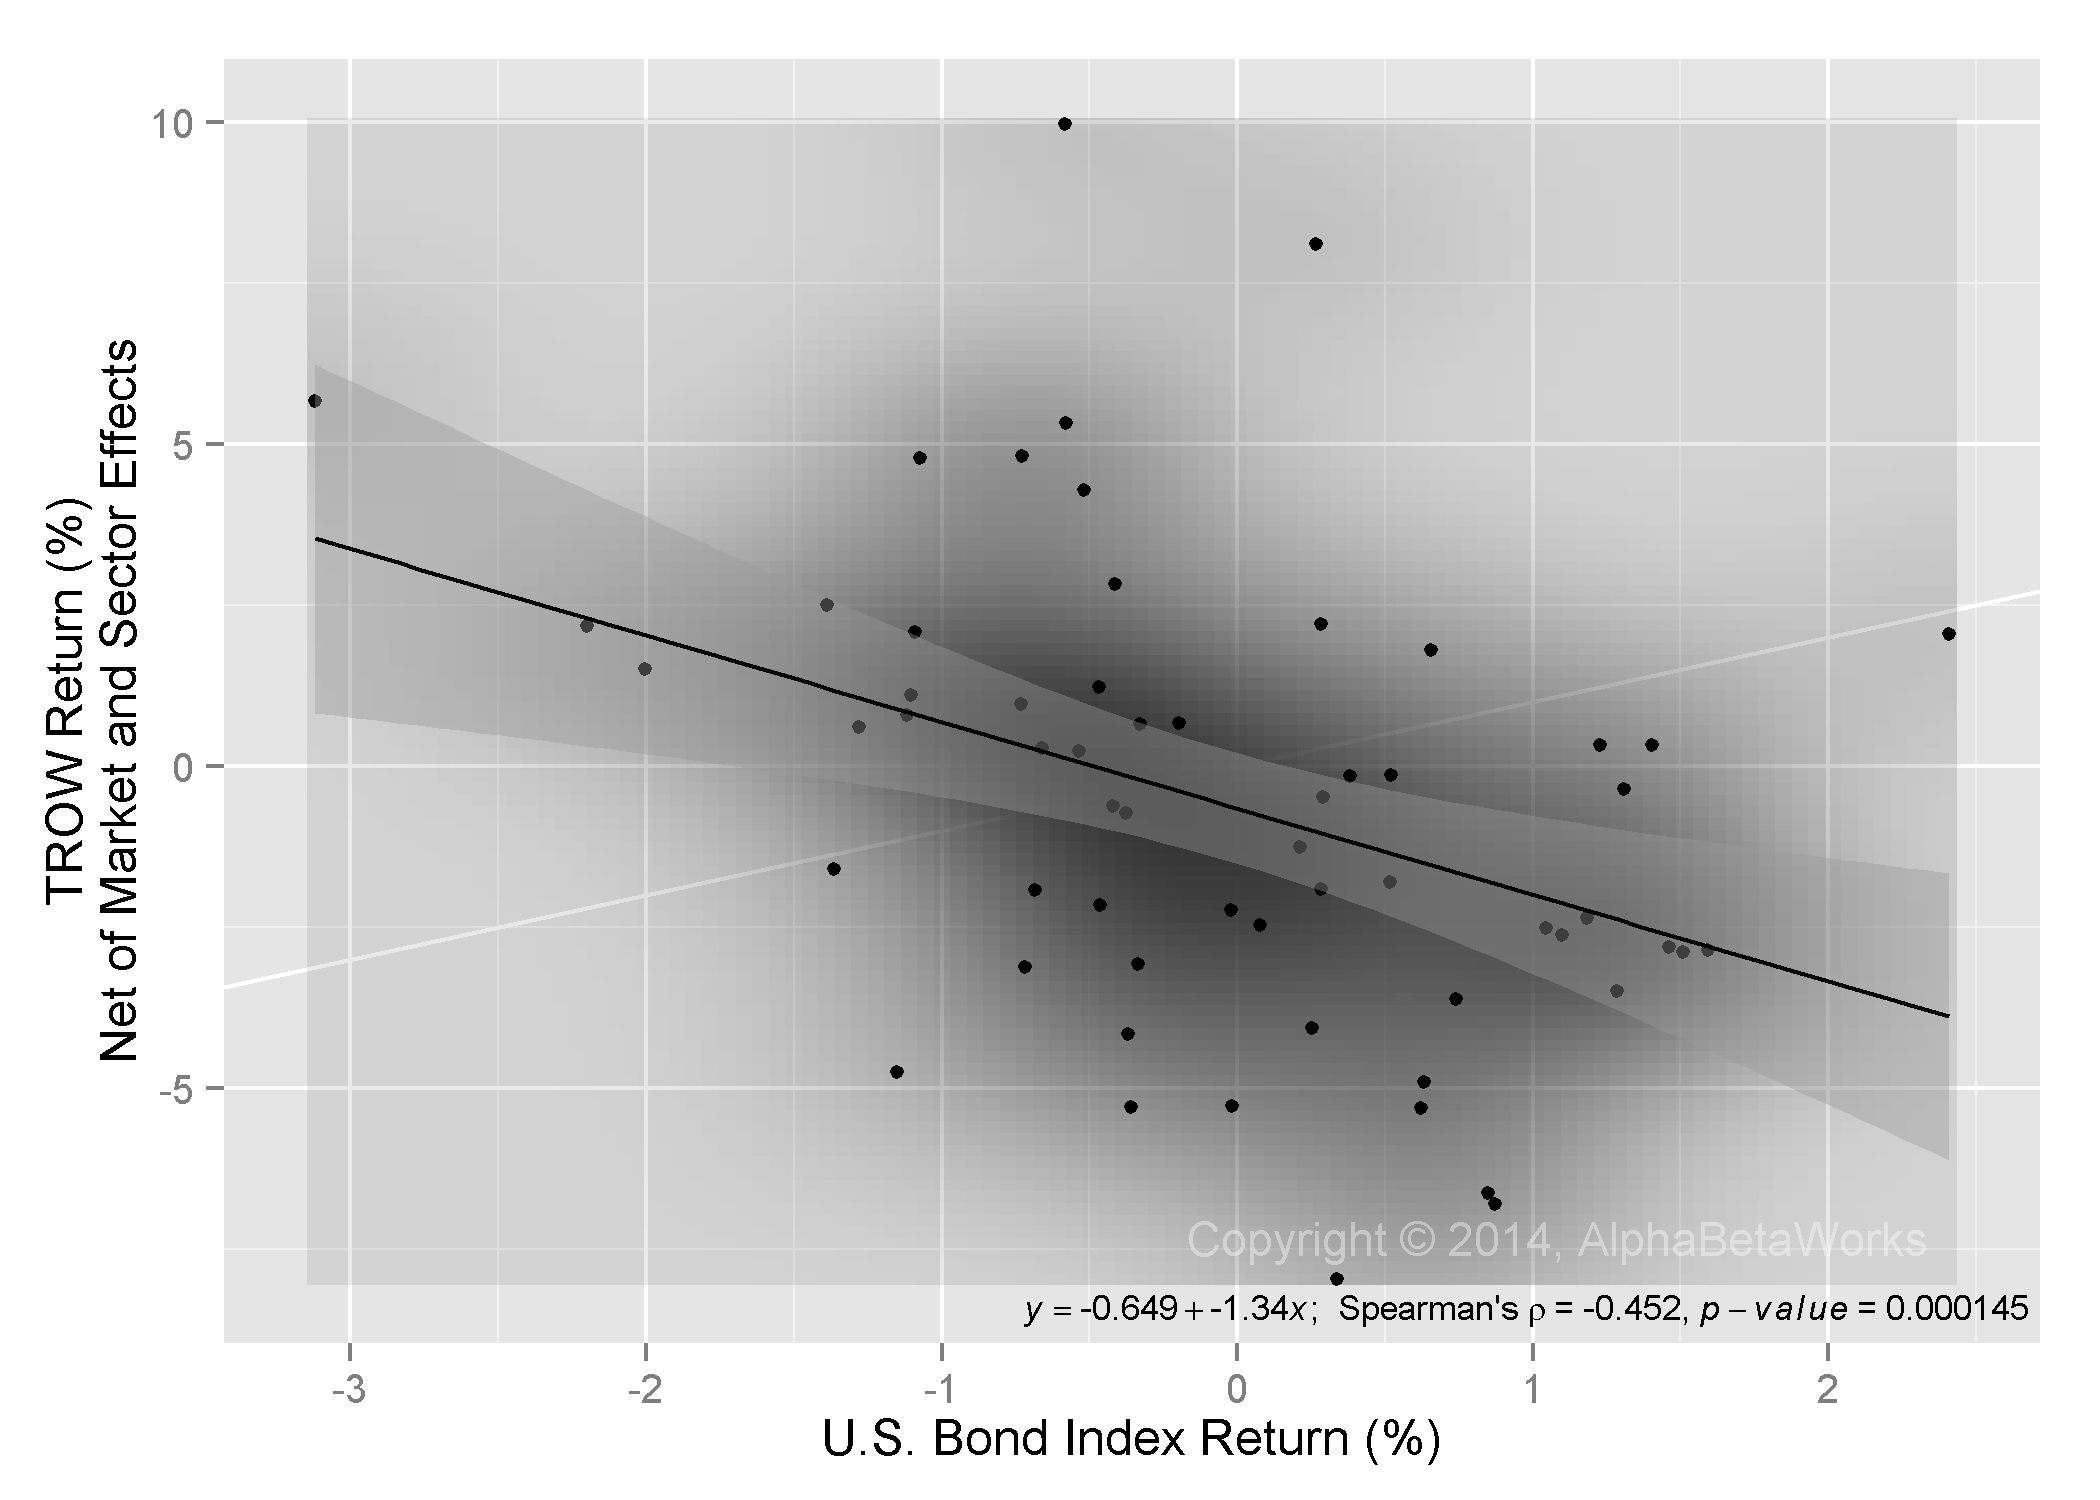
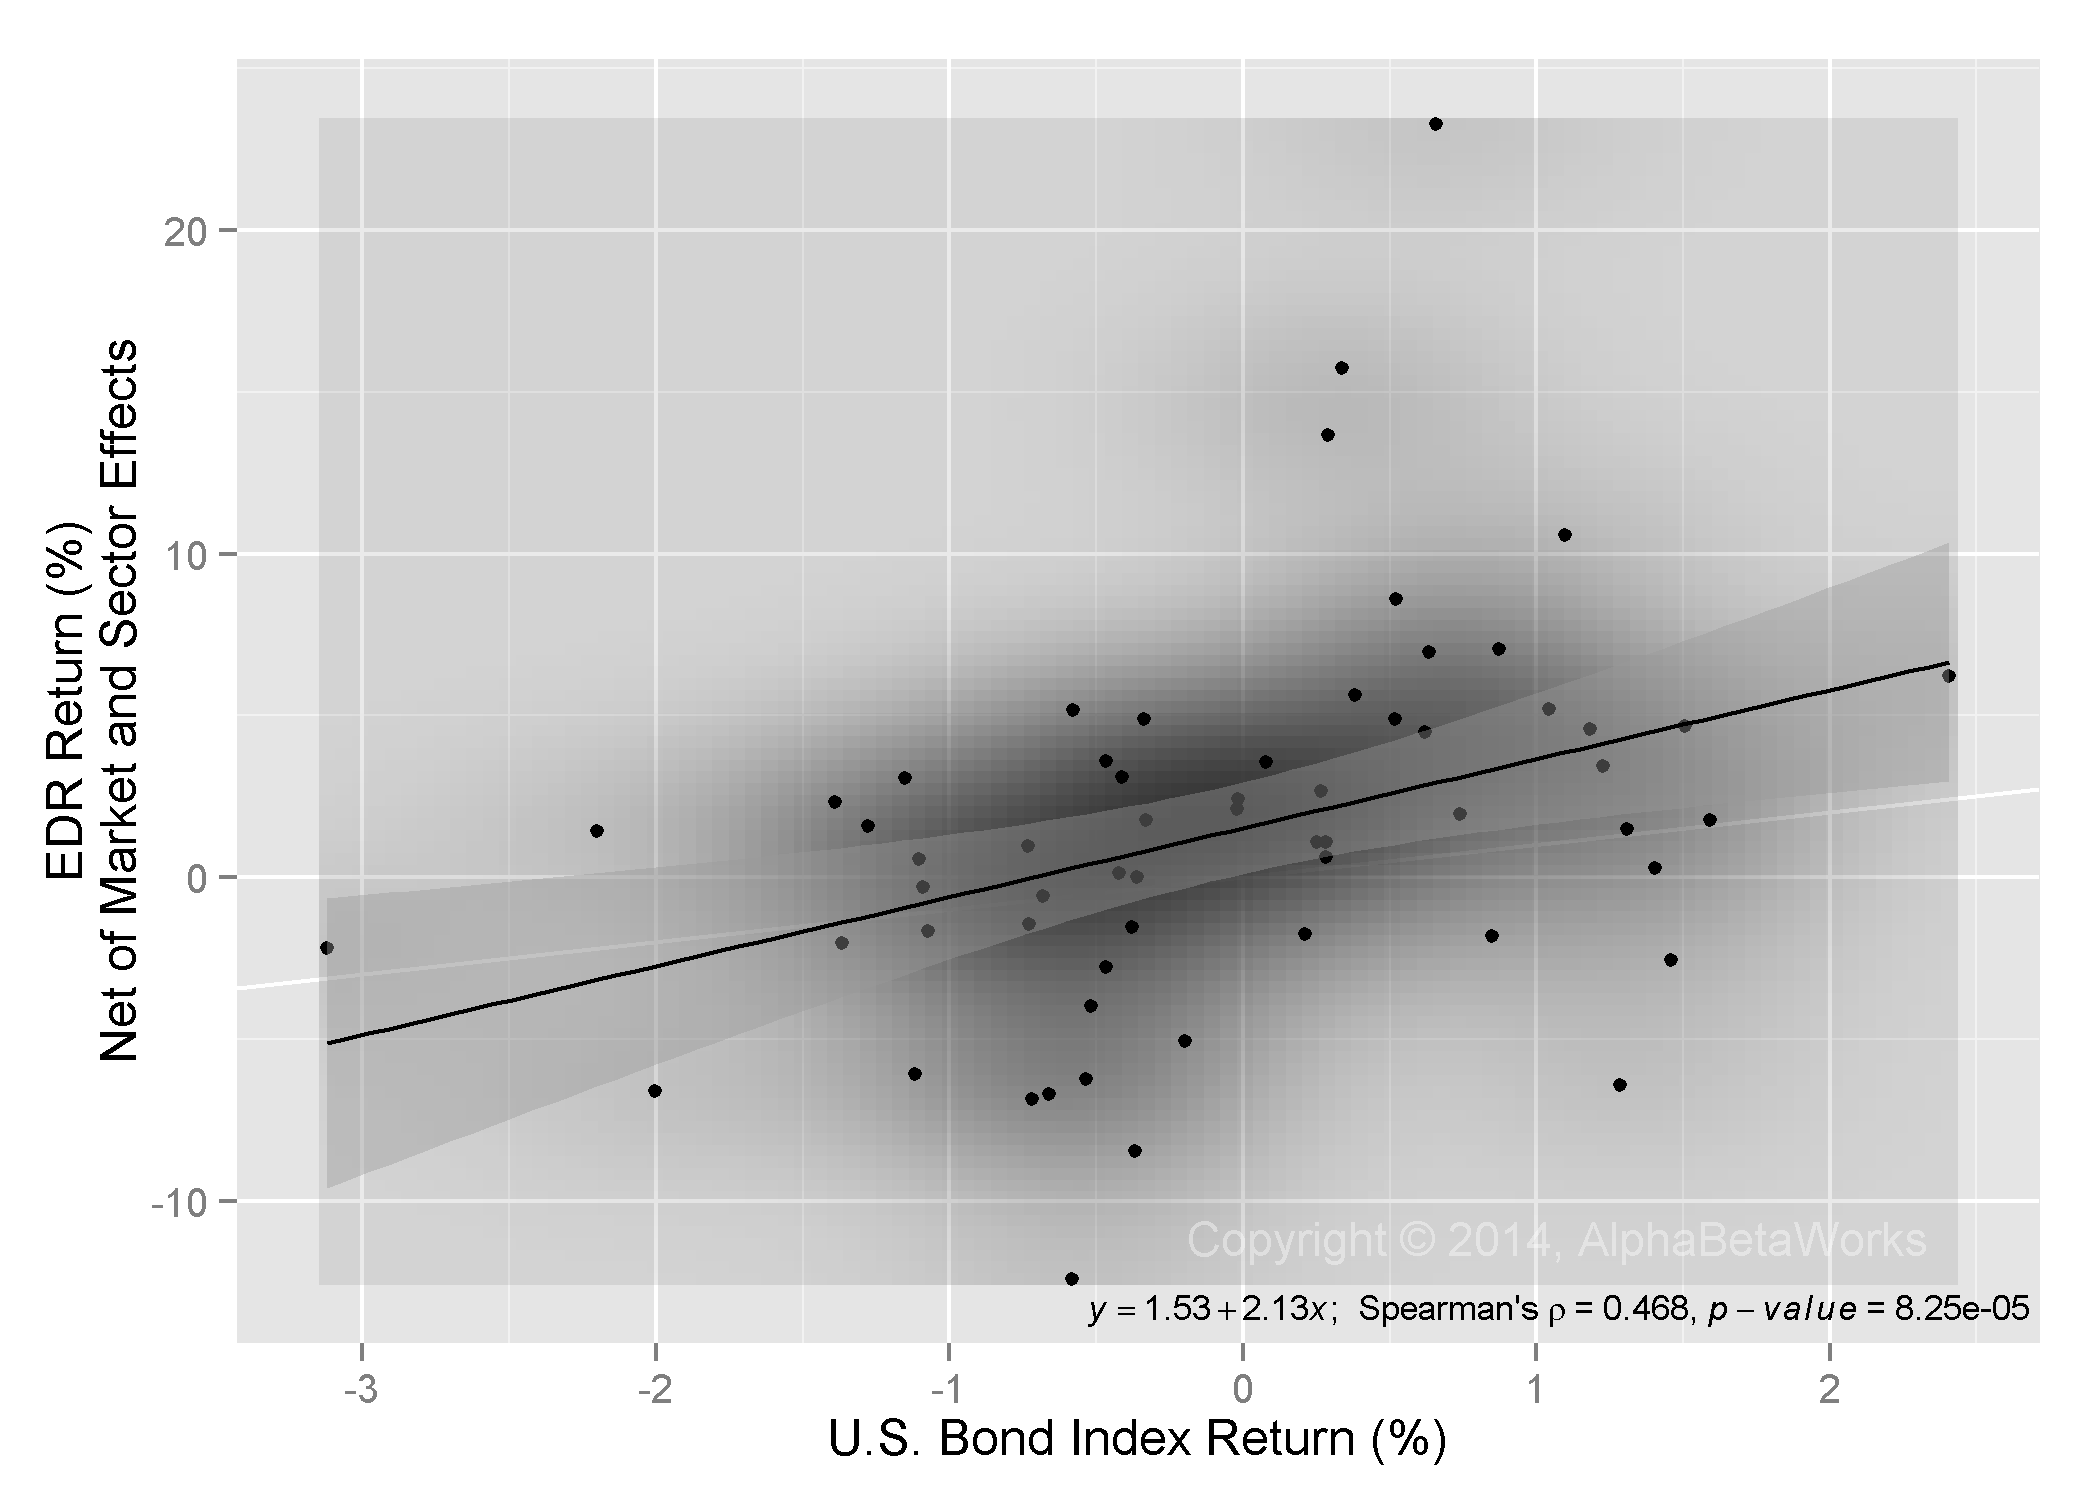
PRSCX varied its exposures over time. U.S. Market is the most important exposure, reaching 200% (market beta of 2) at times. As expected for a technology fund, its U.S. Technology exposure has been near 100%. Also note PRSCX’s occasional short bond exposure. Many equity funds carry large hidden bond bets due to the risk profile of their equity holdings. Most investors and portfolio managers are not aware of these bets. Yet for these funds, bond risk is a key driver of portfolio returns and volatility.

PRSCX – Historical Active Returns

The above exposures define a passive replicating portfolio matching PRSCX’s risk. The fund manager’s job is to outperform this passive alternative by generating active returns.

To isolate active returns, we quantify passive factor exposures, estimate the passive return, and then calculate the remaining active return – αβReturn. We further break down αβReturn into risk-adjusted return from security selection, or stock picking (αReturn), and market timing (βReturn):

Component 2004 2005 2006 2007 2008 2009 2010 2011 2012 2013 2014
Total 1.6 2.46 7.1 11.88 -43.8 67.83 21.25 -4.51 6.25 43.7 9.39
Passive -0.69 1.4 5.45 19.26 -46.13 77.52 23.21 -3.42 20.36 51.54 13.61
αβReturn 0.98 -0.69 -2.2 -7.45 2.71 -11.61 -2.22 -8.24 -13.76 -14.14 -5.84
αReturn -1.95 -3.29 -6.45 -2.79 7.92 0.78 4.17 -12.31 -11.47 -4.54 1.11
βReturn 2.94 2.6 4.25 -4.66 -5.2 -12.39 -6.39 4.07 -2.29 -9.6 -6.95
Undefined 1.3 1.75 3.85 0.07 -0.38 1.92 0.26 7.15 -0.35 6.3 1.61

Note that we are unable to account for trades behind some of the returns – the “Undefined” component. It may be due to private securities or intra-period trading; it may be passive or active. Yet, even if we assume that all undefined returns above are active, PRSCX still delivered persistently negative αβReturn over the past ten years. Furthermore, the compounding of negative αβReturn leaves investors missing out on 50-80% in gains.

FSCSX – An Upgrade Option with Similar Historical Risk

While a passive portfolio would have been superior to PRSCX, it is not the best upgrade. Allocators and investors can do better owning a fund with consistently positive αβReturns, since αβReturns persist. One candidate is Fidelity Select Software & Computer Services Portfolio (FSCSX):

Chart of the historical exposures of Fidelity Select Software & Computer Services Portfolio (FSCSX) to significant risk factors

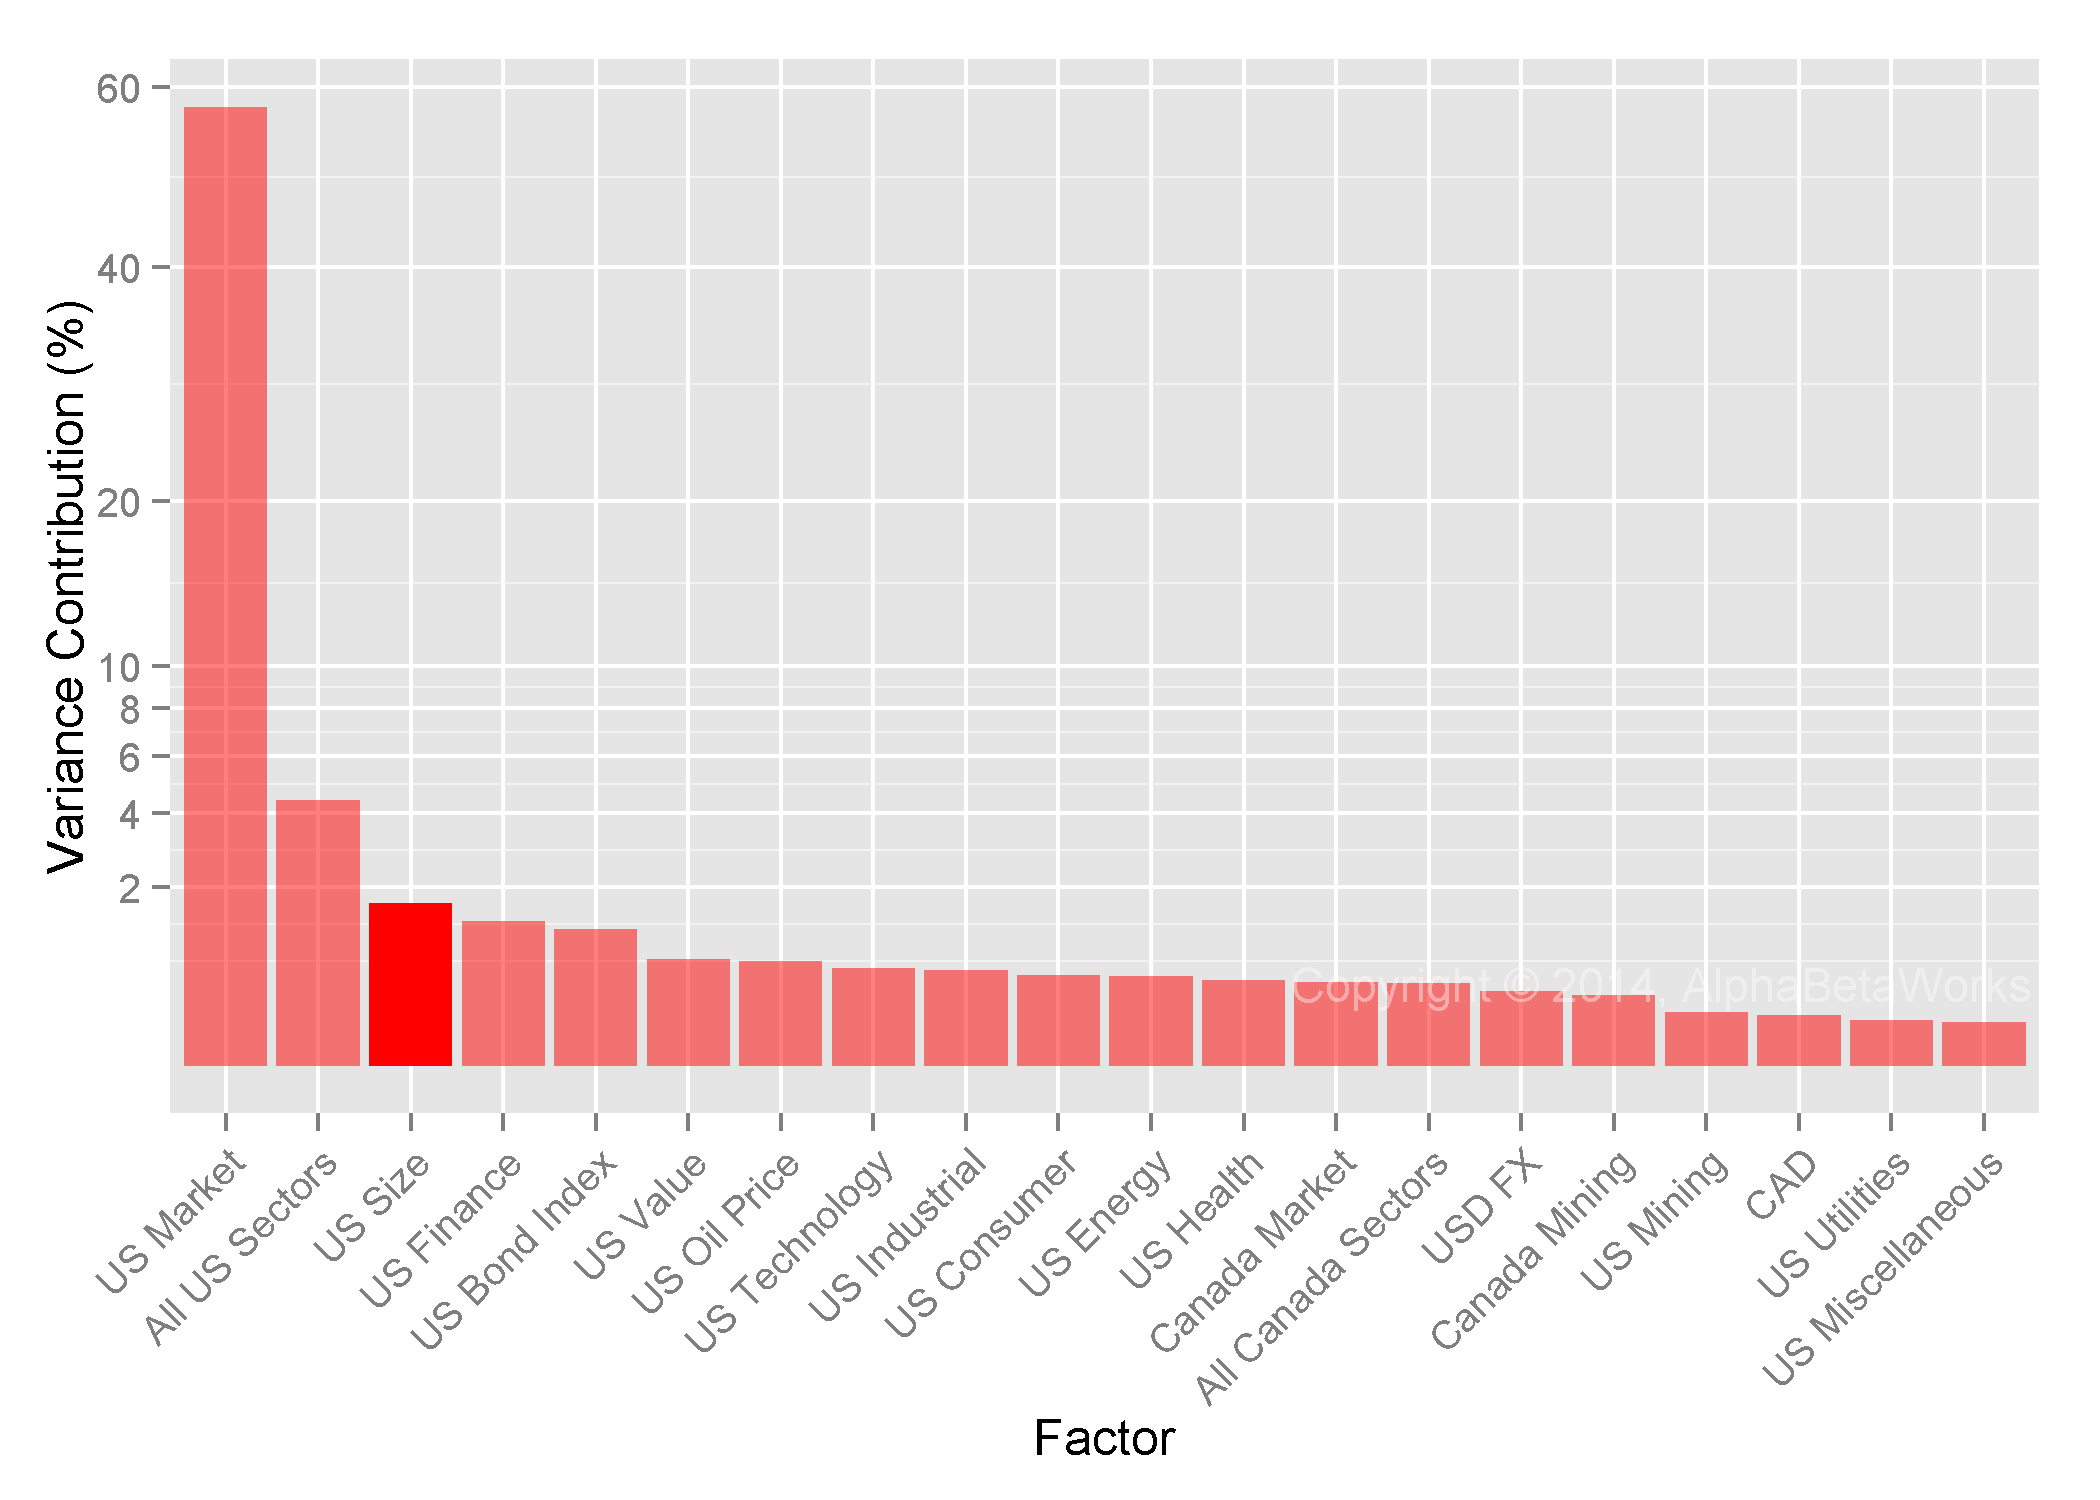
Fidelity Select Software & Computer Services Portfolio (FSCSX) – Exposure to Significant Risk Factors

Currently, FSCSX and PRCSX have similar exposures. AlphaBetaWorks’ risk analytics estimate the current annualized tracking error between the two funds at a 5.29% (about the same volatility as bonds, and less than one half of market volatility).

FSCSX – Historical Active Returns

FSCSX’s 3-year trailing average annual return of 23% is slightly ahead of PRSCX’s 20%. But most importantly, given its lower historical risk, FSCSX has delivered positive αβReturns versus PRSCX’s significantly negative ones. The chart below shows FSCSX’s ten-year performance. The purple area is the positive αβReturn. The gray area is FSCSX’s passive return:

Chart of the historical cumulative passive and active returns of Fidelity Select Software & Computer Services Portfolio (FSCSX)

Fidelity Select Software & Computer Services Portfolio (FSCSX) – Passive and Active Return History

FSCSX is superior to a passive portfolio with similar risk and to PRSCX. Mind you, this is not a sales pitch for FSCSX but merely a consequence of its positive αβReturn and αβReturn persistence.

Few fund investors and allocators possess the tools to quantify active returns. Yet, this knowledge is an essential competitive advantage, leading to improved client returns, client retention, and asset growth. Unfortunately, many are content to pick funds based on past nominal returns and to suffer the consequences: picking yesterday’s winners tends to pick tomorrow’s losers. AlphaBetaWorks spares clients from the data processing headaches, financial modeling, and statistical analysis of thousands of portfolios, delivering predictive risk and skill analytics on thousands of funds.

Conclusions

  • Analyzing a fund’s performance relative to a benchmark ignores the most important question: What should you have made given its risk?
  • Some mutual funds produce persistently negative active returns; others produce persistently positive active returns.
  • Upgrading from a fund with persistently negative active return (αβReturn) to a replicating passive portfolio tends to improve performance.
  • Upgrading from a passive portfolio to a fund with persistently positive αβReturn also tends to improve performance.
  • Tools that accurately estimate fund risk and active returns provide enduring competitive advantages for investors and professional allocators, leading to improved client returns, client retention, and asset growth.
The information herein is not represented or warranted to be accurate, correct, complete or timely.
Past performance is no guarantee of future results.
Copyright © 2012-2014, 
AlphaBetaWorks, a division of Alpha Beta Analytics, LLC. All rights reserved.
Content may not be republished without express written consent.

The “Small-Cap Large-Cap Funds”

Many Large-Cap Funds in Theory Are Small-Cap in Practice

Using the market capitalization of holdings, common in rudimentary forms of style-box analysis, provides an incorrect picture of style and risk for as much as a fifth of large- and mega-cap funds. In practice, these funds have the risk and return profiles of small-cap funds. Misidentifying such “Small-Cap Large-Cap Funds” distorts the risk profile and performance of a fund portfolio. A robust risk model, such as the AlphaBetaWorks Statistical Equity Risk Model, estimates pure equity size risk.

Chart of the Weighted Average Market Cap and Size Risk for U.S. Mutual Funds

Weighted Average Market Cap and Size Risk – U.S. Mutual Funds

Size Risk Defined

The weighted average market cap of holdings is a common, simple, and convenient measurement of portfolio size risk. However, a factor model is preferable due to its stronger predictive power.

AlphaBetaWorks’ Size Factor (ABW Size Factor) is closely related to the Fama–French SMB Factor, but with enhancements: The ABW Size Factor strips out market and sector effects from security returns, revealing pure size risk. By contrast, SMB Factor captures size risk, but it also picks up market beta and sector effects within security returns, since these effects influence the relative performance of small and large cap stocks. This market and sector noise in the SMB Factor makes accurate risk estimation challenging and accurate performance attribution impossible.

The ABW Size Factor strips market and sector effects from security returns, revealing pure size risk. The ABW Size Factor is the difference in returns, net of market and sector effects, between the largest and the smallest stocks. The opposite of the ABW Size Factor is the ABW Small-Cap Factor – the outperformance, net of market and sector effects, of the smallest stocks:

Chart of the Cumulative Return History of U.S. Small-Cap Factor

U.S. Small-Cap Factor Return History

Size Factor and Small-Cap Factor are key drivers of portfolio returns in all markets. The Small-Cap Factor declined by approximately 6% from January through July of 2014. This volatility affected not only small-cap funds but also large-cap funds with small-cap risk (“Small-Cap Large-Cap Funds”).

Size Risk of Individual Stocks

Large-cap companies generally have positive exposure to Size Factor. For example, Abbott Laboratories (ABT), with a $64 billion market cap, has Size Factor exposure of +0.65. If large stocks outperform small stocks by 10% in a flat market, ABT will, on average, return 6.5%:

Chart of the Abbott Laboratories (ABT) Monthly Returns vs U.S. Size Factor Monthly Returns for the Past 5 Years

Abbott Laboratories (ABT) Monthly Returns vs U.S. Size Factor Monthly Returns (2009-2014)

Small-caps generally have negative exposure to Size Factor. For example, Isle of Capri Casinos, Inc. (ISLE), with a $300 million market cap, has Size Factor exposure of -2.47. If large stocks outperform small stocks by 10% in a flat market, ISLE will, on average, decline by 24.7%:

Chart of the Isle of Capri Casinos, Inc. (ISLE) Monthly Returns vs U.S. Size Factor Monthly Returns for the Past 5 Years

Isle of Capri Casinos, Inc. (ISLE) Monthly Returns vs U.S. Size Factor Monthly Returns (2009-2014)

Similar to large cap funds, not all large-cap companies have a positive relationship with Size Factor. If a large-cap company is owned primarily by small-cap investors, has a very small float, or was rapidly elevated to large-cap status, it may retain the risk and behavior of a small-cap. For instance, DexCom, Inc. (DXCM) having appreciated by approximately 500% in a few years, remains a favorite among small-cap traders, retaining its small-cap risk profile. Despite its current $3.5 billion market cap, DXCM has a Size Factor exposure of -2.24. If the largest stocks outperform the smallest stocks by 10% in a flat market, DXCM will, on average, decline by 22.4%:

Chart of the DexCom, Inc. (DXCM) Monthly Returns vs U.S. Size Factor Monthly Returns for the Past 5 Years

DexCom, Inc. (DXCM) Monthly Returns vs U.S. Size Factor Monthly Returns (2009-2014)

Size Risk Impact on Mutual Funds and Hedge Funds

How important is Size Factor in practice? Size Factor exposure accounts for approximately 1.0% of aggregate U.S. mutual fund variance – about the same as the Finance Sector – making Size Factor the third-most important driver of risk and return:

Chart of the Factors Contributing Most to U.S. Mutual Fund Performance

Factors Contributing Most to U.S. Mutual Fund Performance

Among U.S. hedge funds, Size Factor exposure is a more significant source of returns, explaining 1.7% of variance. Only the Market Factor (market beta) is more influential.

Chart of the Factors Contributing Most to U.S. Hedge Fund Performance

Factors Contributing Most to U.S. Hedge Fund Performance

The importance of size risk to hedge funds is one of the consequences of their fondness for “cheap call options,” often small and speculative issues. Mind you, this is aggregate data. For many individual funds size risk is even more important.

Size Risk and Market Cap

Since small-cap companies tend to outperform over the long-term, a large-cap fund can outperform its benchmark by owning large caps that act like small caps (i.e. being short Size). Therefore, we should expect to find large-cap funds trending towards short size exposures. Our observation of approximately 3,000 medium and lower turnover U.S. mutual funds confirms this trend: 20% (342) of 1759 large- and mega-cap funds have Size Factor exposure of small- and micro-cap funds. These funds will tend to act like small-cap funds in the future.

Small-Cap Large-Cap Funds

Below is a list of “large-cap” mutual funds having small-cap risk profiles. These are funds with the largest divergence between their weighted average market caps and their size risk (Size Factor exposure):

Symbol Name Weighted Average Market Cap ($bn) Size Factor Exposure
(% of Equity)
RYOIX Rydex Biotechnology Fund 27.93                        -78.13
FBIOX Fidelity Select Biotechnology Portfolio 30.59                        -66.80
FBDIX Franklin Biotechnology Discovery Fund 35.90                        -64.88
ETNHX Eventide Healthcare & Life Sciences Fund 3.70                        -79.71
FBTTX Fidelity Advisor Biotechnology Fund 36.02                        -59.77
SCATX RidgeWorth Aggressive Growth Stock Fund 40.68                        -55.00
JAMFX Jacob Internet Fund 68.97                        -49.35
HTECX Hennessy Technology Fund 29.71                        -53.84
INPSX ProFunds Internet Ultrasector Fund 56.34                        -45.69
PRGTX T Rowe Price Global Technology Fund 65.29                       -43.59

For example, the size exposure of PRGTX above (-43.59%) is that of a typical mutual fund with holdings averaging $1 to $5 billion market capitalizations.

The large-cap funds above (and over 300 others we identified) benefit the most from small-cap returns. If misidentified or misunderstood, they and others may contribute to a risk profile that was not intended by the allocator or investor.

Conclusions

  • The market capitalization of holdings, used by the rudimentary forms of style analysis, mischaracterizes the risk of 20% of large-cap mutual funds.
  • Some large-cap funds and stocks have small-cap size risk.
  • The ABW Size Factor estimates pure size risk of securities and portfolios by stripping out all market and sector effects.
  • Since small-caps outperform over the long term, many large-cap funds seek small-cap risk exposures to enhance returns.
  • Investors must monitor the size risk of their funds, to ensure that their portfolios have the expected exposures to small-caps.
The information herein is not represented or warranted to be accurate, correct, complete or timely.
Past performance is no guarantee of future results.
Copyright © 2012-2014, AlphaBetaWorks, a division of Alpha Beta Analytics, LLC. All rights reserved.
Content may not be republished without express written consent.


Hidden Bond Exposures in Equity Portfolios

For Many Equity Funds, Bond Risk is More Important than Industry and Style

This year, equity fund investors have been reading – and will soon read more – quarterly letters lamenting volatility and poor performance. The true reasons are rarely identified. Portfolio managers themselves may not fully understand the causes. The hidden bond exposure in equity portfolios is often the culprit.

Hidden Bond Risk in the Equity Market

An equity portfolio with no bond positions is still exposed to the bond market. The relationship between equity and fixed income markets evolves, depending on the macroeconomic environment. This relationship has been significant lately. Over the past five years, 20% of U.S. Equity Market volatility can be explained by a negative correlation to the U.S. Bond Index:

Chart of the Correlation Between U.S. Market Monthly Returns and U.S. Bond Index Monthly Returns for 2009-2014

U.S. Market Monthly Returns vs U.S. Bond Index Monthly Returns (2009-2014)

For example: The 5.4% decline in bond prices explains over a third of the 31% Russell 3000 return in 2013.

Hidden Bond Risk in Small Caps

A less well-appreciated source of additional bond risk is the bond exposure of particular industries and stock types. For example, Size Factor (the difference in returns, net of market and sector effects, between the largest and the smallest stocks) has a significant positive relationship with bonds: Small caps tend to have a negative relationship to bond prices, while the opposite is true for large cap stocks.

Chart of the Correlation Between U.S. Size Factor Market Monthly Returns And U.S. Bond Index Monthly Returns For 2009-2014

U.S. Size Factor Monthly Returns vs U.S. Bond Index Monthly Returns (2009-2014)

In 2013, the smallest U.S. stocks outperformed the largest by 9%. The 5.4% decline in bonds explains over half of this outperformance. In short, if you’re making an allocation to small or large capitalization funds, you’re making an implicit bet on bonds.

This source of bond exposure is captured by AlphaBetaWorksSize Factor exposure (Size beta). This exposure is often overlooked, but a robust equity risk model will identify it.

Company-Specific Bond Risk

Financially levered companies – particularly those with fixed long-term liabilities – have negative exposure to bonds. Any change in interest rates will affect the value of their liabilities and thus their stock prices. For example, Valley National Bancorp (VLY), which is approximately 2.5 times levered, has significant short bond exposure. The statistically observed exposure is -1.4x – almost perfectly in-line with its 150% debt load:

Chart of the Correlation Between Valley National Bancorp (VLY) Monthly Returns And U.S. Bond Index Monthly Returns For 2009-2014

Valley National Bancorp (VLY) Monthly Returns vs U.S. Bond Index Monthly Returns (2009-2014)

Bond performance also captures a number of broad macroeconomic risks: deflation, credit crises, and recessions. Companies that are not financially levered, but are still heavily exposed to these risks, exhibit negative correlation with bonds. For instance, the earnings power of T. Rowe Price Group (TROW) is sensitive to the faith in capital markets, macroeconomic stability, and investor sentiment. TROW and other asset managers tend to have negative bond exposures. Approximately 20% of the volatility of TROW over the past five years, net of market and sector effects, is explained by bond returns:

Chart of the Correlation Between T. Rowe Price Group (TROW) Monthly Returns And U.S. Bond Index Monthly Returns For 2009-2014

T. Rowe Price Group (TROW) Monthly Returns vs U.S. Bond Index Monthly Returns (2009-2014)

Some businesses own a relatively well-defined stream of long-duration cash flows and are structurally similar to bonds. Most REITs, Royalty Trusts, and MLPs have large and statistically significant long bond exposures. For instance, approximately 22% of the volatility of Education Realty Trust, Inc. (EDR), net of market and sector effects, is explained by bond price changes:

Chart of the Correlation Between Education Realty Trust, Inc. (EDR) Monthly Returns And U.S. Bond Index Monthly Returns For 2009-2014

Education Realty Trust, Inc. (EDR) Monthly Returns vs U.S. Bond Index Monthly Returns (2009-2014)

Mutual Fund and Hedge Fund Volatility Due to Bond Exposure

So how important is bond exposure in practice? The AlphaBetaWorks Performance Analytics Platform regularly analyzes 15 years of portfolio and performance history of approximately 3,000 medium and lower turnover U.S. mutual funds and 400 medium and lower turnover U.S. hedge funds to determine the main sources of risk and return. For hedge funds we analyze long equity portfolios, available from 13F filings, only.

For mutual funds, bond exposure accounted for approximately 0.5% of variance – about an equal contribution to the Value/Growth Factor and the Canadian Market.

Chart of the Contribution of Various Risk Factors to U.S. Mutual Fund Performance

Factors Contributing to U.S. Mutual Fund Performance

For Hedge Funds, bond exposure is a more significant return driver, explaining three times more variance. The Bond Factor is the fourth most important risk factor for long hedge fund portfolios, ahead of Value/Growth, Oil Price, and Technology Sector factors. Only the Market, Finance Sector, and Size factors are more influential to hedge funds.

Chart of the Contribution of Various Risk Factors to U.S. Hedge Fund Performance

Factors Contributing to U.S. Hedge Fund Performance

The importance of bond risk to hedge funds is a natural consequence of their fondness for indebted companies and other “cheap call options,” often levered bets with embedded short bond exposures. Mind you, this is aggregate data. For many hedge funds, bond exposure is the second most important risk, after market exposure.

Mutual Funds Most Exposed to Bonds

Some U.S. mutual funds with the largest bond bets are listed below. These are the bond exposures in addition to market, sector, and style risk – also sources of bond correlation. Many carry embedded bond bets on the same scale as their AUM:

Equity Mutual Funds – Short Bond Exposure

Symbol Name Bond Exposure (%)
LLSCX Longleaf Partners Small Cap Fund -101.41
RYPNX Royce Opportunity Fund -100.33
HRVIX Heartland Value Plus Fund -73.73
HRTVX Heartland Value Fund -70.98
LKSCX LKCM Small Cap Equity Fund -68.44
VTSIX Vanguard Tax Managed Small Cap Fund -60.56
MSSMX Morgan Stanley Instl. Fund-Small Company Growth Portfolio -60.54
WCSTX Waddell & Reed Advisors Science & Technology Fund -57.40
HIASX Hartford Small Company HLS Fund -57.27
RYVPX Royce Value Plus Fund -56.93

Equity Mutual Funds – Long Bond Exposure

Symbol Name Bond Exposure (%)
PRMTX T Rowe Price Media & Telecommunications Fund 26.69
TEDMX Templeton Developing Markets Trust 28.34
HCIEX Hirtle Callaghan International Equity Fund 31.16
WRVBX Waddell & Reed Advisors Vanguard Fund 33.82
MIEIX MFS Institutional International Equity Fund 34.27
OPGSX Oppenheimer Gold & Special Minerals Fund 83.63
CSEIX Cohen & Steers Realty Income Fund 139.67
CSRIX Cohen & Steers Institutional Realty Shares Fund 145.57
CSRSX Cohen & Steers Realty Shares Fund 146.59
TRREX T Rowe Price Real Estate Fund 154.04

Hedge Funds Most Exposed to Bonds

Some U.S. hedge funds with the largest bond bets are listed below. For many of these, bond returns will be the second most important driver of medium-term performance.

Long Equity Hedge Fund Portfolios – Short Bond Exposure

Name Bond Exposure (%)
ESL Investments, Inc. -98.81
Harbinger Capital Partners LLC -86.64
Starboard Value LP -82.37
Lakewood Capital Management LP -78.32
Paradigm Capital Management, Inc. -76.12
Basswood Capital Management LLC -68.92
Rima Senvest Management LLC -68.81
Fine Capital Partners LP -65.84
Palo Alto Investors LLC -52.35
Greenlight Capital, Inc. -48.67

Long Equity Hedge Fund Portfolios – Long Bond Exposure

Name Bond Exposure (%)
Cushing MLP Asset Management LP 42.71
Bridgewater Associates LP 42.99
Energy Income Partners LLC 45.24
Baker Bros. Advisors LP 47.29
Kayne Anderson Capital Advisors LP 48.13
SCS Capital Management LLC 49.55
Harvest Fund Advisors LLC 58.20
Center Coast Capital Advisors LP 58.92
H Partners Management LLC 80.39
Atlantic Investment Management, Inc. 81.61

Conclusions

  • Hidden bond exposures in equity portfolios are often overlooked by professional investors.
  • Market, style, and industry risk factors influence bond exposures in equity portfolios.
  • Small capitalization stocks and funds tend to have negative bond exposures.
  • Some equity securities are significantly exposed to bonds, even after accounting for market and sector risks.
  • For many equity funds, bond exposure is the second most important source of risk and return.
The information herein is not represented or warranted to be accurate, correct, complete or timely.
Past performance is no guarantee of future results.
Copyright © 2012-2014, AlphaBetaWorks, a division of Alpha Beta Analytics, LLC. All rights reserved.
Content may not be republished without express written consent.

Mutual Fund Closet Indexing – Part 3

Why Most Investors Lose, Even if Their Manager is Skilled

An actively managed fund must take risk sufficient to generate active returns in excess of the fees that it charges. However, as skilled managers accumulate assets, they tend to become less active. Skilled managers who took sufficient active risk to earn their fees in the past may be closet indexing today. Consequently, over two thirds of the capital invested in “active” U.S. mutual funds is allocated to managers who are unlikely to earn the average fee, even if highly skilled. Simply by identifying these managers, investors can eliminate most active management fees and improve portfolio performance. 

Closet Indexing Defined

Our first article in this series discussed closet indexing and proposed a new metric of fund activity: Active Share of Variance  the share of volatility due to active management (security selection and market timing). The second article analyzed historical performance of U.S. mutual funds and discovered that over a quarter (26%) of the funds surveyed have been so passive that, even after exceeding the information ratios of 90% of their peers, they would still not be worth the 1% mean management fee.

Too Little Current Risk to Earn Future Fees

Thus far, our analysis improved on existing closet indexing metrics by evaluating past fund activity. The shortcoming of this analysis has been its failure to identify funds that have been active in the past but are closet indexing today. This article addresses the shortcoming: We analyze current and historical positions of approximately 1,700 non-index medium and lower turnover U.S. mutual funds, identifying those that are unlikely to earn their management fees in the future given their current active risk.

The Information Ratio (IR) is a measure of active return relative to active risk (tracking error). The top 10% of the funds achieve IR’s greater than or equal to 0.30; 90% achieve IR’s below 0.30:

Chart of the Distribution of Information Ratios for U.S. Mutual Funds

U.S. Mutual Fund Information Ratio Distribution

If a fund exceeds the performance of 90% of its peers and achieves IR of 0.30, then it needs tracking error above 3.3% to generate active return above 1%. The mean expense ratio for active U.S. mutual funds is approximately 1%. Therefore, if all funds were able to achieve the 90th percentile of IR, they will need annual tracking error above 3.3% to earn the mean fee and generate a positive net active return.

Tracking error is due to active risks a fund takes: security selection risk due to stock picking and market timing risk due to variation in factors bets. We applied the AlphaBetaWorks Statistical Equity Risk Model to funds’ historical and latest holdings and estimated their future tracking errors.

Over half (911) of the funds have such low estimated future tracking errors that, even if they exceeded the performance of 90% of their peers and achieved the IR of 0.30, they will fail to merit the 1% mean management fee:

Chart of the Distribution of Estimated Future Tracking Errors for U.S. Mutual Funds

U.S. Mutual Fund Estimated Future Tracking Error Distribution

Capital-Weighted Closet Indexing

Larger mutual funds are more likely to engage in closet indexing. While only 54% of mutual funds surveyed have estimated future tracking errors below 3.3%, they represent 70% of the assets ($2.4 trillion out of the $3.4 trillion total). Therefore, even if capital is invested with highly skilled managers, more than two thirds of it will not earn the 1% mean management fee:

Chart of the Distribution of Estimated Future Tracking Error of the Capital Invested in U.S. Mutual Funds

U.S. Mutual Fund Capital Estimated Future Tracking Error Distribution

A portfolio that primarily consists of large mutual funds may be doomed to generate negative active returns, regardless of the managers’ skills. The 1% management fee cited here is the mean. Plenty of closet indexers charge more and plenty of investors who remain with them stand to lose more.

Conclusions

  • Over half (54%) of active U.S. mutual funds surveyed are currently so passive that, even after exceeding the information ratios of 90% of their peers, they will still fail to merit a 1% management fee.
  • Over two thirds (70%) of active U.S. mutual fund capital surveyed will fail to merit a 1% management fee, even if its managers are highly skilled.
  • Skilled active managers do exist, but investors need to capture them early in their life cycles.
  • Investors must monitor the evolution of their skilled managers towards passivity.
  • By identifying closet indexers, a typical investor can eliminate most active fees and improve performance.
The information herein is not represented or warranted to be accurate, correct, complete or timely.
Past performance is no guarantee of future results.
Copyright © 2012-2014, 
AlphaBetaWorks, a division of Alpha Beta Analytics, LLC. All rights reserved.
Content may not be republished without express written consent.

Mutual Fund Closet Indexing – Part 2

Can a Fund Earn Its Fees if It Does Not Try?

To be worth the fees it charges, an actively managed fund must take some active risk, rather than merely mirror passive market exposures. However, over a quarter of “active” medium and lower turnover US mutual funds take so little active risk, they are unlikely to earn their management fees. In this article, we build on our earlier work and estimate the risk an active fund must take in order to earn the 1% mean management fee. Simply by testing for funds that are taking too little risk to generate positive net active returns, investors can save billions in fees each year. 

Closet Indexing Defined

Our earlier article discussed closet indexing and proposed a new metric of fund activity: Active Share of Variance – the share of volatility due to active management (security selection and market timing). This analytic relies on the factor analysis of historical holdings and is immune to the issues with holdings-based analysis and the issues with returns-based analysis that affect the popular closet indexing tests: Active Share and . This article uses the AlphaBetaWorks’ Performance Analytics Platform to objectively evaluate the level of fund activity necessary to earn a typical management fee.

Too Little Risk to Make a Difference

Is it possible for a highly skilled manager to take too little risk to earn management fees?

We surveyed 10 years of US filings history of approximately 1,700 non-index medium and lower turnover mutual funds with at least 5 years of filings. This group holds over $3.4 trillion in assets.

We applied the AlphaBetaWorks Statistical Equity Risk Model to funds’ historical holdings to estimate risk at the end of each month. We then attributed the following month’s returns to factor(market) and residual(security-specific) sources, estimated the appropriate factor benchmark, and calculated market timing returns due to variations in factor exposures.

The Information Ratio (IR) is a measure of active return relative to active risk (tracking error). The AlphaBetaWorks Performance Analytics Platform calculated historical (realized) IRs for all funds in the group. The 90th percentile of IR for the group is 0.30, which suggests that 90% of funds needed a tracking error above 3.3% to generate an active return above 1%:

US Mutual Fund Information Ratio Distribution

US Mutual Fund Information Ratio Distribution

Knowing that the mean expense ratio for active US mutual funds is approximately 1.0%, if all funds were able to achieve the 90th percentile of IR, they would need annual tracking error over 3.3% to generate a positive net active return. Over a quarter (445) of the funds in our survey realized tracking errors below this threshold; they have been so passive that, even assuming an IR of 0.30, they would have failed to generate 1% gross and 0% net active returns:

US Mutual Fund Tracking Error Distribution

US Mutual Fund Tracking Error Distribution

A Map of US Mutual Fund Skill and Activity

The evolution of skilled managers’ utility curves is one possible explanation for this reluctance to take risk. Perhaps, as a manager accumulates assets, fee harvesting becomes increasingly attractive. The map of fund active management skill and activity, included below, supports this hypothesis: Large skilled funds tend to be relatively less active. In fact, all the funds in the active and skilled (“Hungry”) group are relatively small:

US Mutual Fund Active Management Skill and Activity

US Mutual Fund Active Management Skill and Activity

Conclusions

  • Over a quarter (26%) of US mutual funds surveyed have been so passive that, even after exceeding the information ratios of 90% of their peers, they would still fail to merit a 1% management fee.
  • Large skilled funds tend to be relatively more passive.
  • Skilled active managers exist, but investors need to capture them early in their life cycles.
  • For this group alone, by identifying funds that take too little risk to generate positive active returns, investors could save between $4 and $10 billion in annual management fees.

Thus far, our work improves on the existing closet indexing metrics by evaluating past fund activity. In subsequent articles we will use the AlphaBetaWorks Performance Analytics Platform to analyze current risk and closet indexing, identifying those funds that are unlikely to earn their management fees in the future.

Copyright © 2012-2014, AlphaBetaWorks, a division of Alpha Beta Analytics, LLC. All rights reserved.
Content may not be republished without express written consent.

Mutual Fund Closet Indexing – Part 1

Are you Paying Active Fees for Passive Management?

Closet indexing may be practiced by 20% to 50% of “active” medium and lower turnover US mutual funds. To make this case, we improve on traditional holdings- and returns-based closet indexing metrics. Simply by testing for closet indexing, investors can save billions in management fees each year.

Closet Indexing

A 2009 study introduced the concept of Active Share to measure the degree to which a fund is actively managed, showing that active stock pickers outperform closet indexers. Another notable active management metric is with respect to a multifactor model.  Both metrics have their drawbacks:  Active Share relies on vulnerable holdings-based analysis. For example, suppose a manager holds a position in a benchmark ETF; this position will increase Active Share without making the fund more active. R² relies on returns-based analysis, which does not distinguish between passive factor exposures and market timing, among other limitations. Hence, both metrics are susceptible to manipulation and may not properly identify passive funds.

A Robust Approach

The AlphaBetaWorks approach relies on risk and attribution capabilities free of the above issues. We surveyed ten years of historical holdings of approximately 1,700 non-index medium and lower turnover mutual funds with at least 5 years of position history. This group manages over $3.4 trillion in assets. We used our proprietary Statistical Equity Risk Model on historical holdings to estimate fund risk at the end of each month. We then attributed the following month’s returns to factor (market), and residual (security-specific) sources. We compared the variance of residual and factor returns of the group to NASDX, a NASDAQ 100 ETF. We selected this ETF as a passive reference strategy that is more concentrated than broad market benchmarks but less concentrated than granular sector indices. Using an S&P 100 ETF yields similar conclusions.

For NASDX, factor exposures at the end of a given month explain approximately 95% of return variance in the following month. The remaining 5% residual variance is due to security selection.

How active are funds in our group compared to this 100-position ETF? A quarter (425 funds) had a lower share of residual variance – they were less active stock pickers:

Security Selection Share of Historical US Mutual Fund Variance

Security Selection Share of Historical US Mutual Fund Variance

Security selection is not the only source of active performance. The variation in factor exposures, or factor (market) timing, is another. The NASDAX’s historical factor exposures were not constant over the last 10 years. This factor exposure variation is responsible for 4.1% of monthly return variance. Eighty percent (1,354 funds) had been less active market timers:

Market Timing Share of Historical US Mutual Fund Variance

Market Timing Share of Historical US Mutual Fund Variance

Active returns consist of both security selection and market timing. In the case of NASDX, 93.3% of its 10-year monthly return variance can be explained by passive factor bets, while 6.7% is active. We call the latter figure the Active Share of Variance.

Using the F test to evaluate whether historical Active Share of Variance of a given fund exceeded that of NASDX, we produced a confidence level that a fund has been more active than the ETF. The following chart illustrates the confidence that each fund in our group has been active and shows Historical Active Shares of Variance due to security selection and market timing:

Distribution of Historical Active Share of Variance and Confidence that a Fund is Active

Distribution of Historical Active Share of Variance and Confidence that a Fund is Active

At the 95% confidence level, fewer than half of the funds (737) have been more active than the ETF; more than a fifth (350) have been less active. The test is inconclusive for the remaining 36% (602 funds), suggesting that investors can’t be certain that over half the “active” mutual funds surveyed are in fact active:

Distribution of Confidence that a Fund is Active

Distribution of Confidence that a Fund is Active

Conclusions

  • Over half (56%) of active US mutual funds surveyed are not significantly more active than a 100-position NASDX ETF.
  • Less than half (44%) of the funds are significantly more active that the ETF.
  • More than a fifth (21%) of the funds are significantly less active than the ETF.
  • Investors must be sure that they are not being charged active fees for passive management.
  • By identifying closet indexers within this group alone, investors could save between $4 and $15 billion in annual management fees.

This work improves on traditional holdings-based and returns-based analyses of fund activity. Admittedly, we use a subjective benchmark for activity – a specific passive ETF. In later notes we will use the AlphaBetaWorks Performance Analytics Platform to evaluate activity levels using objective metrics.

Copyright © 2012-2014, AlphaBetaWorks, a division of Alpha Beta Analytics, LLC. All rights reserved.
Content may not be republished without express written consent.


Why Investment Risk and Skill Analytics Matter

If a fund posts returns that beat the indices, with moderate volatility and low benchmark correlation, there is no guarantee that such performance will continue. Comparable results might have been achievable with a passive portfolio. The fund could have taken hidden systematic risks or it may have been lucky. This happens often. Among Medium Turnover U.S. Mutual Funds, the relative ranking of a fund’s returns in one sample of history is negatively correlated to its relative ranking in the other. When “skill” is evaluated naively, “the best” funds in one period tend to become “the “worst” in another and vice versa:

Chart Illustrating That U.S. Mutual Fund Returns Revert to the Mean

U.S. Mutual Fund Returns Revert

The Sharpe Ratio and similar metrics simply re-process the same return data, presenting it in a different form. They too suffer from the same problems as simple return ranking:

Chart Illustrating that U.S. Mutual Fund Sharpe Ratios Revert to the Mean

U.S. Mutual Fund Sharpe Ratios Revert

The challenge is to look beneath the surface to determine whether the true source of returns is investment skill (stock picking, market timing, etc.), or some combination of luck, high beta, and outsized risk. Investment skills, when properly measured, are significant predictors of future performance.

Properly-designed risk models can be used to filter out the effects of systematic risk, exotic market bets, and luck. When these models are designed from the ground-up to evaluate skill, and are combined with robust statistical techniques, the result is predictive analytics. The best funds in one period tend to remain the best in another.  Same for the worst:

A Chart Illustrating that AlphaBetaReturns Predict Future U.S. Mutual Fund Performance

αβReturns Predict Future U.S. Mutual Fund Performance

AlphaBetaWorks focuses on the development of robust risk models that result in the evaluation of investment risk and predictive investment skills.

Copyright © 2012-2014, AlphaBetaWorks, a division of Alpha Beta Analytics, LLC. All rights reserved.
Content may not be republished without express written consent.