The 2014-2015 energy carnage has been worse for crowded hedge fund energy positions than the global financial crisis. Past liquidations of crowded hedge fund bets were followed by rapid recoveries. Consequently, energy investors should survey the wreckage for opportunities.
Crowded hedge fund oil and gas producers underperformed their sector peers by over 20% since 2013 as fund energy books were liquidated. Crowded oilfield service bets underperformed by over 15%. This is worse than 10-15% underperformance during the 2008-2009 global financial crisis.
Forced hedge fund portfolio liquidations are usually followed by rapid recoveries in the affected names – liquidations during the global financial crisis reversed in under a year. Since the energy market in 2015 faces unique challenges, history may not repeat itself. Still, some of the crowded positions should present opportunities.
Performance of Crowded Hedge Fund Oil and Gas Producer Bets
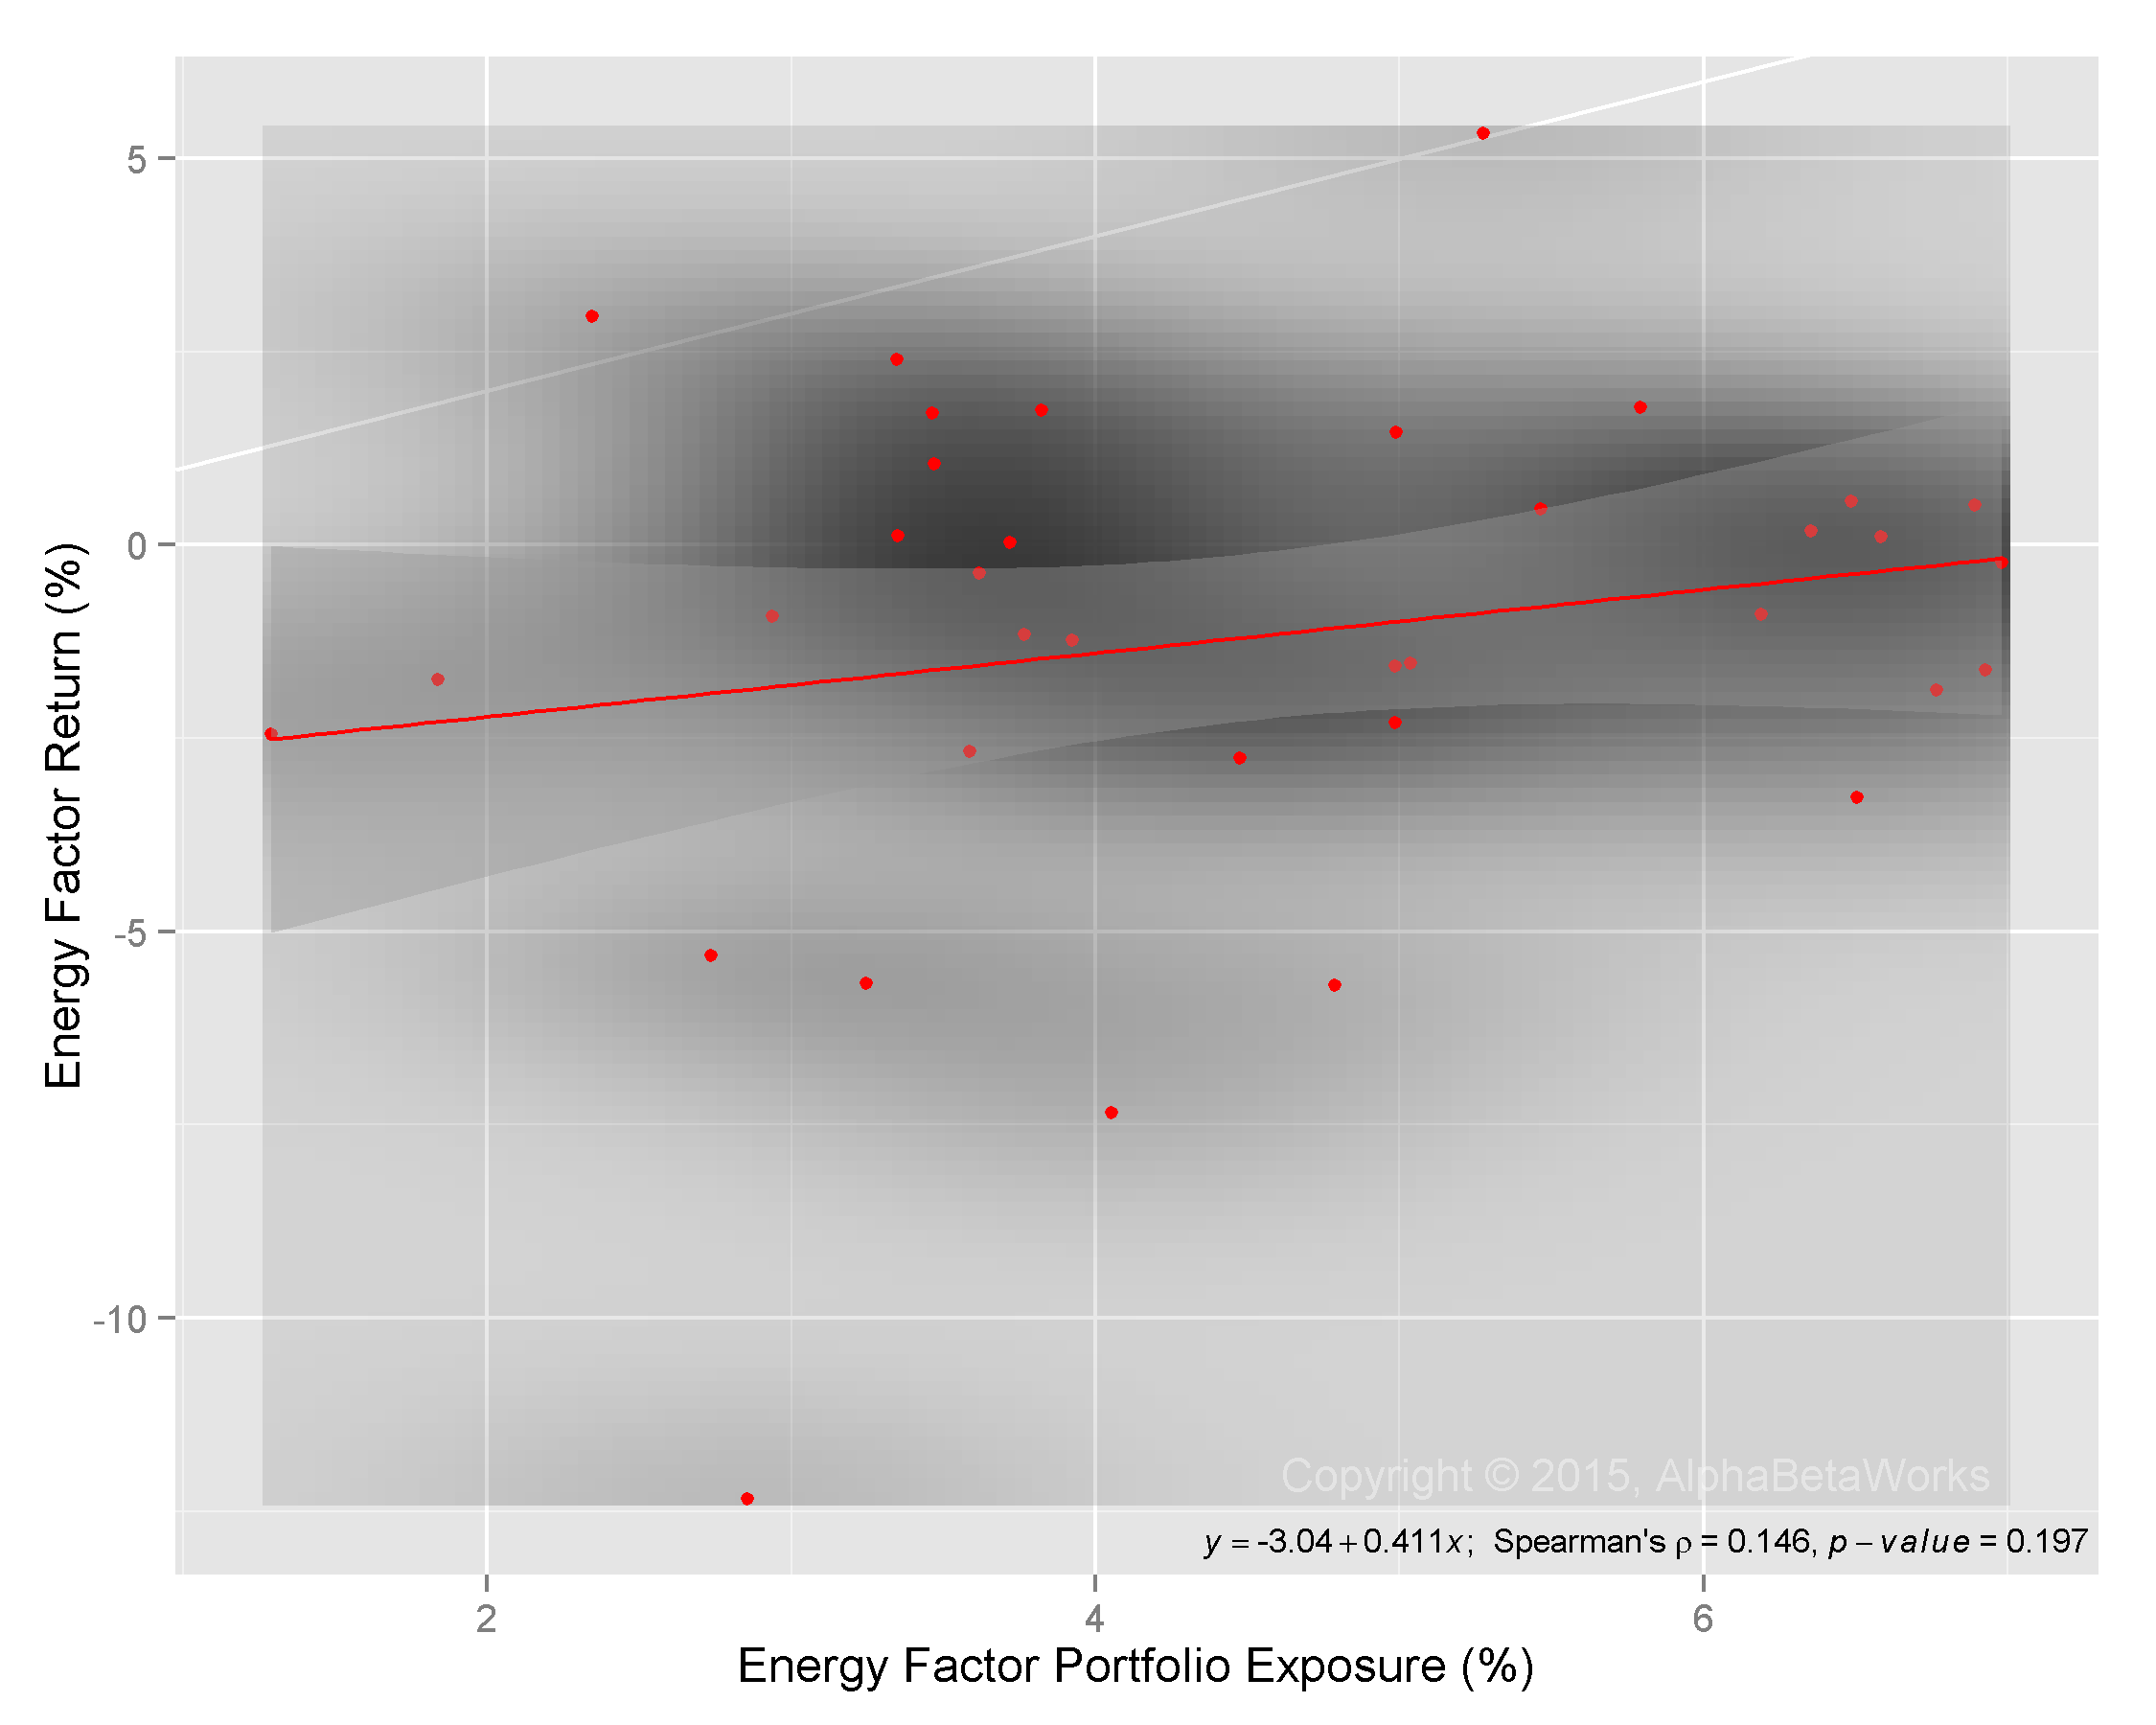
To explore crowding we analyze hedge fund Oil and Gas Producer Sector holdings (HF Sector Aggregate) relative to the Sector Market Portfolio (Sector Aggregate). HF Sector Aggregate is position-weighted; Sector Aggregate is capitalization-weighted. This follows the approach of our earlier articles on hedge fund crowding.
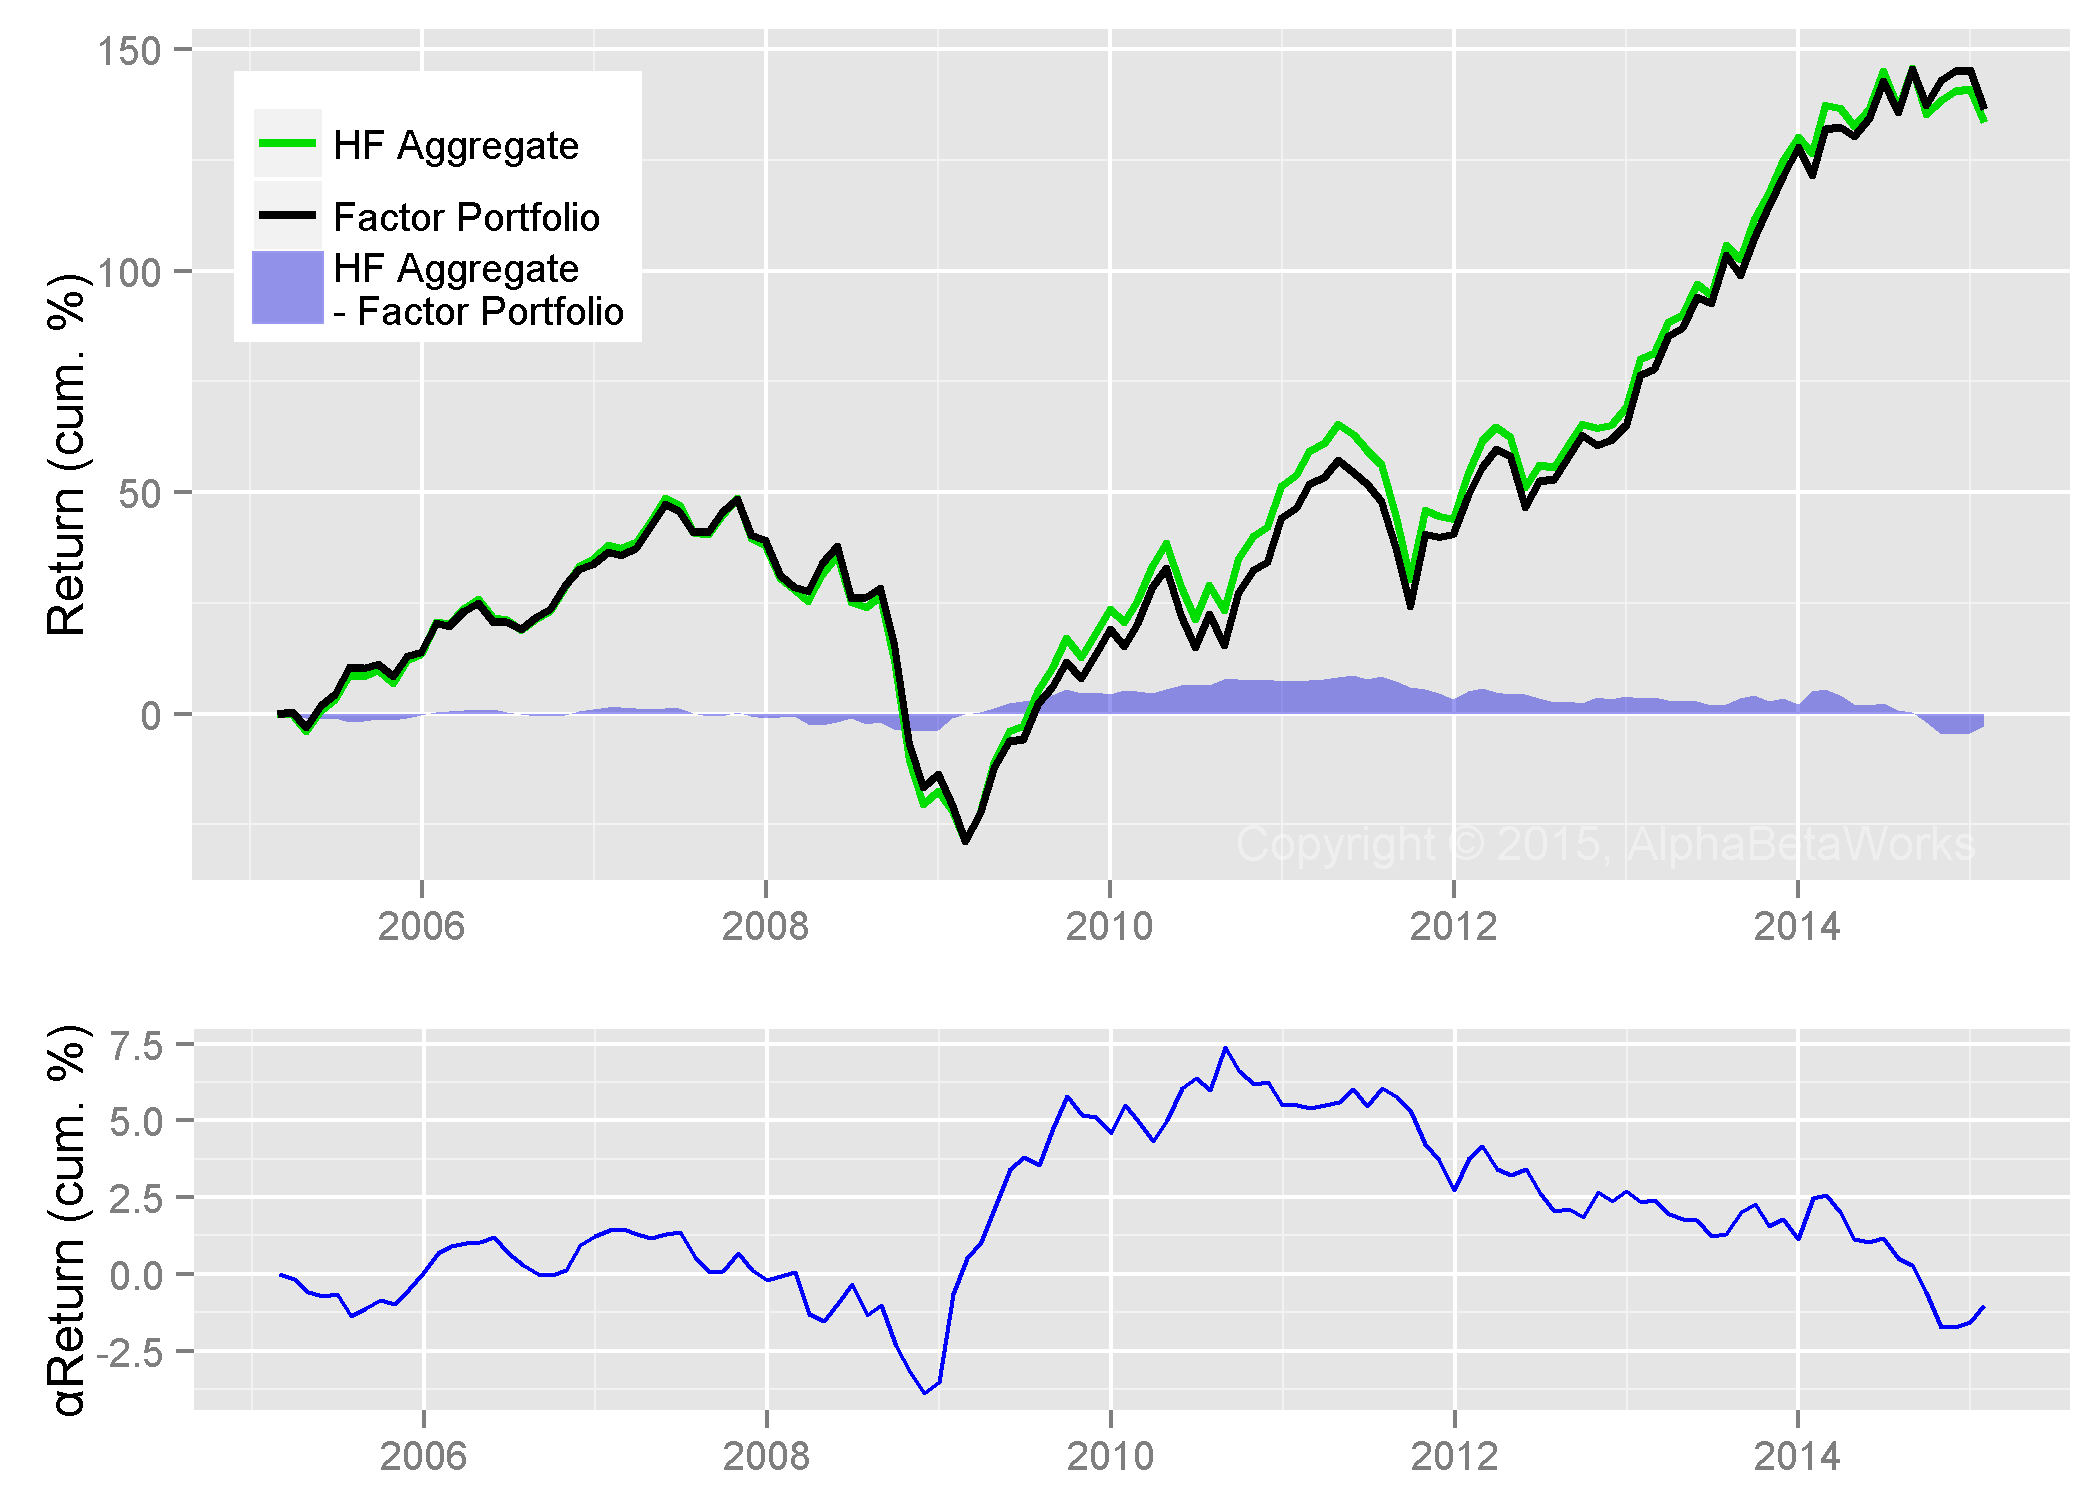
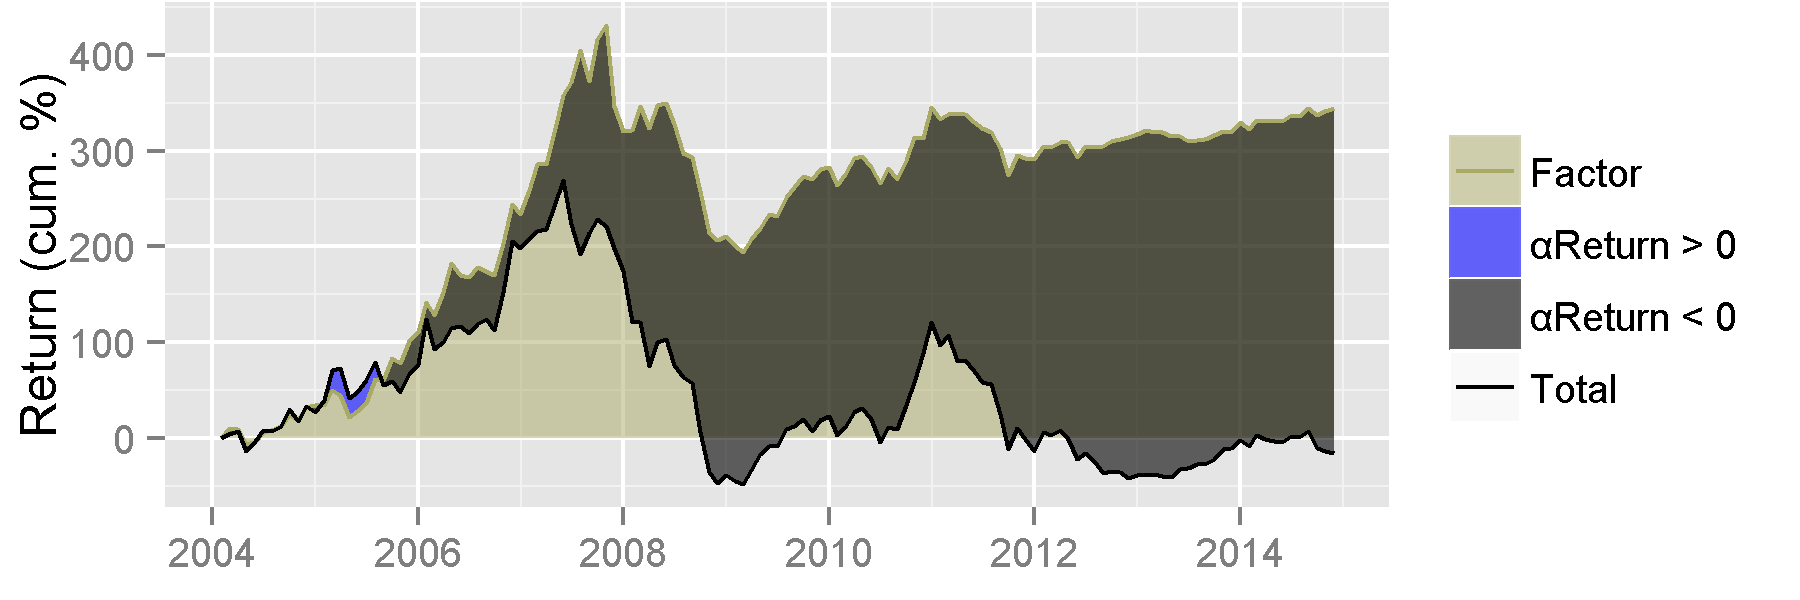
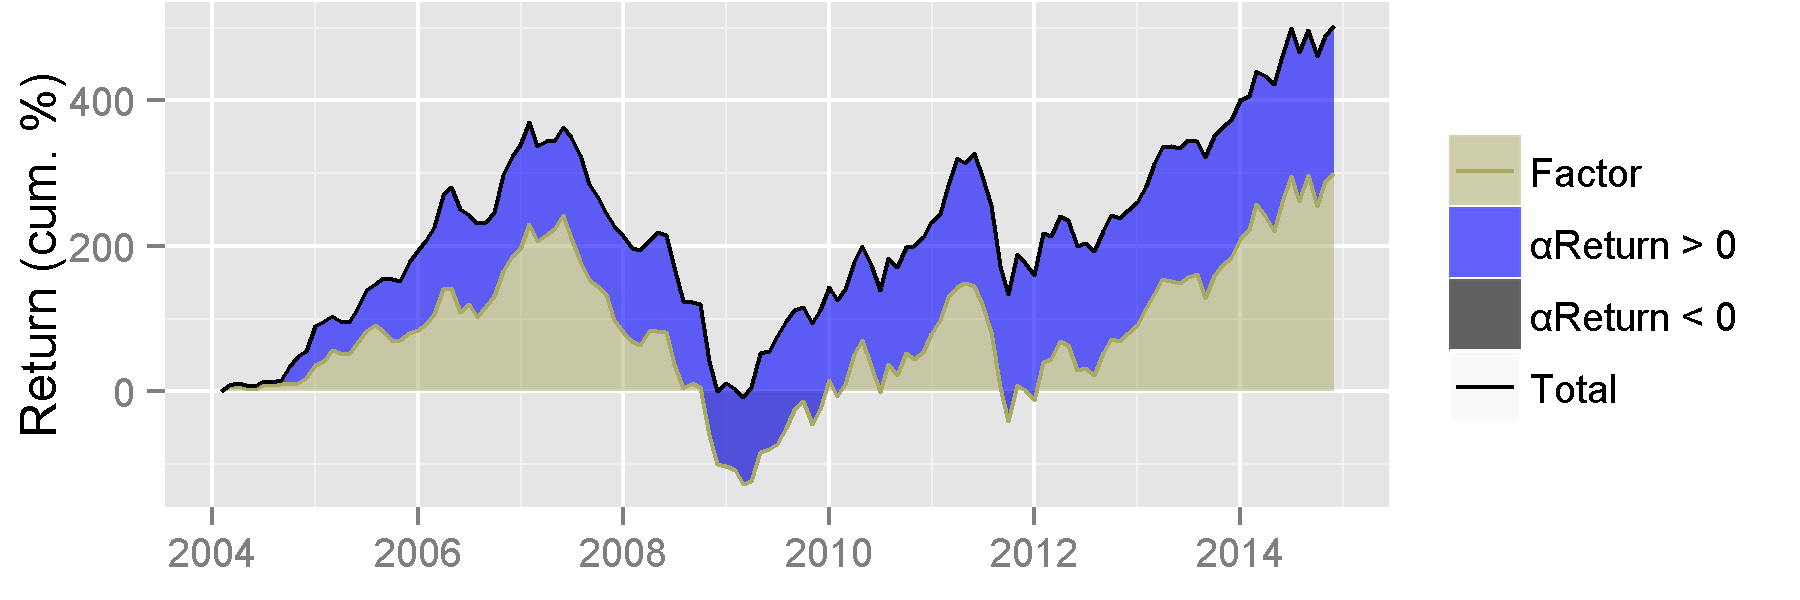
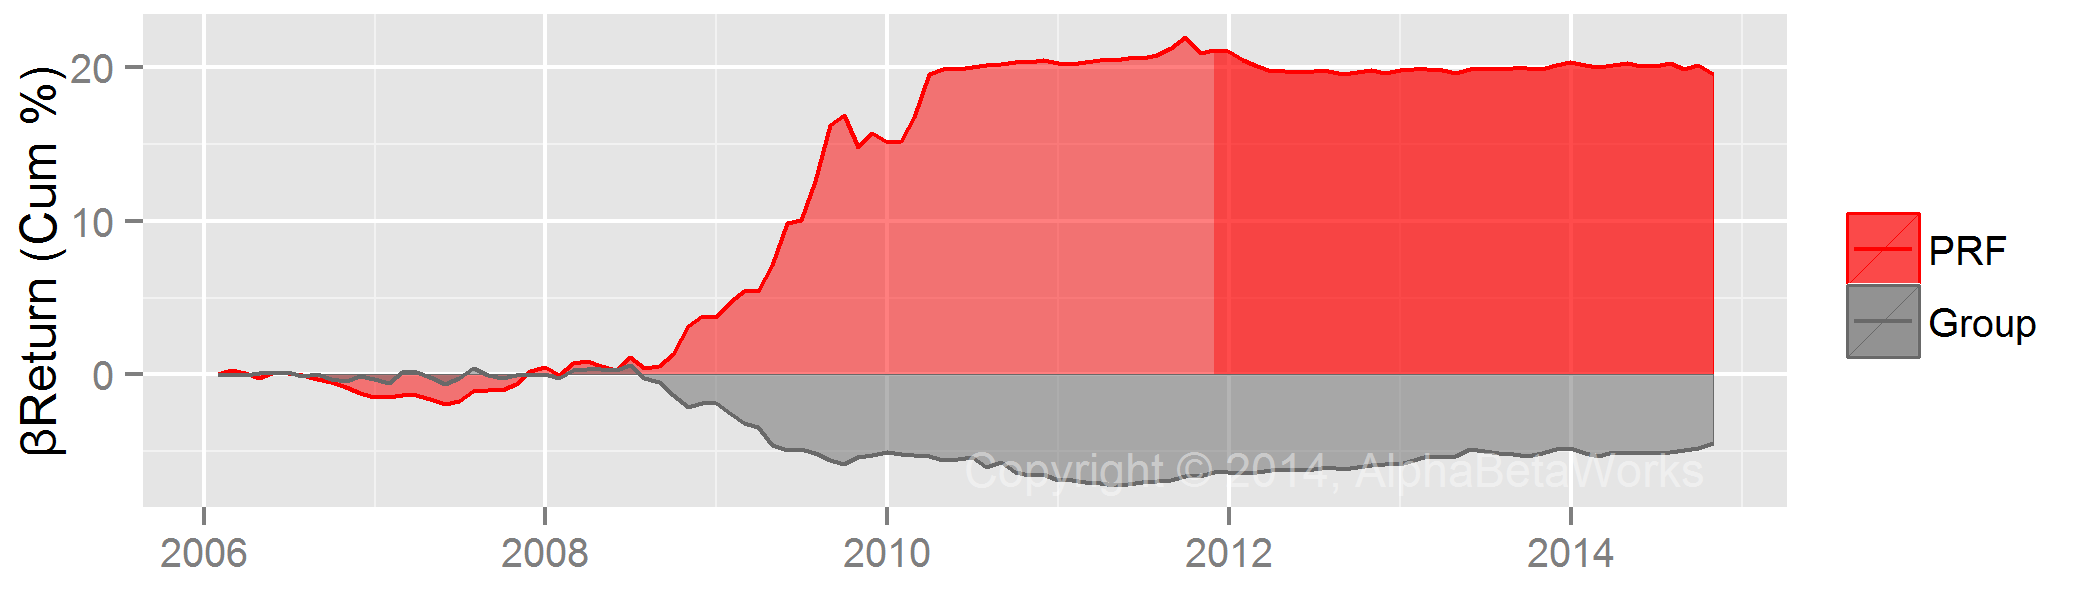
The figure below plots historical return of HF Oil and Gas Producer Aggregate. Factor return is due to systematic (market) risk. Blue area represents positive and gray area represents negative risk-adjusted returns from security selection (αReturn). Crowded bets underperformed the portfolio with the same systematic risk (factor portfolio) by over 50% during the past 10 years, largely since 2014:

Hedge Fund Oil and Gas Producer Sector Aggregate Historical Performance
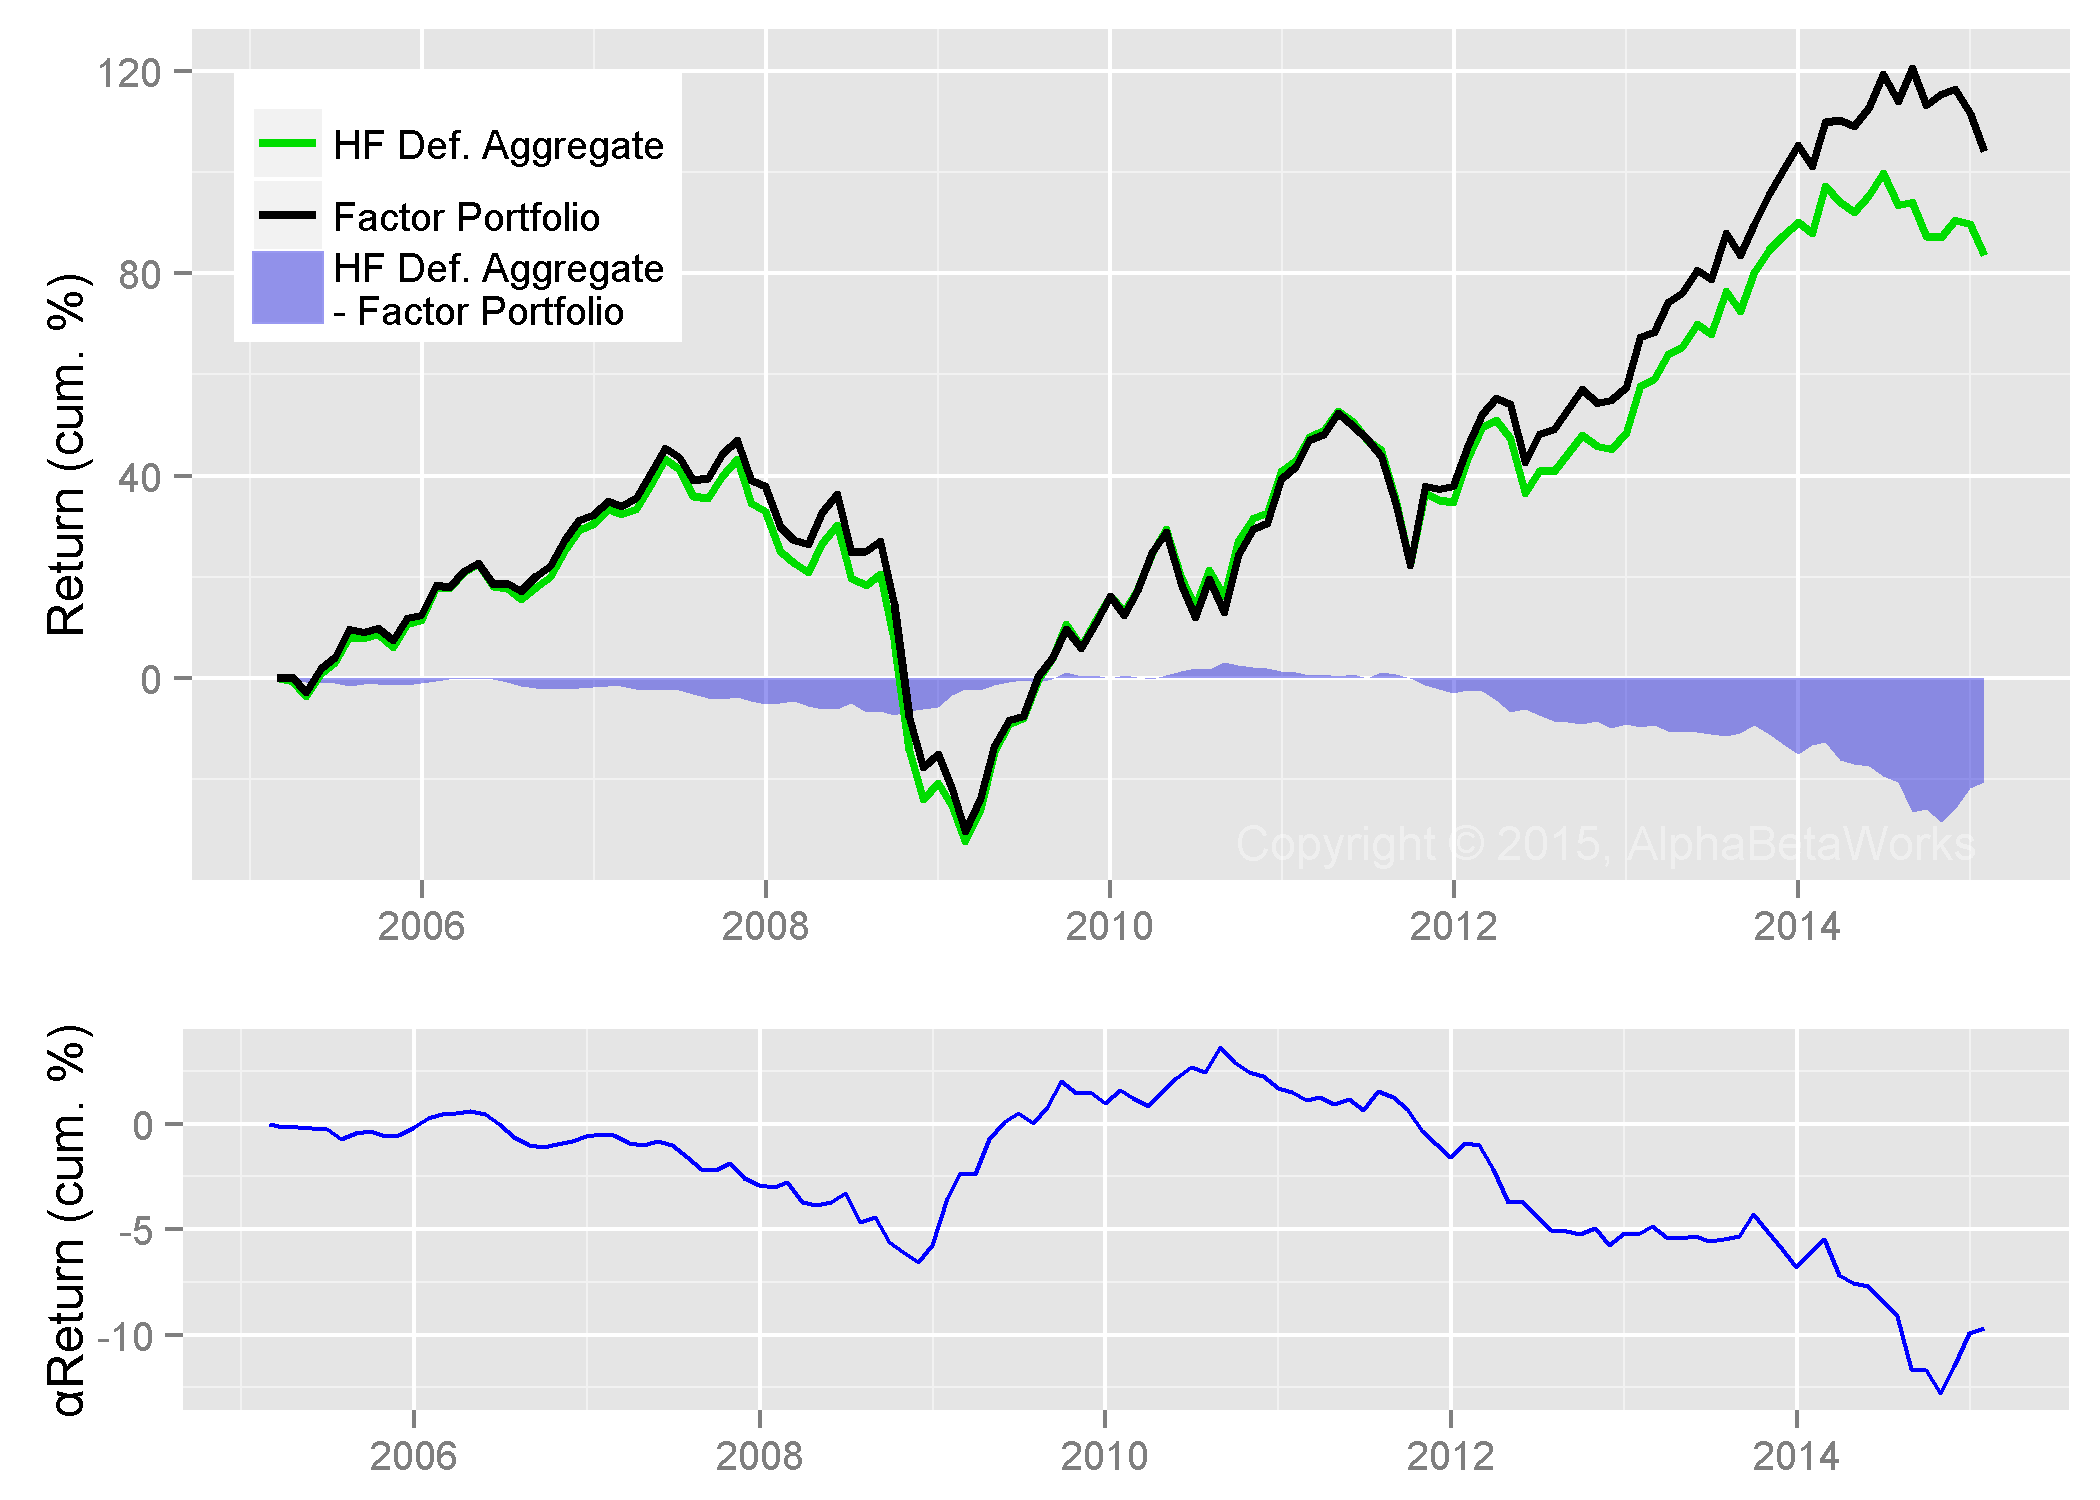
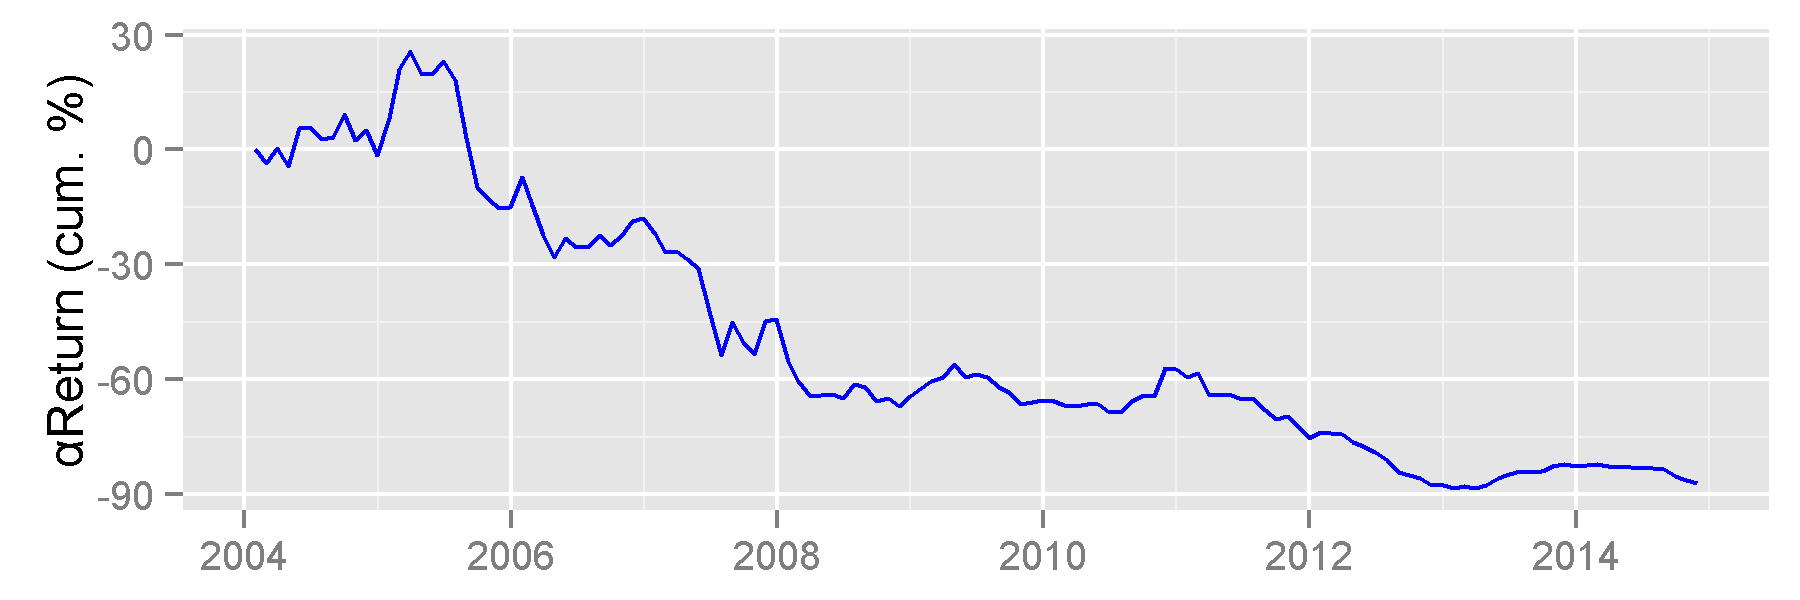
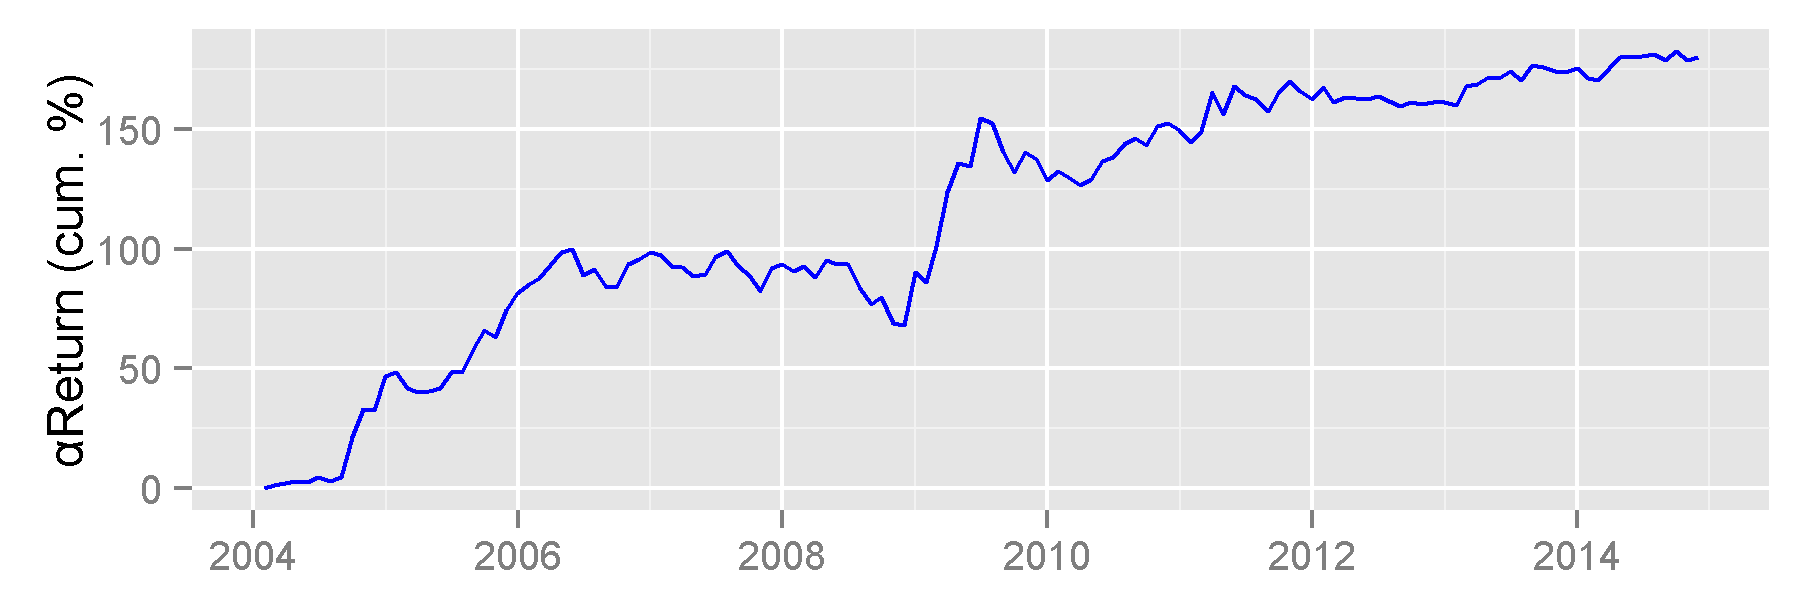
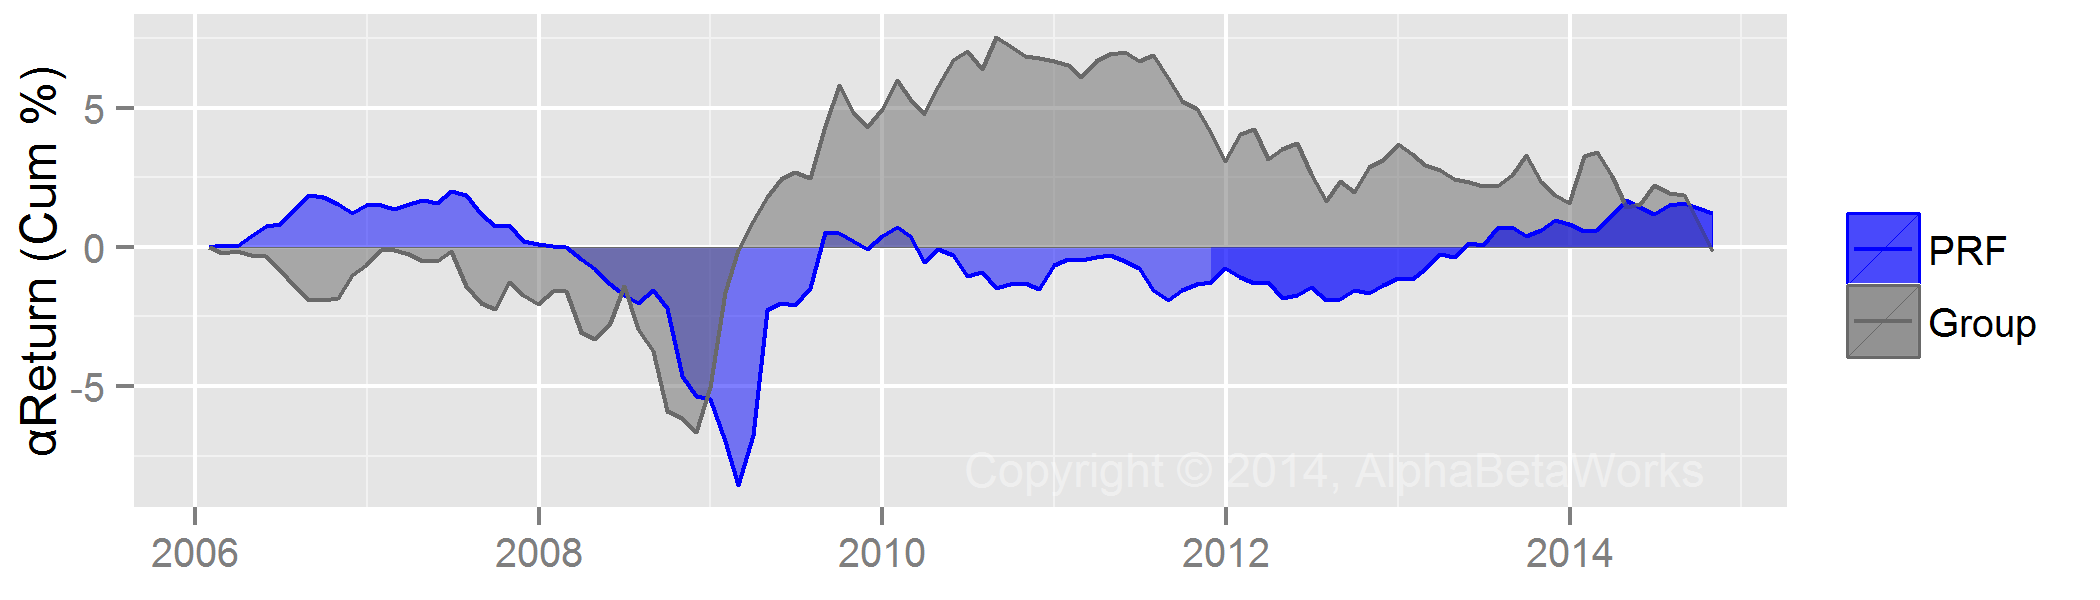
The risk-adjusted return from security selection (αReturn) of HF Sector Aggregate is the return it would have generated if markets had been flat – all market effects on performance have been eliminated. This is the idiosyncratic performance of HF Sector Aggregate:

Hedge Fund Oil and Gas Producer Sector Aggregate Historical Security Selection Performance
The above chart reveals that by Q2 2009 the crowded hedge fund energy producers erased underperformance due to 2008 liquidation. The liquidation since 2013 has been even larger than in 2008. Since they may be posed for a steep recovery, crowded hedge fund oil and gas producer bets are worth watching in the coming months.
Performance of Crowded Hedge Fund Oilfield Service Bets
The figure below plots historical return of HF Oilfield Service Aggregate. It follows the approach of HF Oil and Gas Producer Aggregate above:

Hedge Fund Oilfield Service Sector Aggregate Historical Performance
Since 2013, the crowded oilfield service portfolio has underperformed, similarly to the crowded oil and gas portfolio:

Hedge Fund Oilfield Service Sector Aggregate Historical Security Selection Performance
Crowded energy producers and service companies have underperformed sector peers by 15-25% in the latest liquidation. Many may now be attractive, given the recovery that typically follows. Below are the hedge fund energy bets that may present these opportunities:
Crowded Hedge Fund Oil and Gas Producer Bets
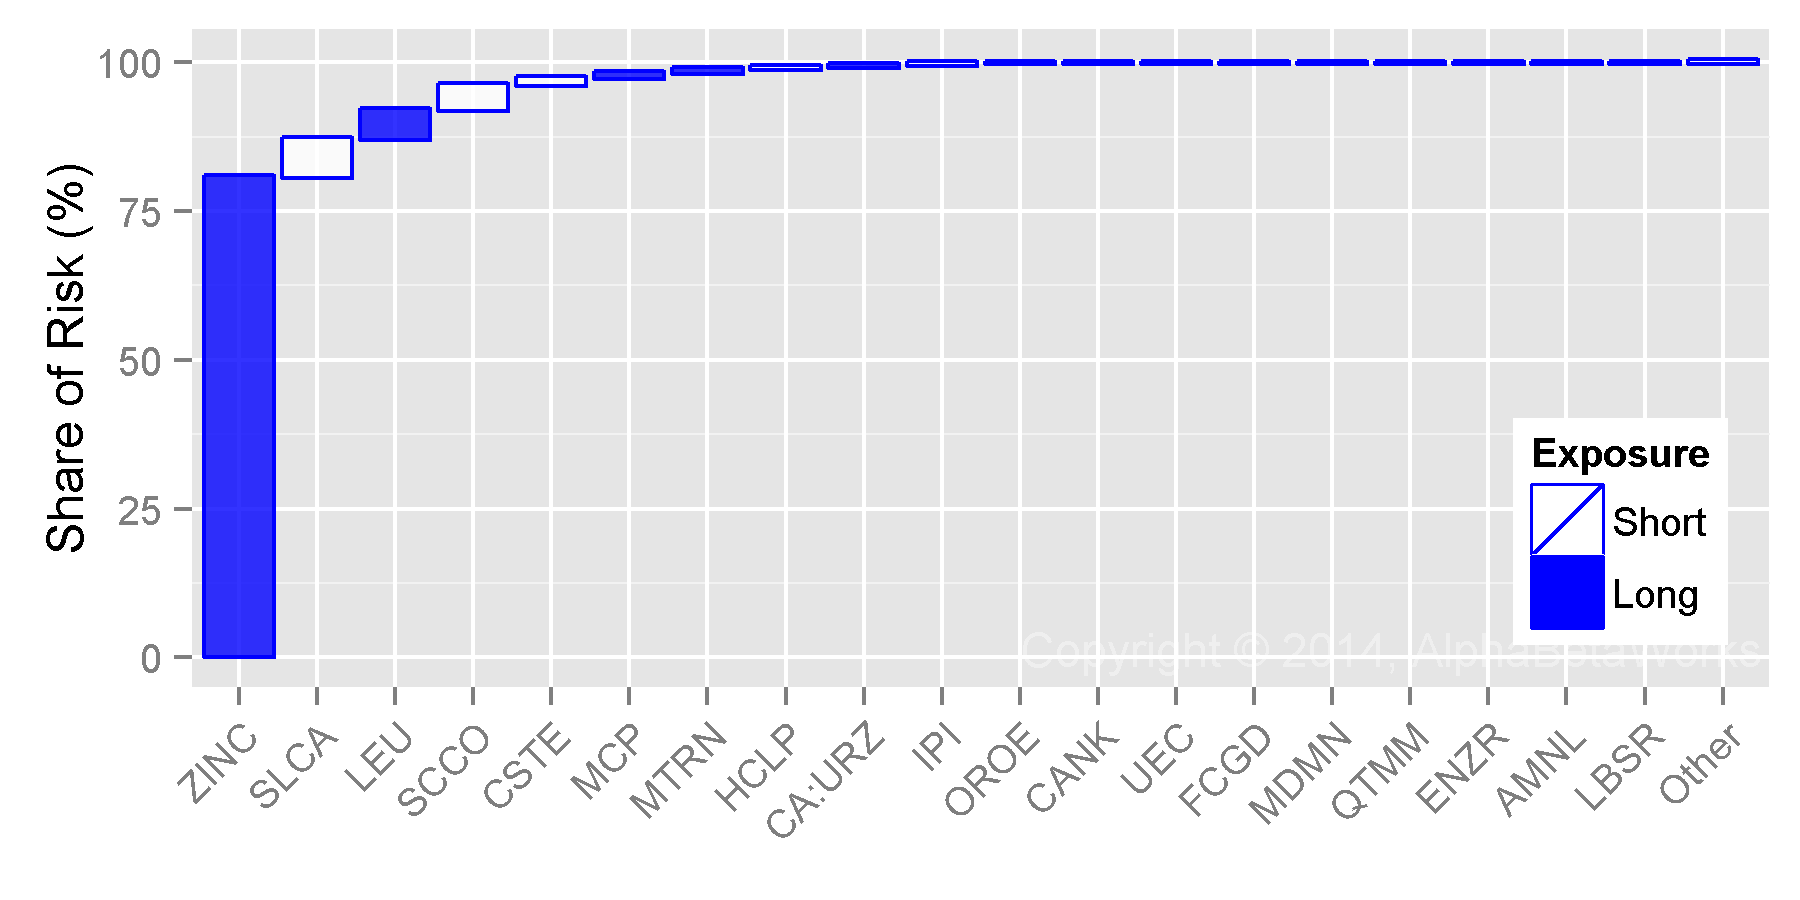
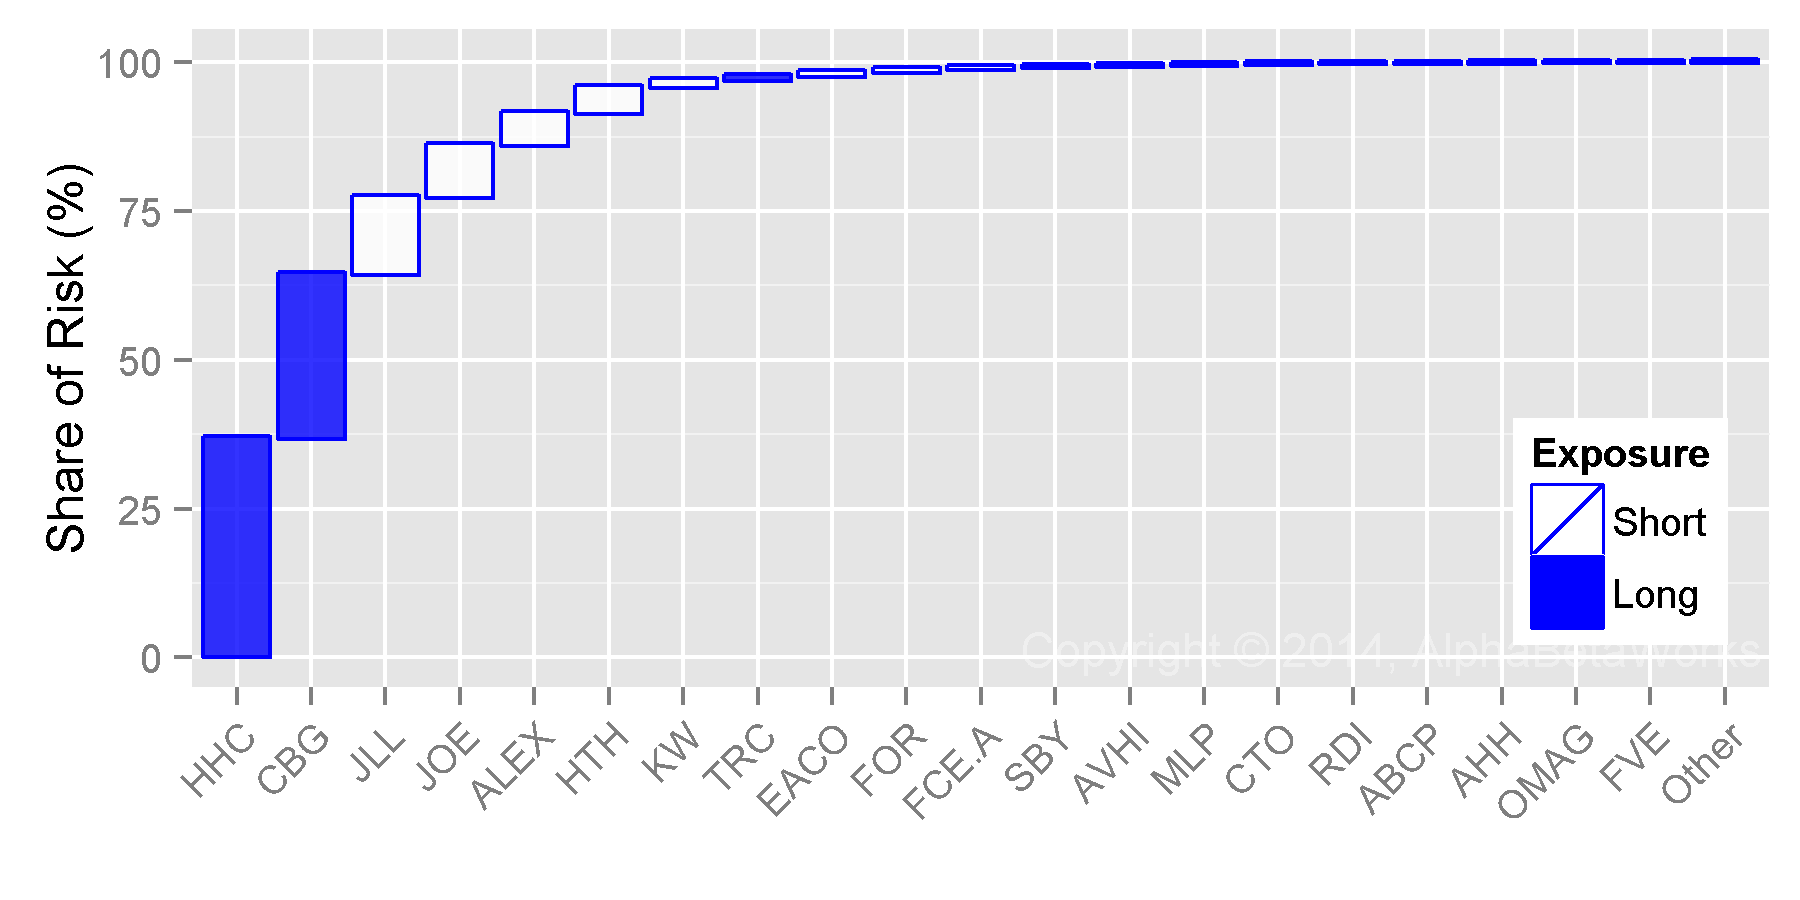
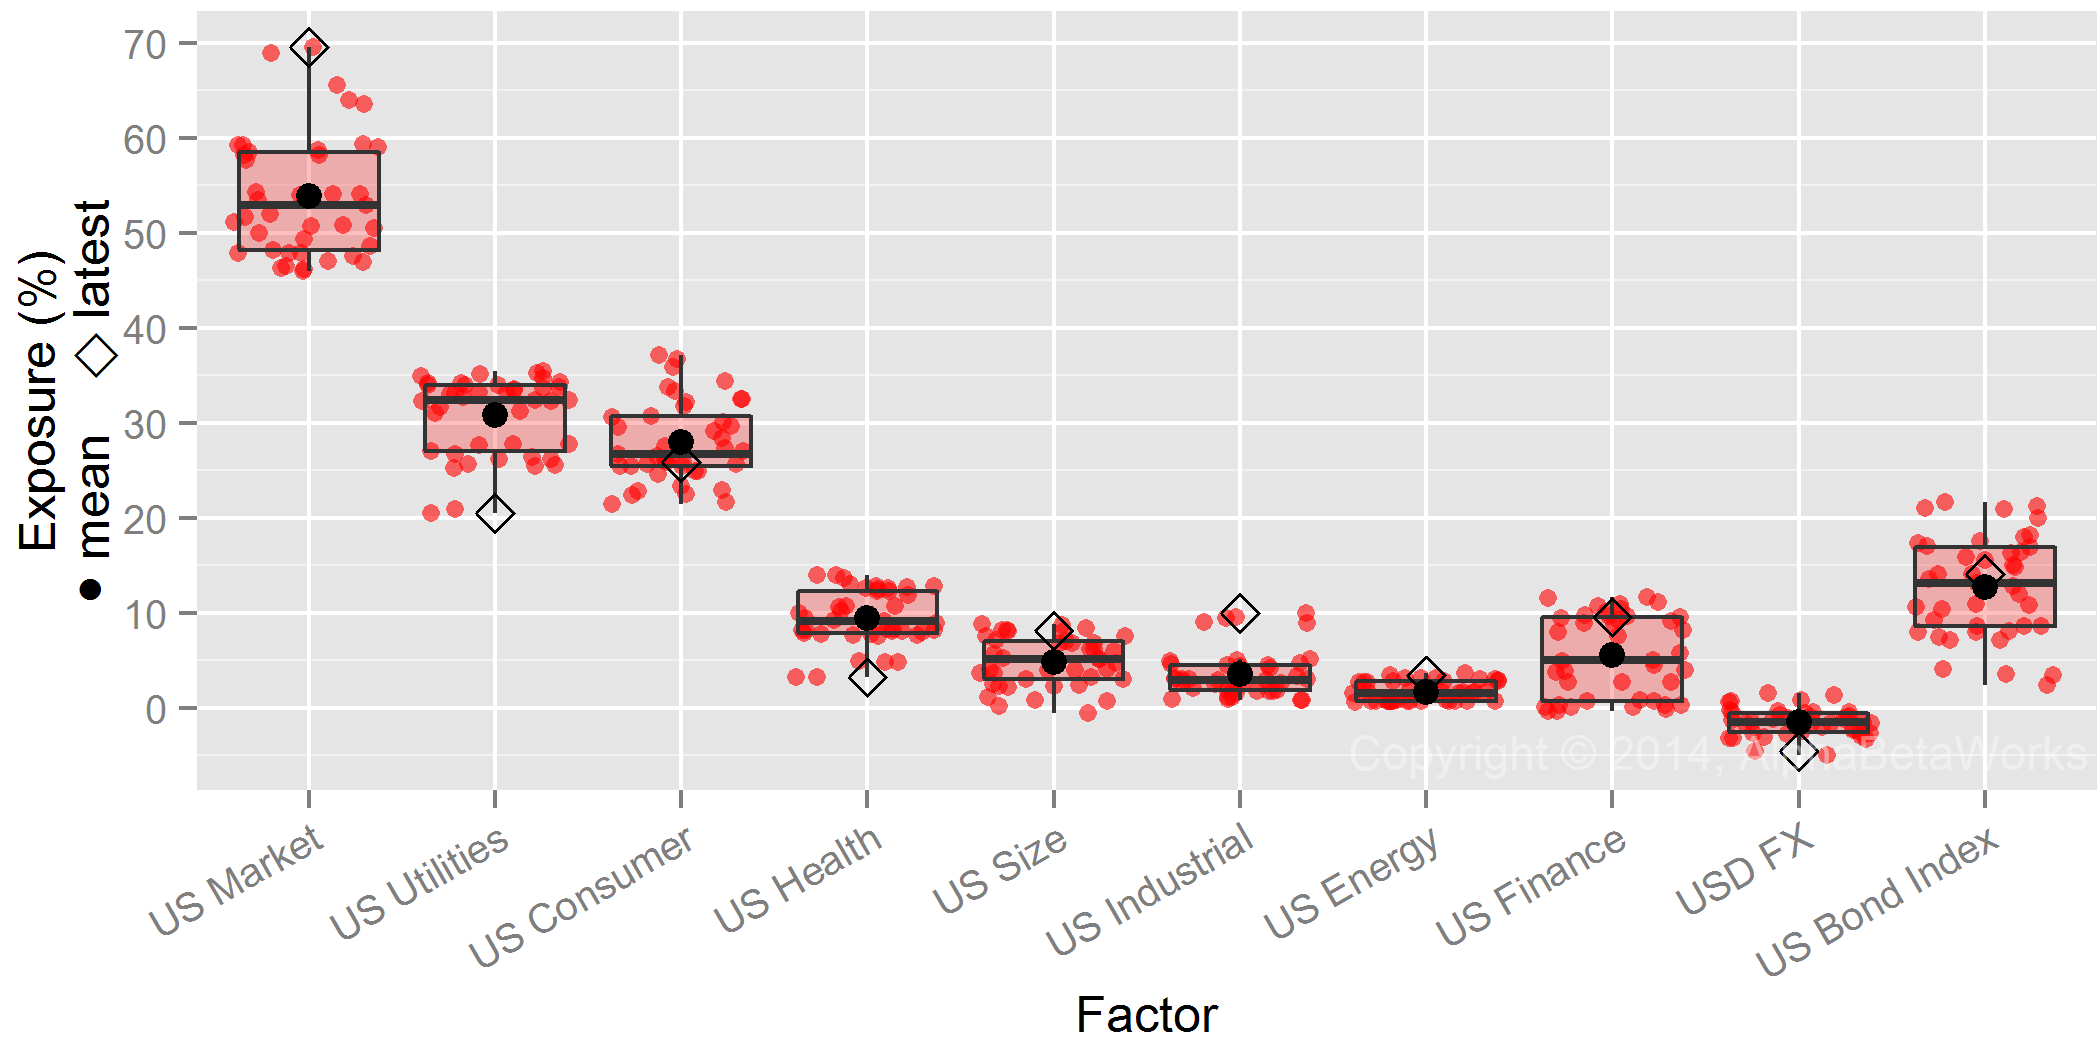
The following stocks contributed most to the relative residual (idiosyncratic, security-specific) risk of the HF Oil and Gas Aggregate as of Q1 2015. Blue bars represent long (overweight) exposures relative to Sector Aggregate. White bars represent short (underweight) exposures. Bar height represents contribution to relative stock-specific risk:

Crowded Hedge Fund Oil and Gas Producer Bets
The following table contains detailed data on these crowded hedge fund oil and gas producer bets:
|
Exposure (%) |
Net Exposure |
Share of Risk (%) | |||||
| HF Sector Aggr. | Sector Aggr. | % | $mil | Days of Trading | |||
| WPZ | Williams Partners, L.P. | 17.93 | 4.75 | 13.18 | 1,812.2 | 15.0 | 23.04 |
| PXD | Pioneer Natural Resources Company | 14.42 | 4.01 | 10.41 | 1,432.0 | 4.9 | 17.91 |
| CRC | California Resources Corp | 3.42 | 0.48 | 2.93 | 403.2 | 8.2 | 10.79 |
| CHK | Chesapeake Energy Corporation | 8.31 | 1.55 | 6.76 | 930.1 | 2.8 | 9.95 |
| COP | ConocoPhillips | 0.99 | 12.62 | -11.63 | -1,599.0 | -3.7 | 7.00 |
| OXY | Occidental Petroleum Corporation | 0.69 | 9.25 | -8.56 | -1,176.6 | -3.3 | 5.45 |
| EOG | EOG Resources, Inc. | 2.13 | 8.28 | -6.14 | -844.7 | -2.4 | 4.40 |
| RRC | Range Resources Corporation | 5.33 | 1.45 | 3.88 | 533.8 | 3.4 | 3.68 |
| CIE | Cobalt International Energy, Inc. | 3.10 | 0.64 | 2.46 | 338.2 | 11.2 | 2.93 |
| OAS | Oasis Petroleum Inc. | 3.15 | 0.33 | 2.82 | 387.9 | 2.7 | 2.39 |
| CMLP | Crestwood Midstream Partners LP | 3.83 | 0.45 | 3.38 | 465.2 | 47.0 | 1.99 |
| AR | Antero Resources Corporation | 3.97 | 1.60 | 2.37 | 325.5 | 4.5 | 1.39 |
| WLL | Whiting Petroleum Corporation | 3.57 | 1.04 | 2.53 | 347.5 | 1.2 | 1.06 |
| NBL | Noble Energy, Inc. | 0.28 | 3.12 | -2.84 | -390.1 | -2.2 | 0.80 |
| CLR | Continental Resources, Inc. | 0.18 | 2.68 | -2.50 | -344.1 | -2.2 | 0.76 |
| COG | Cabot Oil \& Gas Corporation | 0.49 | 2.01 | -1.52 | -209.5 | -1.1 | 0.71 |
| DVN | Devon Energy Corporation | 0.55 | 4.06 | -3.51 | -483.0 | -2.2 | 0.62 |
| EQT | EQT Corporation | 0.16 | 2.07 | -1.91 | -262.3 | -2.5 | 0.59 |
| APA | Apache Corporation | 1.15 | 3.74 | -2.59 | -356.6 | -1.7 | 0.47 |
| APC | Anadarko Petroleum Corporation | 4.99 | 7.02 | -2.04 | -280.2 | -0.8 | 0.43 |
| … | Other Positions | 0.80 | 3.65 | ||||
| Total | 100.00 | ||||||
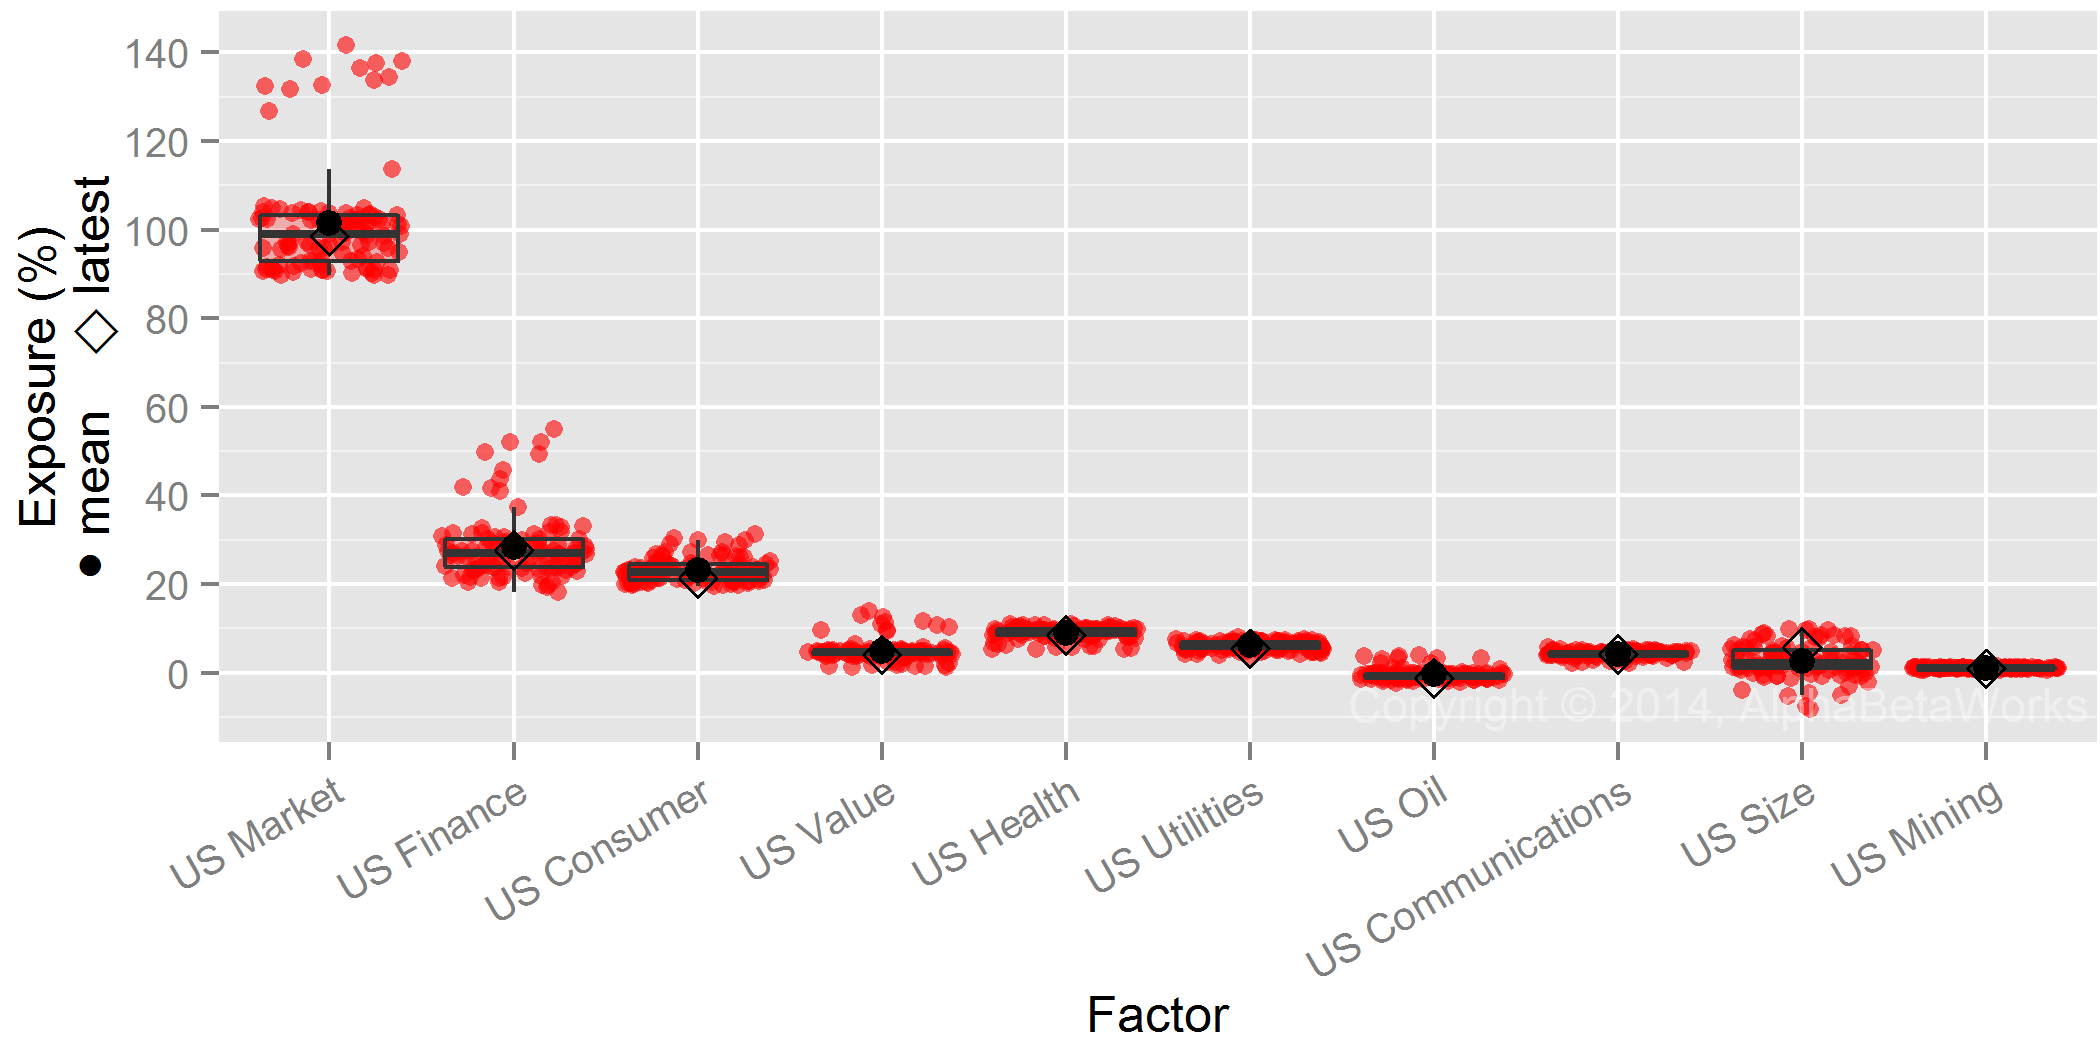
Crowded Hedge Fund Oilfield Service Bets
The following stocks contributed most to the relative residual risk of the HF Sector Aggregate as of Q1 2015:

Crowded Hedge Fund Oilfield Service Bets
The following table contains detailed data on these crowded hedge fund oilfield service bets:
| Exposure (%) | Net Exposure | Share of Risk (%) | |||||
| HF Sector Aggr. | Sector Aggr. | % | $mil | Days of Trading | |||
| BHI | Baker Hughes Incorporated | 32.63 | 9.95 | 22.68 | 1,258.9 | 6.1 | 50.38 |
| SLB | Schlumberger NV | 3.31 | 38.39 | -35.07 | -1,946.7 | -2.8 | 22.65 |
| HAL | Halliburton Company | 28.87 | 13.42 | 15.45 | 857.4 | 1.4 | 12.44 |
| DAKP | Dakota Plains Holdings, Inc. | 0.31 | 0.04 | 0.27 | 15.1 | 78.3 | 3.86 |
| HOS | Hornbeck Offshore Services, Inc. | 3.21 | 0.24 | 2.97 | 164.9 | 6.8 | 1.89 |
| NOV | National Oilwell Varco, Inc. | 2.88 | 7.38 | -4.49 | -249.4 | -0.9 | 1.45 |
| FTI | FMC Technologies, Inc. | 0.02 | 3.08 | -3.06 | -169.9 | -1.2 | 1.06 |
| FTK | Flotek Industries, Inc. | 1.51 | 0.29 | 1.22 | 67.9 | 5.8 | 0.85 |
| WFT | Weatherford International plc | 1.25 | 3.43 | -2.18 | -121.1 | -1.0 | 0.71 |
| CLB | Core Laboratories NV | 0.00 | 1.62 | -1.62 | -90.0 | -1.1 | 0.57 |
| SDRL | Seadrill Ltd. | 0.00 | 1.66 | -1.66 | -92.1 | -0.6 | 0.49 |
| OIS | Oil States International, Inc. | 2.71 | 0.74 | 1.97 | 109.5 | 2.7 | 0.39 |
| EXH | Exterran Holdings, Inc. | 1.98 | 0.83 | 1.14 | 63.4 | 2.6 | 0.36 |
| USAC | USA Compression Partners LP | 1.80 | 0.24 | 1.56 | 86.6 | 45.7 | 0.31 |
| OII | Oceaneering International, Inc. | 0.13 | 1.93 | -1.81 | -100.3 | -1.5 | 0.27 |
| FI | Frank’s International NV | 0.00 | 1.04 | -1.04 | -57.7 | -4.2 | 0.26 |
| KNOP | KNOT Offshore Partners LP | 2.31 | 0.12 | 2.19 | 121.4 | 47.1 | 0.25 |
| RES | RPC, Inc. | 0.05 | 1.00 | -0.96 | -53.0 | -2.0 | 0.23 |
| WG | Willbros Group, Inc. | 0.46 | 0.07 | 0.39 | 21.5 | 11.3 | 0.19 |
| MDR | McDermott International, Inc. | 1.04 | 0.33 | 0.71 | 39.5 | 1.4 | 0.17 |
| … | Other Positions | 0.34 | 1.22 | ||||
| Total | 100.00 | ||||||
Summary
- The 2014-2015 carnage has been worse for crowded hedge fund oil and gas producer and oilfield service bets than the global financial crisis.
- Past liquidations of crowded positions were followed by rapid recoveries.
- Energy investors should survey the wreckage of crowded hedge fund energy bets for opportunities.
The information herein is not represented or warranted to be accurate, correct, complete or timely.
Past performance is no guarantee of future results.
Copyright © 2012-2015, AlphaBetaWorks, a division of Alpha Beta Analytics, LLC. All rights reserved.
Content may not be republished without express written consent.