What Fraction of International Smart Beta is Dumb Beta?

Though many smart beta ETFs do provide valuable exposures, others mainly re-shuffle familiar dumb beta factors. Our earlier article showed that traditional, or dumb, Market and Sector Betas account for over 92% of monthly return variance for most U.S. equity smart beta ETFs. This article extends the analysis to international smart beta ETFs.

It turns out that international smart beta ETFs are even more heavily dominated by dumb beta factors than their U.S. counterparts. Consequently, rigorous quantitative analysis is even more critical when deploying smart beta strategies internationally. With capable analytics, investors and allocators can detect unnecessarily complex and expensive re-packaging of dumb international factors as smart beta, identify products that do provide unique exposures, and control for unintended international dumb factor exposures.

Measuring the Influence of Dumb Beta Factors on International Smart Beta ETFs

We started with approximately 800 smart beta ETFs. Since our focus was on the broad international equity strategies, we removed portfolios with over 90% invested in U.S. equities and portfolios dominated by a single sector. We also removed portfolios for which returns estimated from historical positions did not reconcile closely with actual returns. We were left with 125 broad international equity smart beta ETFs, covering all the popular international smart beta strategies.

For each ETF, we estimated monthly positions and then used these positions to calculate portfolio factor exposures to traditional (dumb beta) factors such as global Regions (regional equity markets) and Sectors.  These ex-ante dumb factor exposures provided us with replicating portfolios composed solely of traditional dumb beta factors. For each international smart beta ETF, we compared replicating portfolio returns to actual returns over the past 10 years, or over the ETF history, whichever was shorter.

The correlation between replicating dumb factor portfolio returns and actual ETF returns quantifies the influence of dumb beta factors on international smart beta ETFs. The higher a correlation, the more similar an ETF is to a portfolio of traditional, simple, and dumb systematic risk factors.

The Influence of Region Beta on International Smart Beta ETFs

Our simplest test used a single systematic risk factor for each security – Region (Region Market Beta). Region Beta measures exposure to one of 10 broad regional equity markets (e.g., North America, Developing Asia). These are the dumbest traditional international factors and also the cheapest to invest in. Since Market Beta is the dominant factor behind portfolio performance, even a very simple model measuring exposures to regional equity markets with robust statistical techniques delivered 0.95 mean and 0.96 median correlations between replicating dumb factor portfolio returns and actual monthly returns for international smart beta ETFs:

Chart of the correlations between returns of replicating portfolios constructed using Region Factors and actual historical returns for over international smart beta equity ETFs

International Smart Beta Equity ETFs: Correlation between replicating Region Factor portfolio returns and actual monthly returns

  Min. 1st Qu.  Median    Mean 3rd Qu.    Max. 
0.6577  0.9390  0.9645  0.9461  0.9818  0.9975

In short: For most broad international smart beta ETFs, Region Market Betas account for at least 93% (0.9645²) of monthly return variance.

The Influence of Region and Sector Betas on International Smart Beta ETFs

We next tested a two-factor model that added Sector Factors. Each security belongs to one of 10 broad sectors (e.g., Energy, Technology). Region and Sector Betas, estimated with robust methods, delivered 0.96 mean and 0.97 median correlations between replicating dumb factor portfolio returns and actual monthly returns for international smart beta ETFs:

Chart of the correlations between returns of replicating portfolios constructed using Region and Sector Factors and actual historical returns for over international smart beta equity ETFs

International Smart Beta Equity ETFs: Correlation between replicating Region and Sector Factor portfolio returns and actual monthly returns

  Min. 1st Qu.  Median    Mean 3rd Qu.    Max. 
0.7017  0.9526  0.9722  0.9578  0.9849  0.9941

In short: For most broad international equity smart beta ETFs, Regional Market and Sector Betas account for over 94% (0.9722²) of monthly return variance. Put differently, only less than 6% of the variance is not attributable to simple Region and Sector factors.

International Smart Beta Variance and International Dumb Beta Variance

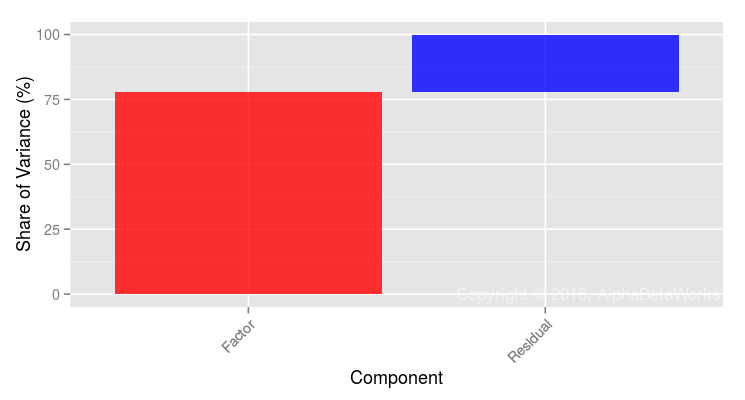
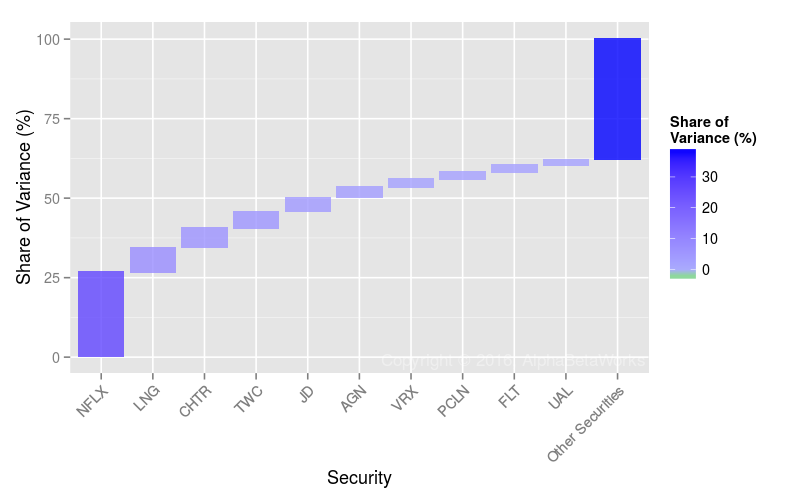
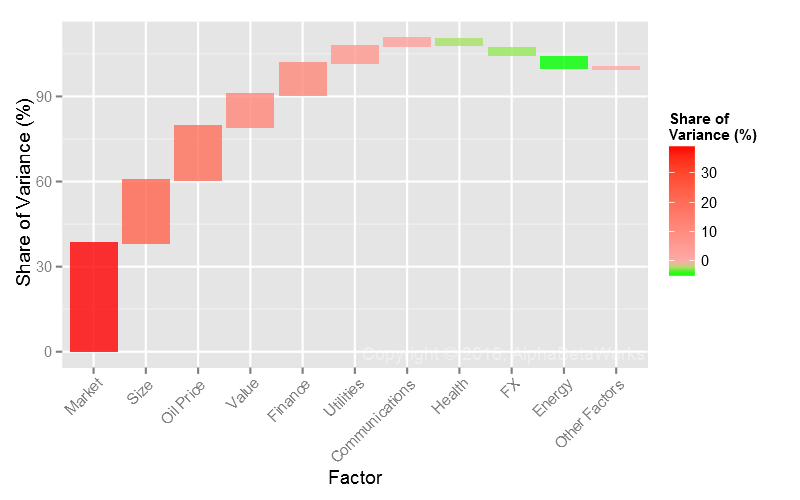
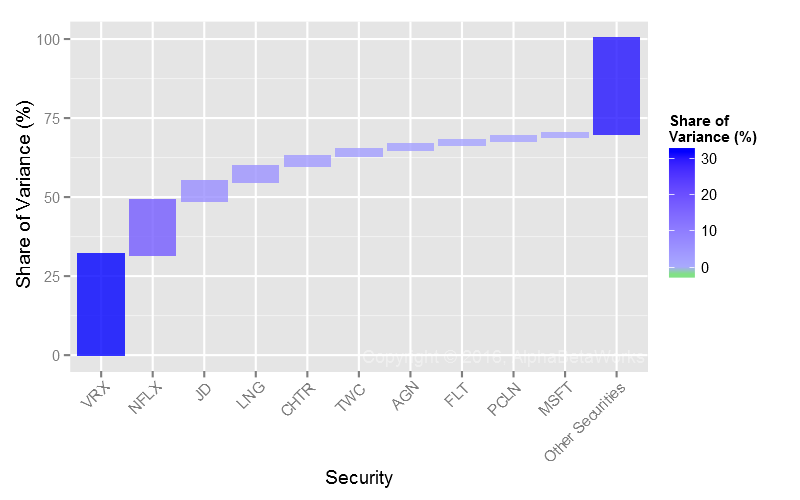
Rather than measure correlations between replicating dumb beta portfolio returns and actual ETF returns, we can instead measure the fraction of variance unexplained by dumb beta exposures. The Dumb Beta Variance (in red below) is the distribution of ETFs’ variances due to their dumb beta Region and Sector exposures. The Smart Beta Variance (in blue below) is the distribution of ETFs’ variances unrelated to their dumb beta exposures:

Chart of the percentage of variance explained by traditional, non-smart, or dumb beta Region and Sector Factors and the percentage of variance unexplained by these factors for international smart beta equity ETFs

International Equity Smart Beta ETFs: Percentage of variance explained and unexplained by Region and Sector dumb beta exposures

Percentage of international equity smart beta ETFs’ variances due to dumb beta exposures:

 Min. 1st Qu.  Median    Mean 3rd Qu.    Max. 
49.24   90.74   94.52   91.95   97.00   98.83  

Percentage of international equity smart beta ETFs’ variances unrelated to dumb beta exposures:

 Min. 1st Qu.  Median    Mean 3rd Qu.    Max. 
1.174   3.004   5.484   8.052   9.258  50.760 

Note that market timing of dumb beta exposures can generate an active return. This return is still due to traditional dumb factor exposures, but it adds value through smart variation in such exposures. Market timing is a relatively small source of return for most international smart beta ETFs and is beyond the scope of this article.

Our analysis excludes Value/Growth and Size Factors, which are decades old and considered dumb beta by some. If one expands the list of dumb beta factors, smart beta variance shrinks further.

Conclusions

  • Traditional, or dumb, Region and Sector Betas account for over 94% of variance for most international smart beta ETFs.
  • Smart beta, unexplained by the traditional Region and Sector Betas, accounts for under 6% of variance for most international smart beta ETFs.
  • With proper analytics, investors and allocators can guard against elaborate re-packaging of dumb international beta as smart beta and spot the products that actually do provide international smart beta exposures.
  • Investors and allocators can monitor and manage unintended dumb factor exposures of international smart beta portfolios.
The information herein is not represented or warranted to be accurate, correct, complete or timely.
Past performance is no guarantee of future results.
Copyright © 2012-2016, AlphaBetaWorks, a division of Alpha Beta Analytics, LLC. All rights reserved.
Content may not be republished without express written consent.
 

What Fraction of Smart Beta is Dumb Beta?

Our earlier articles discussed how some smart beta strategies turn out to be merely high beta strategies, and how others actively time the market, requiring careful monitoring. We also showed that the returns of popular factor ETFs such as Momentum and Quality are mostly attributable to exposures to traditional Market and Sector Factors. We now quantify the influence of traditional factors, or dumb beta, on all broad U.S. equity smart beta ETFs.

Though many smart beta ETFs do provide valuable exposure to idiosyncratic factors, many others mostly re-shuffle exposures to basic dumb factors. To successfully use smart beta products, investors and allocators must apply rigorous quantitative analysis. With capable analytics, they can guard against elaborate (and often expensive) re-packaging of dumb beta as smart beta, identify smart beta products that time dumb beta factors effectively, and monitor smart beta allocations to control for unintended dumb factor exposures.

Measuring the Influence of Dumb Beta Factors on Smart Beta ETFs

We started with approximately 800 U.S. Smart Beta ETFs. Since our focus was on the broad U.S. equity strategies, we removed non-U.S. portfolios and sector portfolios. (Later articles will cover global equity portfolios.) We also removed portfolios for which returns estimated from historical positions did not reconcile closely to reported performance. We were left with 215 broad U.S. equity smart beta ETFs. This nearly complete sample contains all the popular smart beta strategies.

For each ETF, we estimated monthly positions and then used these positions to calculate portfolio factor exposures for traditional (dumb beta) factors such as Market and Sectors.  These ex-ante factor exposures can be used to predict or explain the following months’ returns.

The correlation between returns predicted by dumb beta factor exposures and actual returns quantifies the influence of dumb beta factors. The higher the correlation, the more similar a smart beta ETF is to a portfolio of traditional, simple, and dumb systematic risk factors.

The Influence of Market Beta on Smart Beta ETFs

Our simplest test used a single systematic risk factor – Market Beta. This is the dumbest traditional factor and also the cheapest to invest in. Since Market Beta is the dominant factor behind portfolio performance, even a very simple 1-factor model built with robust statistical methods delivered 0.92 mean and 0.94 median correlation between predicted and actual monthly returns for smart beta ETFs:

Chart of the correlations between predicted returns constructed using a single-factor statistical equity risk model and actual historical returns for over 200 U.S. smart beta equity ETFs

U.S. Smart Beta Equity ETFs: Correlation between a single-factor statistical equity risk model’s predictions and actual monthly returns

  Min. 1st Qu.  Median    Mean 3rd Qu.    Max. 
0.5622  0.8972  0.9393  0.9174  0.9693  0.9960

Put differently: For most broad U.S. equity smart beta ETFs, U.S. Market Beta accounts for over 88% of monthly return variance.

The Influence of Market and Sector Betas on Smart Beta ETFs

Since traditional sector/industry allocation is a staple of portfolio construction and risk management, we next tested a two-factor model that added a Sector Factor. Each security belongs to one of 10 broad sectors (e.g., Energy, Technology). Market and Sector Betas, estimated with robust methods, delivered 0.95 mean and 0.96 median correlation between predicted and actual monthly returns for smart beta ETFs:

Chart of the correlations between predicted returns constructed using a two-factor statistical equity risk model and actual historical returns for over 200 U.S. smart beta equity ETFs

U.S. Smart Beta Equity ETFs: Correlation between a two-factor statistical equity risk model’s predictions and actual monthly returns

  Min. 1st Qu.  Median    Mean 3rd Qu.    Max. 
0.5643  0.9320  0.9634  0.9452  0.9805  0.9974

Put differently: For most broad U.S. equity smart beta ETFs, U.S. Market and Sector Betas accounts for over 92% of monthly return variance.

Smart Beta Variance and Dumb Beta Variance

Rather than measuring the correlation between returns predicted by dumb beta exposures and actual returns, we can instead measure the fraction of variance unexplained by dumb beta exposures. This (in blue below) is the fraction of smart beta ETFs’ variance that is unrelated to dumb beta:

Chart of the percentage of variance explained by traditional, non-smart, or dumb beta factors Market and Sectors and the percentage of variance unexplained by these factors for over 200 U.S. smart beta equity ETFs

U.S. Smart Beta Equity ETFs: Percentage of Variance Explained and Unexplained by Dumb Beta Factors

Percentage of Variance Explained by Dumb Beta Factors

Min. 1st Qu.  Median    Mean 3rd Qu.    Max. 
1.85   86.87   92.81   89.71   96.14   99.47 

Percentage of Variance Unexplained by Dumb Beta Factors

Min. 1st Qu.  Median    Mean 3rd Qu.    Max. 
 .53    3.86    7.19   10.29   13.13   68.15

Note that some smart beta strategies do provide value by timing the dumb beta factors. This market timing can generate a positive active return, but it still consists of traditional dumb factor exposures and their variation. Market timing by smart beta ETFs is beyond the scope of this article.

The high explanatory power of dumb beta exposures above was achieved with a primitive model using Market and Sector Factors only. If one incorporates Value/Growth and Size factors that are decades old and considered dumb beta by some, smart beta variance shrinks further.

Conclusions

  • Traditional, or dumb, Market and Sector Betas account for over 92% of variance for most U.S. equity smart beta ETFs.
  • Smart beta, unexplained by the traditional Market and Sector Betas, accounts for under 8% of variance for most U.S. equity smart beta ETFs.
  • With proper analytics, investors and allocators can guard against elaborate re-packaging of dumb beta as smart beta.
  • With proper analytics, investors and allocators can monitor smart beta allocations to control for unintended dumb factor exposures.
  • Equity risk models can adequately describe and predict the performance of most smart beta strategies with traditional dumb risk factors such as Market and Sectors.
The information herein is not represented or warranted to be accurate, correct, complete or timely.
Past performance is no guarantee of future results.
Copyright © 2012-2016AlphaBetaWorks, a division of Alpha Beta Analytics, LLC. All rights reserved.
Content may not be republished without express written consent.

Hedge Fund Crowding Update – Q2 2016

Typical analysis of hedge fund crowding focuses on individual stocks. This is misguided since over 85% of hedge funds’ monthly return variance is due to factor (systematic) exposures. Their residual, (idiosyncratic, or stock-specific) bets account for less than 15% of it. Likewise, factor crowding has driven much of the hedge fund industry’s performance and volatility. In Q2 2016, half of U.S. hedge funds’ long equity risk (tracking error) relative to the U.S. Market was due to a single crowded factor and two thirds was due to three crowded factors. This article reviews the most crowded bets at 6/30/2016 that have been driving hedge funds’ long equity performance.

Note that active risk is required to generate active returns and warrant management fees. Yet, not all exposures are created equal. Systematic exposures that are shared by the entire hedge fund industry and that can be obtained cheaply via index funds and ETFs do not warrant the same compensation as the distinctive insights of gifted managers. Even worse, these crowded bets expose investors to the damaging stampede of impatient capital.

Identifying Hedge Fund Crowding

We followed the approach of our earlier studies of hedge fund crowding: We processed regulatory filings of over 1,000 hedge funds and created a position-weighted portfolio (HF Aggregate) comprising all tractable hedge fund long U.S. equity portfolios. We then analyzed HF Aggregate’s risk relative to the U.S. Market. The most crowded bets are driving the hedge fund industry’s risk and performance. We identified these bets using the AlphaBetaWorks (ABW) Statistical Equity Risk Model – an effective system of forecasting future risk and performance.

Hedge Fund Industry’s Risk

HF Aggregate had 3.5% estimated future volatility (tracking error) relative to the U.S. Market in Q2 2016. Nearly 80% of this was due to its factor (systematic) exposures, rather than individual stocks:

Factor (systematic) and residual (idiosyncratic) components of the U.S. Hedge Fund Aggregate’s variance relative to U.S. Market on 6/30/2016

Components of the Relative Risk for U.S. Hedge Fund Aggregate in Q2 2016

Source Volatility (ann. %) Share of Variance (%)
Factor 3.12 77.84
Residual 1.67 22.16
Total 3.54 100.00

A typical analysis of hedge fund crowding that focuses on individual stocks and popular holdings is thus misguided. It dwells on only 20% of the industry’s risk, overlooking the other 80%. Funds with no shared positions can still correlate highly when they have similar factor exposures. Consequently, such a simplistic analysis of position overlap and holdings misrepresents fund risk risk and fosters dangerous complacency.

Hedge Fund Factor (Systematic) Crowding

Below are HF Aggregate’s principal factor exposures (in red) relative to the U.S. Market’s (in gray). These are the primary bets behind factor risk and crowding in the table above:

Chart of the factor exposures contributing most to the factor variance of U.S. Hedge Fund Aggregate Portfolio relative to U.S. Market on 6/30/2016

Significant Absolute and Residual Factor Exposures of U.S. Hedge Fund Aggregate in Q2 2016

Market (Beta) is the dominant long equity bet within the hedge fund industry. It accounts for approximately two thirds of relative factor risk and half of relative total risk:

Chart of the main factors and their cumulative contribution to the factor variance of U.S. Hedge Fund Aggregate Portfolio relative to U.S. Market on 6/30/2016

Factors Contributing Most to Relative Factor Variance of U.S. Hedge Fund Aggregate in Q2 2016

Factor Relative Exposure Factor Volatility Share of Relative Factor Variance Share of Relative Total Variance
Market 17.62 12.58 62.96 49.01
Size -9.39 8.46 10.00 7.78
Health 9.45 6.95 9.19 7.15
Oil Price 1.89 31.29 9.12 7.10
Utilities -3.74 12.42 5.71 4.44
Bond Index -7.90 3.55 5.01 3.90
Consumer -5.40 3.96 2.30 1.79
FX 2.18 7.30 -1.99 -1.55
Energy -2.30 13.44 -1.62 -1.26
Value -1.81 13.33 -0.53 -0.41

(Relative exposures and relative variance contribution. All values are in %. Volatility is annualized.)

The most crowded long equity bet is high systematic exposure to the U.S. Market – not any particular stock. In fact, high systematic market risk is more important to U.S. hedge fund long portfolios than all of their stock-specific bets combined. This makes the popular fascination with fund holdings and position overlap particularly dangerous. As factor crowding continues to dominate stock-specific risk and stock picking skill, the survival of asset managers and allocators increasingly relies on their grasp of systematic crowding and the predictive power of their risk management systems.

Hedge Fund U.S. Market Factor Crowding

The current Market Factor Exposure of HF Aggregate is approximately 115% (its Market Beta is approximately 1.15). This exposure has remained above 100% since 2012:

Chart of the historical exposure of U.S. Hedge Fund Aggregate’s to the U.S. Market Factor

U.S. Hedge Fund Aggregate’s U.S. Market Factor Exposure History

The average hedge fund long equity portfolio now carries approximately 15% more market risk than the Russell 3000 Index and approximately 20% more than the slightly less risky S&P 500 Index. This higher exposure illustrates the danger of evaluating them relative to broad benchmarks. In a year when S&P 500 returns 10%, the average hedge fund would need to return approximately 12% to match what investors would have earned by taking the same risk passively.

Hedge Fund U.S. Size Factor Crowding

The ABW Size Factor is the difference in returns, net of market and sector effects, between the largest and the smallest stocks. It is closely related to the Fama–French SMB Factor, but includes critical fixes: The ABW Size Factor strips out market and sector effects from security returns, revealing pure size risk. By contrast, SMB Factor captures size risk together with market beta and sector effects, since market exposure and sector composition differ between small- and large-cap stocks. This market and sector noise in the SMB Factor makes accurate risk estimation challenging and accurate performance attribution impossible.

Negative Size exposure corresponds to small-cap risk.  Hedge fund long equity portfolios currently have near-record small-cap exposure, equivalent to an approximately 10% bet on small company outperformance:

Chart of the historical exposure of U.S. Hedge Fund Aggregate’s to the U.S. Size Factor

U.S. Hedge Fund Aggregate’s U.S. Size Factor Exposure History

Hedge Fund U.S. Health Factor Crowding

Current hedge fund Heath Factor exposure remains near an all-time high:

Chart of the historical exposure of U.S. Hedge Fund Aggregate’s to the U.S. Health Factor

U.S. Hedge Fund Aggregate’s U.S. Size Health Factor Exposure History

Hedge Fund Residual (Idiosyncratic) Crowding

As of 6/30/2016, a quarter of hedge fund crowding was due to residual (idiosyncratic, stock-specific) risk. As factor crowding increased, residual crowding has diminished. Thus, stock-specific risk and stock-picking still have faded in importance:

Chart of the main stock-specific bets and their cumulative contribution to the residual variance of U.S. Hedge Fund Aggregate Portfolio relative to U.S. Market on 6/30/2016

Stocks Contributing Most to Relative Residual Variance of U.S. Hedge Fund Aggregate in Q2 2016

Symbol Name Relative Exposure Residual Volatility Share of Relative Residual Variance Share of Relative Total Variance
LNG Cheniere Energy 1.65 34.66 11.77 2.61
AGN Allergan plc 2.79 14.71 6.06 1.34
CHTR Charter Communications 1.84 20.58 5.16 1.14
PCLN Priceline Group 1.61 22.25 4.64 1.03
FLT FleetCor Technologies 1.74 19.87 4.29 0.95
VRX Valeant Pharmaceuticals 0.82 39.76 3.85 0.85
FB Facebook, Inc. Class A 0.89 31.39 2.84 0.63
HCA HCA Holdings 1.21 22.78 2.76 0.61
AAPL Apple Inc. -1.68 16.41 2.74 0.61
PYPL PayPal Holdings Inc 1.66 15.88 2.49 0.55

(Relative exposures and relative variance contribution. All values are in %. Volatility is annualized.)

The most crowded stocks continue to be sensitive to asset flows in and out of the industry. Yet, in the current environment of extreme systematic hedge fund crowding, allocators and fund followers should continue to pay more attention to factor risk. Indeed, allocators invested in a seemingly diversified portfolio of hedge funds may, in fact, be paying high active fees for a passive factor portfolio.

Summary

  • At Q2 2016, nearly 80% of hedge funds’ relative long equity risk was due to factor, or systematic, exposures.
  • The main source of Q2 2016 hedge fund crowding, responsible for half of long equity tracking error, was record U.S. Market exposure.
  • Short Size Factor (small-cap bias) and long Health Factor exposures were the next most crowded bets, both near their historic extremes.
  • Given high current hedge fund factor crowding, an analysis of aggregate and individual hedge funds must focus on systematic exposures and risk shared across positions, and not solely on individual positions.
  • Fund investors, followers, and allocators must monitor whether they are investing in exceptional insights or generic factor exposures otherwise available via cheap passive instruments.
The information herein is not represented or warranted to be accurate, correct, complete or timely.
Past performance is no guarantee of future results.
Copyright © 2012-2016, AlphaBetaWorks, a division of Alpha Beta Analytics, LLC. All rights reserved.
Content may not be republished without express written consent.

Hedge Fund Finance Sector Crowding

Asset outflows and portfolio liquidations have devastated crowded hedge fund bets since 2015. Losses have been especially severe in the Finance Sector. We survey hedge fund finance sector crowding and identify the stocks driving it. Investors and allocators must be vigilant: when capital flows out, these bets tend to suffer sharp losses. When capital flows in, they tend to benefit. We also provide an early indicator of this underperformance and outperformance.

Identifying Hedge Fund Finance Crowding

We created an aggregate position-weighted portfolio (Hedge Fund Finance Aggregate, or HF Finance Aggregate) consisting of finance sector equities held by all hedge fund long equity portfolios that are tractable from regulatory filings. The size of each position is the dollar value of its ownership by hedge funds. This process is similar to our earlier analyses of hedge fund crowding. We then evaluated HF Finance Aggregate’s risk relative to the capitalization-weighted portfolio of U.S. finance equities (Market Finance Aggregate) using an AlphaBetaWorks’ Statistical Equity Risk Model. Finally, we analyzed HF Finance Aggregate’s idiosyncratic bets and identified the most crowded ones.

Hedge Fund Finance Sector Performance

Over the past 10 years HF Finance Aggregate generated approximately the same return as a portfolio of index funds and ETFs with the same systematic (market) risk (Factor Portfolio):

Historical cumulative factor, security selection, and total returns of the Hedge Fund Finance Sector Aggregate through Q2 2016

Historical Factor and Total Return of the Hedge Fund Finance Sector Aggregate

Blue area represents positive and gray area represents negative risk-adjusted returns from security selection, net of factor effects. HF Finance Aggregate outperformed the Factor Portfolio between 2006 and 2013 and has underperformed since. A look at the security selection performance below illustrates the underlying cycles of performance.

Hedge Fund Finance Sector Security Selection

AlphaBetaWorks’ metric of security selection is αReturn – the performance a portfolio would have generated if markets had been flat. It is also the performance of a portfolio with its factor exposures hedged:

Historical cumulative security selection return of the Hedge Fund Finance Sector Aggregate through Q2 2016

Historical Return from Security Selection of Hedge Fund Finance Sector Aggregate

Hedge funds have enjoyed positive αReturn in the finance sector during calm market regimes. Throughout our test period, the only episode of security selection losses prior to 2014 was Q3 2008. It was followed by a sharp reversal starting in late-2008. The 2008-2010 security selection gains of HF Finance Aggregate illustrate how forced liquidation of 2008 ended with a mean-reversion: the biggest losers became attractive opportunities.

The cycles of asset inflows and liquidations are common to HF Sector Aggregates. Illustrations can be found in our previous pieces on hedge fund semiconductor crowding and hedge fund exploration and production crowding.

HF Finance Aggregate has been showing signs of liquidation since mid-2014. This was also the time when the overall HF Aggregate began to generate negative αReturns that eventually turned into a rout. Since 2014, hedge funds’ long finance picks underperformed by 15% on a risk-adjusted basis. Had the industry taken the same risks passively with ETFs, its long financials portfolio would have generated approximately 15% higher return.

Hedge Fund Residual (Idiosyncratic) Finance Sector Crowding

Hedge fund sector portfolios have a history of booms and busts. Their sharply negative αReturns usually signal liquidations. Consequently, identifying and avoiding crowded bets is vital during these periods. When a cycle eventually turns, the biggest losers can present attractive opportunities. The following stocks were recent top contributors to idiosyncratic (stock-specific) risk of HF Finance Aggregate – its most crowded stocks. Blue bars represent long (overweight) exposures relative to Market Finance Aggregate. White bars represent short (underweight) exposures. Bar height represents contribution to relative stock-specific risk:

Chart of the residual Hedge Fund Finance Sector Crowding: the main stock-specific bets and their cumulative contribution to the residual variance of Hedge Fund Finance Sector Aggregate Portfolio relative to Market on 6/30/2016

Stocks Contributing Most to U.S. Hedge Fund Finance Aggregate Relative Residual Risk in Q2 2014

The following table contains detailed data on the residual hedge fund finance sector crowding:

Exposure (%) Net Exposure Share of Risk (%)
HF Sector Aggr. Sector Aggr. % $mil Days of Trading
AIG American International Group, Inc. 7.98 1.49 6.49 3,651.8 6.6 13.33
HTZ Hertz Global Holdings, Inc. 2.51 0.11 2.40 1,350.1 10.3 13.32
EQIX Equinix, Inc. 4.20 0.56 3.64 2,048.5 10.0 10.95
JPM JPMorgan Chase \& Co. 0.80 5.31 -4.51 -2,536.9 -1.9 5.85
AER AerCap Holdings NV 2.24 0.19 2.05 1,154.8 8.4 5.71
CAR Avis Budget Group, Inc. 1.39 0.06 1.33 746.5 8.2 5.34
BAC Bank of America Corporation 0.66 3.40 -2.74 -1,543.8 -0.9 5.11
LPLA LPL Financial Holdings Inc. 1.62 0.05 1.56 879.1 38.4 3.60
CACC Credit Acceptance Corporation 1.32 0.09 1.23 693.5 22.3 2.84
CBG CBRE Group, Inc. Class A 1.76 0.24 1.52 856.0 8.9 2.00
WLTW Willis Towers Watson Public Limited Comp 2.46 0.40 2.06 1,161.3 8.0 1.73
IBKR Interactive Brokers Group, Inc. Class A 1.27 0.06 1.21 680.8 20.9 1.65
BK Bank of New York Mellon Corporation 3.60 0.97 2.63 1,481.9 5.1 1.58
MA MasterCard Incorporated Class A 4.29 2.51 1.78 1,002.7 0.9 1.56
ALLY Ally Financial Inc 1.84 0.22 1.62 911.9 4.1 1.41
WFC Wells Fargo & Company 2.43 5.97 -3.54 -1,994.8 -1.9 1.33
GLPI Gaming and Leisure Properties, Inc. 1.28 0.09 1.19 672.0 9.1 1.33
NSAM NorthStar Asset Management Corp 0.95 0.05 0.90 506.3 19.3 1.29
FNMA Federal National Mortgage Association 0.29 0.04 0.25 139.5 42.7 1.10
SPG Simon Property Group, Inc. 0.01 1.60 -1.59 -894.9 -2.0 0.89
Other Positions 0.64 18.06
Total 100.00

Long (overweight) exposures to AIG, HTZ, EQIX, and AER as well as short (underweight) exposure to JPM account for half of the stock-specific risk and volatility of hedge funds’ long financials books. The stock-specific losses of the crowded financials bets in 2015-2016 have been more severe than those in the 2008 crisis. Given this severity, when the cycle turns positive the crowded books are likely to outperform.

Analytics built on a robust risk model, such as the AlphaBetaWorks Statistical Equity Risk Model used here, offer leading indicators of portfolio liquidations and losses to crowding. These analytics provided portfolio managers and investors with warning signs as early as 2014, helping avoid losses, or even profit from herding. Since liquidations and crowding losses are routine, it is also vital that allocators identify undifferentiated managers.

Conclusions

  • Analysis of hedge fund crowding using robust risk models provides early signs of portfolio liquidations and opportunities.
  • Half of hedge fund residual (idiosyncratic, stock-specific) finance sector crowding comes from only five stocks.
  • Investors with robust data on hedge fund crowding and cycles of capital flow can reduce losses and profit from opportunities.
  • Allocators with robust data on hedge fund crowding can monitor manager differentiation and reduce losses.
The information herein is not represented or warranted to be accurate, correct, complete or timely.
Past performance is no guarantee of future results.
Copyright © 2012-2016, AlphaBetaWorks, a division of Alpha Beta Analytics, LLC. All rights reserved.
Content may not be republished without express written consent.

Hedge Fund Crowding Update – Q1 2016

Analyses of hedge fund crowding typically focus on hedge funds’ individual positions (their residual, idiosyncratic, or stock-specific exposures). Yet, over 85% of the monthly return variance for the majority of hedge fund long equity portfolios is due to their factor (systematic) exposures. Stock-specific bets account for less than 15%. Factor – rather than residual – crowding has driven much of the industry’s past exuberance and its recent grief. In Q1 2016, nearly half of U.S. hedge funds’ relative long equity risk (tracking error) was due to a single factor, U.S. Market Exposure. This piece surveys the crowded factor and residual exposures at 3/31/2016 that are likely to drive long equity performance for hedge funds in coming quarters.

Identifying Hedge Fund Crowding

This piece follows the approach of our earlier articles on crowding: We processed regulatory filings of over 1,000 hedge funds and created a position-weighted portfolio (HF Aggregate) consisting of all tractable hedge fund long U.S. equity portfolios. We then analyzed HF Aggregate’s risk relative to the U.S. Market using the AlphaBetaWorks Statistical Equity Risk Model – a proven system for performance forecasting. The most crowded hedge fund bets are factors and, to a lesser extent, stocks that drive HF Aggregate’s relative risk and performance. Ironically, these are rarely the largest or the most common hedge fund positions.

Hedge Fund Aggregate’s Risk

The Q1 2016 HF Aggregate had 3.4% estimated future tracking error relative to the U.S. Market. Factor (systematic) exposures accounted for over two thirds of it:

Factor (systematic) and residual (idiosyncratic) components of U.S. hedge fund crowding and U.S. Hedge Fund Aggregate’s variance relative to U.S. Market on 3/31/2016

Components of the Relative Risk for U.S. Hedge Fund Aggregate in Q1 2016

Source Volatility (ann. %) Share of Variance (%)
Factor 2.78 68.23
Residual 1.89 31.77
Total 3.36 100.00

A simplistic analysis of hedge fund crowding that focuses on individual positions will overlook systematic exposures. Yet, they are responsible for over two thirds of the hedge fund industry’s risk. Since funds with no shared positions but similar factor exposures will correlate highly, a simplistic crowding analysis that lacks a predictive risk model will misidentify such similar funds as differentiated. This will misrepresent their risk and can foster dangerous complacency.

Hedge Fund Factor (Systematic) Crowding

Below are the principal factor exposures (in red) relative to U.S. Market’s exposures (in gray) that are responsible for the factor crowding in the above table:

Chart of the factor exposures contributing most to the U.S. hedge fund crowding and factor variance of U.S. Hedge Fund Aggregate Portfolio relative to U.S. Market on 3/31/2016

Significant Absolute and Relative Factor Exposures of U.S. Hedge Fund Aggregate in Q1 2016

Of these exposures, Market (Beta) alone accounts for approximately two thirds of the relative and half of the total factor risk:

Chart of the main factors and their cumulative contribution to the factor variance of U.S. Hedge Fund Aggregate Portfolio relative to U.S. Market on 3/31/2016

Factors Contributing Most to Relative Factor Variance of U.S. Hedge Fund Aggregate in Q1 2016

Factor Relative Exposure Factor Volatility Share of Relative Factor Variance Share of Relative Total Variance
Market 15.46 12.67 64.54 44.04
Bond Index -21.46 3.32 18.23 12.44
Utilities -3.56 11.75 6.76 4.61
Consumer -9.07 3.97 4.74 3.23
Size -3.59 8.39 3.30 2.25
Health 3.44 7.29 2.48 1.69
Energy -2.50 13.17 -2.42 -1.65
Communications -1.17 12.02 1.82 1.24
Oil Price 0.18 30.91 0.99 0.68
Value -1.00 13.21 -0.74 -0.51

(Relative exposures and relative variance contribution. All values are in %. Volatility is annualized.)

The U.S. hedge fund industry’s most crowded bet is not a stock, or stocks, it is high systematic exposure to the U.S. Market. This makes the popular fascination with fund holdings and position overlap particularly dangerous. This factor crowding explains much of recent hedge fund misery. As large asset bases continue to diminish the importance of stock-specific risk, the survival of asset managers and allocators will increasingly rely on their analysis of systematic crowding with robust and predictive factor models.

Hedge Fund U.S. Market Factor Crowding

After working to refine our historical hedge fund portfolio database with particular attention to defunct firms and survivorship bias, we have an increasingly accurate picture of HF Aggregate’s historical factor exposures. Its current Market Factor Exposure is approximately 115% (i.e. the HF Aggregate’s Market Beta is approximately 1.15). The average hedge fund long equity portfolio now carries approximately 15% more Market Exposure than the Russell 3000 ETF and approximately 20% more Market Exposure than the S&P 500 ETF:

Chart of the historical exposure of U.S. Hedge Fund Aggregate’s to the U.S. Market Factor

U.S. Hedge Fund Aggregate’s U.S. Market Factor Exposure History

This Market crowding has been costly and disruptive during the recent volatility. It also partially explains the failures of simple performance and skill metrics: When portfolios carry different Market Exposure than S&P500, calculating security selection return as performance relative to S&P500 is perilous. High Market Exposure is a general risk to the industry and a source of turmoil. Since there is no relationship between Market Exposure of HF Aggregate and subsequent Market Factor return, Market Factor crowding is not a predictive indicator of future performance:

Chart of the correlation between the exposure of U.S. Hedge Fund Aggregate’s to the U.S. Market Factor and U.S. Market Factor’s return

U.S. Hedge Fund Aggregate’s U.S. Market Factor Exposure History and Factor Return

Hedge Fund Bond Factor (Interest Rate) Crowding

We showed in an earlier piece that Bond (Interest Rate) Factor exposure is one of the top drivers of hedge fund long equity risk and performance. This bond risk is a natural consequence of hedge funds’ fondness for “cheap call options.” These are often levered companies with significant bond exposure: the companies’ creditors are long bonds; the companies (and their equity owners) are economically short them.

This short Bond Factor (long Interest Rate) exposure is now near record levels and is the second most important source of HF Aggregate’s Factor Crowding:

Chart of the historical exposure of U.S. Hedge Fund Aggregate’s to the U.S. Bond Factor

U.S. Hedge Fund Aggregate’s U.S. Bond Factor Exposure History

As with Market Factor, Bond Factor Exposure is a general risk to the industry. There is no relationship between Bond Exposure of HF Aggregate and subsequent Bond Factor return:

Chart of the correlation between the exposure of U.S. Hedge Fund Aggregate’s to the U.S. Bond Factor and U.S. Bond Factor’s return

U.S. Hedge Fund Aggregate’s U.S. Bond Factor Exposure History and Factor Return

Hedge Fund Residual (Idiosyncratic) Crowding

As of 3/31/2016, a  third of hedge fund crowding was due to residual (idiosyncratic, stock-specific) risk. Netflix (NFLX) is responsible for a quarter of it. The five most crowded stocks collectively account for half:

Chart of the main stock-specific bets and their cumulative contribution to the residual variance of U.S. Hedge Fund Aggregate Portfolio relative to U.S. Market on 3/31/2016

Stocks Contributing Most to Relative Residual Variance of U.S. Hedge Fund Aggregate in Q1 2016

These may be perfectly sound fundamental investments. However, they are sensitive to asset flows in and out of the industry. Given the sharp losses to residual hedge fund crowding in 2015-2016 and the tendency of liquidations to revert, crowding risk in these has diminished and the liquidation may even present long investment opportunities:

Symbol Name Relative Exposure Residual Volatility Share of Relative Residual Variance Share of Relative Total Variance
NFLX Netflix, Inc. 1.77 54.97 26.47 8.41
LNG Cheniere Energy, Inc. 1.60 32.94 7.73 2.46
CHTR Charter Communications 2.38 19.79 6.17 1.96
TWC Time Warner Cable Inc. 2.74 15.80 5.22 1.66
JD JD.com, Inc. Sponsored ADR 1.34 29.35 4.31 1.37
AGN Allergan plc 2.06 17.07 3.43 1.09
VRX Valeant Pharmaceuticals International 0.67 43.49 2.37 0.75
PCLN Priceline Group Inc 1.28 22.17 2.24 0.71
FLT FleetCor Technologies, Inc. 1.41 19.72 2.16 0.69
UAL United Continental Holdings, Inc. 0.92 28.15 1.86 0.59

(Relative exposures and relative variance contribution. All values are in %. Volatility is annualized.)

Though these stock-specific bets are important, they account for less than a third of the entire hedge fund crowding picture. Consequently, in the current environment of extreme systematic hedge fund crowding, allocators and fund followers should continue to pay more attention to factor risk. As hedge funds’ residual volatility continues to wane, allocators owning a broadly diversified portfolio of hedge funds are increasingly at risk of paying high active fees for a passive factor portfolio.

Summary

  • The main source of Q1 2016 hedge fund crowding, responsible for nearly half of relative long equity risk, was record U.S. Market exposure.
  • The second most important source of Q1 2016 hedge fund crowding was near-record short Bond (long interest rate) exposure.
  • Given high factor (systematic) hedge fund long equity crowding, analysis of crowding risks must focus on factor exposures, rather than individual positions.
The information herein is not represented or warranted to be accurate, correct, complete or timely. Past performance is no guarantee of future results. Copyright © 2012-2016, AlphaBetaWorks, a division of Alpha Beta Analytics, LLC. All rights reserved. Content may not be republished without express written consent.

Performance Persistence within International Style Boxes

We earlier discussed how nominal returns and related investment performance metrics revert: Since portfolio performance primarily comes from systematic (factor) exposures, such simplistic metrics merely promote the high-risk portfolios during the bullish regimes and the low-risk portfolios during the bearish regimes. As regimes change, the leaders flip. We also showed that, when security selection returns are distilled with a robust factor model, performance persists within all U.S. equity Style Boxes. Prompted by reader interest, we now investigate performance persistence within International Style Boxes.

Measuring the Persistence of International Portfolio Returns

As in our earlier work on return persistence, we examine all Form 13F filings for the past 10 years. This survivorship-free portfolio database covers all institutions that exercised investment discretion over at least $100 million and yields approximately 3,600 international portfolios with sufficiently long histories, low turnover, and broad positions to be suitable for the study.

We split the 10 years of history into two random 5-year samples and compared performance metrics of each portfolio over these two periods. The correlation between metrics over the sample periods measures the metrics’ persistence.

International Portfolios’ Performance Persistence

The Reversion of International Portfolios’ Nominal Returns

The following chart plots the rankings of each portfolio’s nominal returns during the two sample periods. The x-axis plots return percentile, or ranking, in the first sample period. The y-axis plots return percentile, or ranking, in the second sample period. The best-performing international portfolios of the first period have x-values near 100; the best-performing portfolios of the second period have y-values near 100:

Chart of the random relationship between nominal returns for two historical samples for all international equity 13F portfolios

13F Portfolios, International Positions: Correlation between the rankings of nominal returns for two historical samples

Whereas past performance of U.S. equity portfolios was a (negative) predictor of future results, there is no significant correlation between the two for international portfolios – best- and worst-performers tend to become average.

The Persistence of International Portfolios’ Security Selection Returns

Due to the domineering effects of Market and other systematic factors, top-performing managers during the bullish regimes are those that take the most risk, and top-performing managers during the bearish regimes are those that take the least risk. Since Market returns are approximately random, nominal returns do not persist. To eliminate this noise, the AlphaBetaWorks Performance Analytics Platform calculates each portfolio’s return from security selection net of factor effects. αReturn is the return a manager would have generated if all factor returns had been flat.

International portfolios with above-average αReturns in one period are likely to maintain them in the other. In the following chart, this relationship is represented by the concentration of portfolios in the bottom left (laggards that remained laggards) and top right (leaders that remained leaders):

Chart of the positive correlation between risk-adjusted returns from security selection (αReturns) for two historical samples for all international equity 13F portfolios

13F Portfolios, International Positions: Correlation between the rankings of αReturns for two historical samples

This test of persistence across two arbitrary 5-year samples is strict. Persistence of security selection skill is even higher over shorter periods.

Performance Persistence within International Style Boxes

Measures of investment style such as Size (portfolio market capitalization) and Value/Growth (portfolio valuation) are common approaches to grouping portfolios. Readers frequently ask whether the reversion of nominal returns and related metrics can be explained by Style Box membership. Perhaps we merely observed reversion in leadership that is eliminated by controlling for Style?

To test this, we compared performance persistence within each of the four popular Style Boxes.

International Large-Cap Value Portfolios’ Performance Persistence

The International Large-cap Value Style Box shows the highest persistence of long-term stock picking results, yet the relationship between nominal returns within it is still nearly random. Powerful performance analytics provide the biggest edge for this International Style Box:

Chart of the random relationship between nominal returns and positive correlation between risk-adjusted returns from security selection (αReturns) for two historical samples for equity 13F portfolios in the Large-Cap Value International Style Box

Large-Cap Value 13F Portfolios, International Positions: Correlation between the rankings of nominal returns αReturns for two historical samples

International equity portfolios differ from U.S. equity portfolios, where security selection persistence was highest for the Small-cap Value Style Box.

International Large-Cap Growth Portfolios’ Performance Persistence

International portfolios in the Large-cap Growth Style Box also show a nearly random relationship between the two periods’ returns. However, their αReturns persist strongly. Whereas large-cap growth stock picking is treacherous for U.S. equity portfolios, it is more rewarding internationally:

Chart of the random relationship between nominal returns and positive correlation between risk-adjusted returns from security selection (αReturns) for two historical samples for equity 13F portfolios in the Large-Cap Growth International Style Box

Large-Cap Growth 13F Portfolios, International Positions: Correlation between the rankings of nominal returns αReturns for two historical samples

International Small-Cap Value Portfolios’ Performance Persistence

International portfolios in the Small-cap Value Style Box have the least persistent αReturns, in contrast to the U.S. portfolios:

Chart of the random relationship between nominal returns and positive correlation between risk-adjusted returns from security selection (αReturns) for two historical samples for equity 13F portfolios in the Small-Cap Value International Style Box

Small-Cap Value 13F Portfolios, International Positions: Correlation between the rankings of nominal returns αReturns for two historical samples

International Small-Cap Growth Portfolios’ Performance Persistence

αReturns within the International Small-cap Growth Style Box persist almost as strongly as within the International Large-cap Style Boxes:

Chart of the random relationship between nominal returns and positive correlation between risk-adjusted returns from security selection (αReturns) for two historical samples for equity 13F portfolios in the Small-Cap Growth International Style Box

Small-Cap Growth 13F Portfolios, International Positions: Correlation between the rankings of nominal returns αReturns for two historical samples

Summary

  • Whereas nominal returns and related simplistic metrics of investment skill revert, security selection performance – once properly distilled with a capable factor model – persists.
  • The randomness and reversion of nominal returns and the persistence of security selection skill hold across all International Style Boxes.
  • Security selection performance persists most strongly for International Large-cap portfolios.
The information herein is not represented or warranted to be accurate, correct, complete or timely.
Past performance is no guarantee of future results.
Copyright © 2012-2016, AlphaBetaWorks, a division of Alpha Beta Analytics, LLC. All rights reserved.
Content may not be republished without express written consent.

The Top U.S. Stock Pickers’ Industrials Performance

And Their Consensus Industrials Ideas in 2016

The challenges of identifying good investors and distilling their skill obscure the top stock pickers’ consistently strong performance. For instance, contrary to popular wisdom 2015 was a good year for stock picking. These results also generally apply to large market sub-segments such as the Industrials sector. In this piece we use a robust risk model to identify the best U.S. stock pickers, distill their skills, and monitor their Industrials performance. We then track their consensus Industrials portfolio and reveal its top positions.

Identifying the Top U.S. Stock Pickers

Nominal returns and related simplistic metrics of investment skill are dominated by systematic factors and hence revert. Therefore, we must eliminate these systematic effects to get an accurate picture. The AlphaBetaWorks Performance Analytics Platform calculates each portfolio’s return from security selection, or αReturn. It is the residual performance net of factor effects and the performance a portfolio would have generated if all factor returns had been flat.

This study covers portfolios of all institutions that have filed Form 13F. Of these, approximately 5,000 filers had holdings histories suitable for skill evaluation. The AlphaBetaWorks Expert Aggregate (ABW Expert Aggregate) consists of the top five percent with the most consistently positive 36-month αReturns. This expert panel typically includes 100-150 firms. Manager fame and firm size are poor proxies for skill, so the panel is an eclectic collection light on celebrities but heavy on skill.

Industrials Performance of the Top U.S. Stock Pickers’

Since security selection skill persists, managers with above-average αReturns in the past are likely to maintain them in the future. This applies both to aggregate portfolios and to large portfolio subsets, such as sector holdings. To illustrate, we consider the top stock pickers’ Industrials performance.

A hedged portfolio that combines the top U.S. stock pickers’ net consensus Industrials longs (relative Industrials overweights), lagged 2 months to account for filing delay (the ABW Industrials Expert Aggregate), delivers consistent positive returns:

Chart of the cumulative return of the Industrials Benchmark (Vanguard Industrials ETF (VIS)) and the cumulative Industrials performance of the hedged portfolio that combines the to 5% U.S. long stock pickers’ net consensus industrials positions

Cumulative Hedged Portfolio Return: Top U.S. Stock Pickers’ Net Consensus Industrials Longs

For illustration, we include the performance of the Vanguard Industrials ETF (VIS) (Benchmark above).

2005 2006 2007 2008 2009 2010 2011 2012 2013 2014 2015 2016
ABW Industrials Expert Aggregate 4.13 -2.25 25.24 14.37 7.67 9.47 3.93 6.11 2.06 12.94 2.48 5.84
Vanguard Industrials ETF (VIS) 4.88 15.35 14.14 -39.37 23.15 27.74 -2.48 17.71 42.08 9.00 -3.73 -2.82

The top stock pickers’ consistently positive Industrials αReturns yield consistently positive returns, low volatility, and low drawdowns for the ABW Industrials Expert Aggregate:

ABW Industrials Expert Aggregate Vanguard Industrials ETF (VIS)
Annualized Return 8.56 7.75
Annualized Standard Deviation 7.38 19.24
Annualized Sharpe Ratio (Rf=0%) 1.16 0.40
ABW Industrials Expert Aggregate Vanguard Industrials ETF (VIS)
Semi Deviation 1.50 4.20
Gain Deviation 1.50 3.35
Loss Deviation 1.42 4.46
Downside Deviation (MAR=10%) 1.57 4.22
Downside Deviation (Rf=0%) 1.17 3.84
Downside Deviation (0%) 1.17 3.84
Maximum Drawdown 6.95 57.33
Historical VaR (95%) -2.52 -8.66
Historical ES (95%) -4.09 -13.08

Unfortunately, some highly skilled managers with strong Industrials books have fallen far short of the above results. Poor risk systems and losses from overlooked factor exposures often conceal stock-picking skill. The consistent absolute returns above are due in part to robust hedging that mitigates systematic noise.

Top U.S. Stock Pickers’ Consensus Industrials Positions

The top stock pickers are rarely the hottest funds and their consensus longs are rarely the hottest stocks. Below are the top 10 holdings of the ABW Industrials Expert Aggregate at year-end 2015:

Symbol Name Exposure (%)
MMM 3M Company 17.37
GE General Electric Company 5.47
ROP Roper Technologies, Inc. 3.64
UNP Union Pacific Corporation 3.61
DHR Danaher Corporation 3.26
UTX United Technologies Corporation 2.84
AGX Argan, Inc. 2.77
LMT Lockheed Martin Corporation 2.56
EMR Emerson Electric Co. 2.47
LUV Southwest Airlines Co. 2.37

It is worth noting that the above positions represent a consensus among stock-pickers who have proven their skill. This is not to be confused with crowding, which we have written about at length. Hedge fund crowding is a consensus among (often impatient and performance-sensitive) hedge funds, irrespective of their skill.

Top Stock Pickers’ Exposure to 3M (MMM)

The largest position within the ABW Industrials Expert Aggregate is 3M (MMM). The top panel on the following chart shows MMM’s cumulative nominal returns in black and cumulative residual returns (αReturns) in blue. Residual return or αReturn is the performance net of the systematic factors defined by the AlphaBetaWorks Statistical Equity Risk Model – the performance MMM would have generated if factor returns had been flat. The bottom panel shows exposure to MMM within the Aggregate:

Chart of the cumulative αReturn (residual return) of MMM and exposure to MMM within the hedged portfolio that combines the to 5% U.S. long stock pickers’ net consensus industrials positions

Cumulative αReturns of MMM and ABW Industrials Expert Aggregate’s MMM Exposure

Top Stock Pickers’ Exposure to General Electric (GE)

The second largest position within the ABW Industrials Expert Aggregate is General Electric (GE). The Expert Aggregate was mostly underweight (short) GE between 2008 and 2014 – a challenging period for GE. GE became experts’ consensus long in 2014 – about a year ahead of the 2015 turnaround in residual performance:

Chart of the cumulative αReturn (residual return) of GE and exposure to GE within the hedged portfolio that combines the to 5% U.S. long stock pickers’ net consensus industrials positions

Cumulative αReturns of GE and ABW Industrials Expert Aggregate’s GE Exposure

Top Stock Pickers’ Exposure to Roper Technologies (ROP)

The third largest position within the ABW Industrials Expert Aggregate is Roper Technologies (ROP). The Aggregate has had varied but mostly positive exposure to ROP over the past 10 years. Current exposure is at historic heights:

Chart of the cumulative αReturn (residual return) of ROP and exposure to ROP within the hedged portfolio that combines the to 5% U.S. long stock pickers’ net consensus industrials positions

Cumulative αReturns of ROP and ABW Industrials Expert Aggregate’s ROP Exposure

Conclusions

  • Robust analytics built on predictive risk models identify the top stock pickers in the sea of mediocrity.
  • When hedged, top stock pickers’ net consensus Industrials longs (relative overweights) tend to generate positive future absolute returns and net consensus industrials shorts (relative underweights) tend to generate negative future absolute returns.
  • The top stock pickers are often unglamorous firms and their consensus Industrials longs are often unglamorous stocks – both tend to outperform.
The information herein is not represented or warranted to be accurate, correct, complete or timely.
Past performance is no guarantee of future results.
Copyright © 2012-2016, AlphaBetaWorks, a division of Alpha Beta Analytics, LLC. All rights reserved.
Content may not be republished without express written consent.
U.S. Patents Pending.

How Did the Top U.S. Stock Pickers Do in 2015?

And What Did They Own at Year-end?

Contrary to popular wisdom, 2015 was a good year for stock picking. The problem is that few know who the good stock pickers are. Further, good stock pickers may be poor risk managers. In this article we use a robust risk model to track the top U.S. stock pickers and to distill their skill.

Since genuine investment skill persists, top U.S. stock pickers tend to generate persistently positive returns from security selection. Consequently, a hedged (market-neutral) portfolio of their net consensus longs (relative overweights) tends to generate positive returns, independent of the Market. Below we illustrate this portfolio’s performance and reveal its top positions.

Identifying the Top U.S. Stock Pickers

This study covers portfolios of all institutions that have filed Form 13F. This is the broadest and most representative survivorship-free portfolio database comprising thousands of firms: hedge funds, mutual fund companies, investment advisors, and all other institutions with over $100 million in U.S. long assets. Approximately 5,000 firms had sufficiently long histories, low turnover, and broad portfolios suitable for skill evaluation.

Nominal returns and related simplistic metrics of investment skill (Sharpe Ratio, Win/Loss Ratio, etc.) are dominated by Market and other systematic factors and hence revert. As market regimes change, top performers tend to become bottom performers. To eliminate these systematic effects and estimate residual performance due to stock picking skill, the AlphaBetaWorks Performance Analytics Platform calculates each portfolio’s return from security selection – αReturn. αReturn is the performance a portfolio would have generated if all factor returns had been flat.

Each month we identify the five percent of 13F-filers with the most consistently positive αReturns over the prior 36 months. This expert panel of the top stock pickers typically includes 100-150 firms. Since manager fame and firm size are poor proxies for skill, the panel is an eclectic bunch. It currently includes some hedge funds (Lumina Fund Management, Palo Alto Investors, and Chilton Investment Company), though few of the famed gurus. Many of the top long stock pickers are investment management firms (Eaton Vance Management, Fiduciary Management Inc., and Aristotle Capital Management), as well as banks, endowments, and trust companies.

Performance of the Top U.S. Stock Pickers

Since security selection skill persists, managers with above-average αReturns in the past are likely to maintain them in the future. Therefore, a hedged portfolio that combines the top U.S. stock pickers’ net consensus longs (relative overweights), lagged 2 months to account for filing delay (the ABW Expert Aggregate), delivers consistent positive returns as illustrated below:

Chart of the cumulative return of the Market (Russell 3000) and the cumulative return of the hedged portfolio that combines the to 5% U.S. long stock pickers net consensus exposures

Cumulative Hedged Portfolio Return: Top U.S. Stock Pickers’ Net Consensus Longs

  2005 2006 2007 2008 2009 2010 2011 2012 2013 2014 2015 2016
ABW Expert Aggregate 4.56 14.43 12.74 5.95 -1.25 15.35 2.20 2.24 15.47 8.81 13.16 1.70
iShares Russell 3000 ETF 9.04 15.65 4.57 -37.16 28.21 16.81 0.78 16.43 32.97 12.41 0.34 -5.72

ABW Expert Aggregate achieved higher returns than those of the broad market with less than half of its volatility:

ABW Expert Aggregate iShares Russell 3000 ETF
Annualized Return 8.36 6.40
Annualized Standard Deviation 5.25 15.50
Annualized Sharpe Ratio (Rf=0%) 1.59 0.41

The consistency of top stock pickers’ αReturns manifests itself as low downside volatility and low losses of the ABW Expert Aggregate:

ABW Expert Aggregate iShares Russell 3000 ETF
Semi Deviation 1.00 3.33
Gain Deviation 1.19 2.40
Loss Deviation 0.70 3.45
Downside Deviation (MAR=10%) 1.09 3.43
Downside Deviation (Rf=0%) 0.64 3.04
Downside Deviation (0%) 0.64 3.04
Maximum Drawdown 5.06 51.24
Historical VaR (95%) -1.81 -7.58
Historical ES (95%) -2.21 -9.96

One often reads commentary on the challenges stock pickers faced in 2015. This analysis typically fails to identify skill and merely reveals the obvious: average managers do poorly in a low-return environment. In fact, 2015 was one of the strongest years for top stock pickers. It is the indiscriminate rallies such as that of 2009 that prove challenging.

Unfortunately, some skilled managers suffered from underdeveloped risk systems, and losses from hidden systematic risks concealed their stock-picking results. For instance, some highly skilled stock pickers with unintended small-cap (short Size) exposure experienced 5-10% systematic headwinds in 2015. A robust risk management program would have partially or wholly mitigated these.

Top U.S. Stock Pickers’ Consensus Positions

Since the top stock pickers are rarely the most celebrated firms, their top consensus longs are rarely the hottest stocks. Below are the top 10 holdings of the ABW Expert Aggregate at year-end 2015:

Symbol Name Exposure (%)
EA Electronic Arts Inc. 2.29
V Visa Inc. Class A 1.26
XOM Exxon Mobil Corporation 0.66
GTE Gran Tierra Energy Inc. 0.65
DIS Walt Disney Company 0.58
PEP PepsiCo, Inc. 0.57
MNST Monster Beverage Corporation 0.57
ORLY O’Reilly Automotive, Inc. 0.56
JKHY Jack Henry & Associates, Inc. 0.51
TTGT TechTarget, Inc. 0.50

Top Stock Pickers’ Exposure to Electronic Arts (EA)

Top stock pickers had negligible exposure to EA until 2015. In early-2015 EA became one of the largest exposures within our Expert Aggregate.

The top panel on the following chart shows cumulative nominal returns in black and cumulative residual returns (αReturns) in blue. Residual return or αReturn is the performance net of the systematic factors defined by the AlphaBetaWorks Statistical Equity Risk Model – the performance EA would have generated if systematic return had been flat. The bottom panel shows exposure to EA within the ABW Expert Aggregate:

Chart of the cumulative αReturn (residual return) of EA and exposure to EA within the hedged portfolio that combines the to 5% U.S. long stock pickers net consensus exposures

Cumulative αReturns of EA and Exposure to EA within the Hedged Portfolio of the Top U.S. Stock Pickers’ Net Consensus Longs

Top Stock Pickers’ Exposure to Visa Inc (V)

Our Expert Aggregate was underweight (short) V between 2011 and 2014 – a period of flat-to-negative αReturn when V lagged a passive portfolio with matching risk. V became an ABW Expert Aggregate consensus long by early 2014 – the start of a strong positive αReturn period:

Chart of the cumulative αReturn (residual return) of V and exposure to V within the hedged portfolio that combines the to 5% U.S. long stock pickers net consensus exposures

Cumulative αReturns of V and Exposure to V within the Hedged Portfolio of the Top U.S. Stock Pickers’ Net Consensus Longs

Top Stock Pickers’ Exposure to Exxon Mobil (XOM)

The Expert Aggregate was mostly underweight (short) XOM between 2008 and 2013, but grew exposure from 2012. By 2014 XOM was a top bet. This proved profitable during the 2014-2015 energy rout when XOM remained an island of stability, delivering positive αReturn:

Chart of the cumulative αReturn (residual return) of XOM and exposure to XOM within the hedged portfolio that combines the to 5% U.S. long stock pickers net consensus exposures

Cumulative αReturns of XOM and Exposure to XOM within the Hedged Portfolio of the Top U.S. Stock Pickers’ Net Consensus Longs

Conclusions

  • Robust analytics built on predictive risk models identify the top stock pickers in the sea of mediocrity.
  • Top stock pickers’ portfolios deliver consistently positive αReturns (residual returns), independent of the Market.
  • Top stock pickers’ net consensus longs (relative overweights) tend to generate positive future αReturns and net consensus shorts (relative underweights) tend to generate negative future αReturns .
  • Top stock pickers are rarely the most celebrated firms and their consensus longs are rarely the most celebrated stocks.
  • The most celebrated stocks frequently appear as top stock pickers’ consensus shorts.
The information herein is not represented or warranted to be accurate, correct, complete or timely.
Past performance is no guarantee of future results.
Copyright © 2012-2016, AlphaBetaWorks, a division of Alpha Beta Analytics, LLC. All rights reserved.
Content may not be republished without express written consent.
U.S. Patents Pending.

Hedge Fund Clustering in Q4 2015

Crowding consists of large capital pools chasing related strategies. Within the hedge fund industry, long equity portfolios crowd into several clusters with similar systematic (factor) and idiosyncratic (residual) bets. This hedge fund clustering is the internal structure of crowding. We illustrate the large-scale hedge fund clustering and crowded bets within the largest cluster. Allocators and fund followers without a handle on this phenomenon may be investing in an undifferentiated portfolio prone to liquidation, or paying high active fees for consensus factor exposures.

Hedge Fund Crowding and Hedge Fund Clustering

Our articles on hedge fund crowding analyze the factor (systematic) and residual (idiosyncratic) exposures of HF Aggregate, which consists of the long equity holdings of all U.S. hedge fund portfolios tractable from regulatory filings. Most analyses of crowding overlook bets shared by fund groups within the aggregate. To explore this internal structure of hedge fun crowding, in 2014 AlphaBetaWorks pioneered research on hedge fund clustering. Here we update this analysis with Q4 2015 holdings data.

Hedge Fund Clusters

Note that simplistic analysis of holdings overlap fails to measure fund similarity. Since their variance is overwhelmingly systematic, two funds with no overlapping positions but similar factor exposures can track each other closely. To identify clusters of funds without these deficiencies, we analyze factor and residual exposures of every portfolio relative to every other portfolio using the AlphaBetaWorks’ Statistical Equity Risk Model, a proven tool for forecasting portfolio risk and future performance. For each portfolio pair we estimate the future relative volatility (tracking error). The lower the expected relative tracking error between two funds, the more similar they are to each other.

Once each hedge fund pair is analyzed – hundreds of thousands of factor-based risk analyses – we find funds with similar exposures and build clusters (related to phylogenic trees, or family trees) of funds. We use agglomerative hierarchical clustering with estimated future relative tracking error as the metric of differentiation or dissimilarity. The resulting clusters capture similarities of all analyzable U.S. hedge fund long equity portfolios:

Chart of hedge fund clustering for U.S. long equity portfolios in Q4 2015

Clusters of U.S. Hedge Funds’ Long Equity Portfolios in Q4 2015

The largest cluster contains approximately 40 funds. It and other large clusters warrant careful scrutiny by allocators: those invested in a portfolio of clustered funds may be paying high active fees for a handful of consensus factor and stock-specific bets.

The AQR-Adage Hedge Fund Cluster

The AQR-Adage Cluster, named after two of its large and similar members, has recently been the largest cluster of hedge funds’ long equity portfolios:

Chart of hedge fund clustering within the largest cluster of U.S. Hedge Funds’ Q4 2015 Long Equity Portfolios

The Largest Hedge Fund Long Equity Portfolio Cluster in Q4 2015

A flat diagram illustrates the distances (estimated future tracking errors) between its members:

Chart of the flat view of clustering within the AQR-Adage cluster of U.S. Hedge Funds’ Q4 2015 Long Equity Portfolios

The AQR-Adage Long Equity Portfolio Cluster in Q4 2015

This cluster’s aggregate portfolio is similar to the U.S. equity market. We estimate only 1.8% tracking error of the AQR-Adage Cluster relative to the Russell 3000 Index.

Source Volatility (ann. %) Share of Variance (%)
Factor 1.26 48.23
Residual 1.31 51.77
Total 1.82 100.00

Put differently, we expect this cluster’s aggregate annual long portfolio return to differ from the market by more than 1.8% only about a third of the time.

AQR-Adage Cluster’s Factor (Systematic) Crowding

Below are this cluster’s significant factor exposures (in red) relative to the Russell 3000’s exposures (in gray):

Chart of exposures to the risk factors contributing most to the risk of the Q4 2015 AQR-Adage hedge fund long equity portfolio cluster relative to the U.S. Market

Factor Exposures of the AQR-Adage Hedge Fund Cluster in Q4 2015

Market (high-beta) and Size (small-cap) are the primary sources of the relative factor risk:

Chart of contributions to the relative factor (systematic) variance of the risk factors contributing most to the risk of the Q4 2015 AQR-Adage hedge fund long equity portfolio cluster relative to the U.S. Market

Factors Contributing Most to Relative Variance of the AQR-Adage Hedge Fund Cluster in Q4 2015

Factor Relative Exposure Factor Volatility Share of Relative Factor Variance Share of Relative Total Variance
Market 5.31 12.46 38.20 18.42
Size -8.23 8.09 22.14 10.68
Oil Price 1.42 29.43 18.84 9.09
Value -3.90 12.91 11.29 5.44
Finance -6.56 5.08 11.05 5.33
Utilities -2.21 11.28 6.05 2.92
Communications -1.18 11.98 2.79 1.35
Health -1.57 7.22 -2.97 -1.43
FX 1.50 7.28 -3.29 -1.59
Energy -2.07 11.77 -4.56 -2.20

(Relative exposures and relative variance contribution. All values are in %. Volatility is annualized.)

AQR-Adage Cluster’s Factor Crowding Stress Tests

AQR-Adage Cluster’s Maximum Outperformance

Given the AQR-Adage Cluster’s macroeconomic positioning (Long Market, Short Finance, Value, and Size), it would experience its highest outperformance in an environment similar to the 1999-2000 dot-com boom:

Chart of the cumulative factor (systematic) return for the historical scenario that would generate the larger relative outperformance for the AQR-Adage Hedge Fund Cluster in Q4 2015

Historical Scenario that Would Generate the Highest Relative Performance for the AQR-Adage Hedge Fund Cluster in Q4 2015

Factor Return Portfolio Exposure Benchmark Exposure Relative Exposure Portfolio Return Benchmark Return Relative Return
Market 31.52 107.31 102.00 5.31 34.06 32.21 1.85
Finance -19.62 12.76 19.32 -6.56 -2.62 -3.95 1.33
Oil Price 128.16 0.42 -1.00 1.42 0.39 -0.93 1.32
Size -10.49 -9.11 -0.88 -8.23 0.96 0.09 0.87
Value -21.96 -4.05 -0.15 -3.90 0.90 0.03 0.87

AQR-Adage Cluster’s Maximum Underperformance

These exposures would deliver the AQR-Adage Cluster its highest underperformance in an environment similar to the 2000-2001 .com crash:

Chart of the cumulative factor (systematic) return for the historical scenario that would generate the larger relative underperformance for the AQR-Adage Hedge Fund Cluster in Q4 2015

Historical Scenario that Would Generate the Lowest Relative Performance for the AQR-Adage Hedge Fund Cluster in Q4 2015

Factor Return Portfolio Exposure Benchmark Exposure Relative Exposure Portfolio Return Benchmark Return Relative Return
Finance 47.97 12.76 19.32 -6.56 5.39 8.24 -2.85
Value 86.46 -4.05 -0.15 -3.90 -2.67 -0.10 -2.57
Utilities 52.32 0.98 3.19 -2.21 0.45 1.46 -1.01
Market -14.21 107.31 102.00 5.31 -15.30 -14.51 -0.79
Energy 33.72 2.47 4.54 -2.07 0.77 1.43 -0.65

AQR-Adage Cluster Residual (Idiosyncratic) Crowding

The stock-specific bets of the AQR-Adage Cluster have grown more crowded as the idiosyncratic volatility of several crowded longs spiked recently. Four stocks account for most of its relative residual risk:

Chart of contributions to the relative residual (idiosyncratic) variance of the stocks contributing most to the risk of the Q4 2015 AQR-Adage hedge fund long equity portfolio cluster relative to U.S. Market

Stocks Contributing Most to Relative Residual Variance of the AQR-Adage Hedge Fund Cluster in Q4 2015

Symbol Name Relative Exposure Residual Volatility Share of Relative Residual Variance Share of Relative Total Variance
TPIV TapImmune Inc. 0.41 125.70 20.11 9.21
NHLD National Holdings Corporation 0.75 68.38 20.05 9.18
PTRC Petro River Oil Corp. 0.22 151.46 8.05 3.69
LRAD LRAD Corporation 0.76 38.81 6.69 3.06
VRX Valeant Pharmaceuticals International, Inc. 0.51 43.72 3.82 1.75
JD JD.com, Inc. Sponsored ADR Class A 0.49 31.91 1.86 0.85
CHTR Charter Communications, Inc. Class A 0.75 20.31 1.76 0.81
IBKR Interactive Brokers Group, Inc. Class A 0.71 19.64 1.47 0.67
AAPL Apple Inc. -0.81 16.25 1.33 0.61
GNUS Genius Brands International, Inc. 0.12 103.74 1.21 0.56

(Relative exposures and relative variance contribution. All values are in %. Volatility is annualized.)

Idiosyncratic crowding is not the main problem with this cluster, since the expected idiosyncratic tracking error is low (around 1.3%). However, it is vital for fund followers, as it helps explain unexpected volatility in the most crowded names. In fact, several of the crowded names above have shown signs of mass liquidation. It is also worth noting that the crowded names’ from earlier in 2015 presaged subsequent disasters. Valeant Pharmaceuticals (VRX), Micron, Inc. (MU), and Cheniere Natural Gas (LNG) were all featured in our crowding work.

Passivity is a bigger problem still, since allocators to diversified portfolios of hedge funds within this cluster may be paying high fees for a few consensus bets.

Summary

  • An analysis of the underlying structure of hedge fund crowding reveals hedge fund clustering – groups of portfolios with similar bets.
  • The largest cluster’s factor herding is towards Market (high-beta), short Size (small-cap), and four stock-specific bets (TPIV, NHLD, PTRC, and LRAD).
  • Allocators and fund followers unaware of clustering may find themselves in a nearly passive factor portfolio and a handful of consensus stock-specific bets.

The information herein is not represented or warranted to be accurate, correct, complete or timely.
Past performance is no guarantee of future results.
Copyright © 2012-2016, 
AlphaBetaWorks, a division of Alpha Beta Analytics, LLC. All rights reserved.
Content may not be republished without express written consent.

Hedge Fund Crowding Update – Q4 2015

Most analyses of hedge fund crowding focus on their residual (idiosyncratic, stock-specific) bets. This is misguided, since over 85% of the monthly return variance for the majority of hedge fund long equity portfolios is due to factor (systematic) exposures, rather than individual stocks. Indeed, it is the exceptional factor crowding and the record market risk that have driven much of the industry’s recent misery (just as they have driven much of the earlier upswings). In Q4 2015, a single factor accounted for half of U.S. hedge funds’ relative long equity risk (tracking error). We survey all sources of hedge fund crowding at year-end 2015 and identify the market regimes that would generate the highest relative outperformance and underperformance for the crowded factor portfolio. These are the regimes that would most benefit or hurt hedge fund investors and followers.

Identifying Hedge Fund Crowding

This piece follows the approach of our earlier articles on crowding: We processed regulatory filings of over 1,000 hedge funds and created a position-weighted portfolio (HF Aggregate) consisting of all the tractable hedge fund long U.S. equity portfolios. We then analyzed HF Aggregate’s risk relative to U.S. Market using the AlphaBetaWorks Statistical Equity Risk Model – a proven system for performance forecasting. The top contributors to HF Aggregate’s relative risk are the most crowded hedge fund bets.

Hedge Fund Aggregate’s Risk

The Q4 2015 HF Aggregate had 3.7% estimated future tracking error relative to U.S. Market; over two thirds of this was due to factor (systematic) exposures:

Factor (systematic) and residual (idiosyncratic) components of hedge fund crowding, or U.S. Hedge Fund Aggregate’s variance relative to U.S. Market on 12/31/2015

Components of the Relative Risk for U.S. Hedge Fund Aggregate in Q4 2015

Source Volatility (ann. %) Share of Variance (%)
Factor 3.10 69.07
Residual 2.08 30.93
Total 3.73 100.00

Simplistic analysis of hedge fund crowding that lacks a capable risk model will miss these systematic exposures. Among its flows, this comparison of holdings will overlook funds with no position overlap but high future correlation due to similar factor exposures. Hence, this simplistic analysis of hedge fund crowding fosters dangerous complacency.

Hedge Fund Factor (Systematic) Crowding

Factor exposures drove nearly 70% of the relative risk of HF Aggregate at year-end 2015. Below are the principal factor exposures (in red) relative to U.S. Market’s exposures (in gray):

Chart of the factor exposures contributing most to hedge fund crowding, or the factor variance of U.S. Hedge Fund Aggregate Portfolio relative to U.S. Market on 12/31/2015

Significant Absolute and Relative Factor Exposures of U.S. Hedge Fund Aggregate in Q4 2015

Of these bets, Market (Beta) alone accounts for two thirds of the relative and half of the total factor risk, as illustrated below:

Chart of the main factors behind systematic hedge fund crowding and their cumulative contribution to the factor variance of U.S. Hedge Fund Aggregate Portfolio relative to U.S. Market on 12/31/2015

Factors Contributing Most to Relative Factor Variance of U.S. Hedge Fund Aggregate in Q4 2015

Factor Relative Exposure Factor Volatility Share of Relative Factor Variance Share of Relative Total Variance
Market 18.27 12.46 68.12 47.05
Oil Price 2.28 29.43 13.08 9.04
Bond Index -7.53 3.33 4.97 3.43
Utilities -3.10 11.28 4.77 3.30
Consumer -8.30 3.75 3.54 2.44
Energy -3.21 11.77 -2.96 -2.04
Health 4.79 7.22 2.54 1.75
Communications -1.67 11.98 1.91 1.32
Finance -6.89 5.08 1.68 1.16
Size -1.96 8.09 1.34 0.92

(Relative exposures and relative variance contribution. All values are in %. Volatility is annualized.)

Thus, the most important source of hedge fund crowding is not a stock or a group of stocks, but systematic exposure to the U.S. Market Factor. When nearly half of the industry’s risk comes from a single Factor, fixation on the individual crowded stocks is particularly dangerous.

The U.S. Market crowding alone explains much of the recent industry misery. In this era of systematic crowding, risk management with a robust and predictive factor model is particularly vital for managers’ and allocators’ survival.

Hedge Fund Factor Crowding Stress Tests

Hedge Fund Crowding Maximum Outperformance

Given Hedge Fund Aggregate’s bullish macroeconomic positioning (Long Market, Short Bonds/Long Interest Rates), it would experience its highest outperformance in an environment similar to the March-2009 rally. In this scenario, HF Aggregate’s factor portfolio would outperform by 20%:

Chart of the cumulative factor returns for the historical scenario that would generate the highest relative return for the 12/31/2015 U.S. Hedge Fund Aggregate Portfolio relative to U.S. Market

Historical Scenario that Would Generate the Highest Relative Performance for the Q4 2015 U.S. Hedge Fund Aggregate

The top contributors to this outperformance would be the following exposures:

Factor Return Portfolio Exposure Benchmark Exposure Relative Exposure Portfolio Return Benchmark Return Relative Return
Market 66.04 120.07 101.80 18.27 83.00 67.50 15.50
Oil Price 87.13 1.53 -0.75 2.28 1.05 -0.51 1.56
Bond Index -6.29 -4.92 2.61 -7.53 0.31 -0.17 0.48
Energy -12.54 1.61 4.82 -3.21 -0.20 -0.61 0.41
Communications -17.62 0.52 2.19 -1.67 -0.10 -0.41 0.31

Hedge Fund Crowding Maximum Underperformance

Given Hedge Fund Aggregate’s bullish macroeconomic positioning, combined with a long Technology and short Finance exposures, it would experience its highest underperformance in an environment similar to the 2000-2001 .com Crash. In this scenario, HF Aggregate’s factor portfolio would underperform by 8%:

Chart of the cumulative factor returns for the historical scenario that would generate the lowest relative return for the 12/31/2015 U.S. Hedge Fund Aggregate Portfolio relative to U.S. Market

Historical Scenario that Would Generate the Lowest Relative Performance for the Q4 2015 U.S. Hedge Fund Aggregate

The top contributors to this underperformance would be the following exposures:

Factor Return Portfolio Exposure Benchmark Exposure Relative Exposure Portfolio Return Benchmark Return Relative Return
Finance 47.97 12.48 19.36 -6.89 5.27 8.26 -2.99
Market -14.21 120.07 101.80 18.27 -17.22 -14.48 -2.74
Technology -36.73 23.75 20.14 3.62 -9.83 -8.38 -1.45
Utilities 52.32 0.22 3.31 -3.10 0.10 1.51 -1.42
Consumer 12.36 14.87 23.17 -8.30 1.82 2.85 -1.02

Hedge Fund Residual (Idiosyncratic) Crowding

A third of the year-end 2015 hedge fund crowding is due to residual (idiosyncratic, stock-specific) risk. Valeant Pharmaceuticals International (VRX) and Netflix (NFLX) are responsible for nearly half of it:

Chart of the main stock-specific sources of hedge fund crowding and their cumulative contribution to the residual variance of U.S. Hedge Fund Aggregate Portfolio relative to U.S. Market on 12/31/2015

Stocks Contributing Most to Relative Residual Variance of U.S. Hedge Fund Aggregate in Q4 2015

Though there may be sound individual reasons for these investments, they are vulnerable to brutal liquidation. Given the recent damage to hedge funds from herding, these crowded residual bets remain vulnerable:

Symbol Name Relative Exposure Residual Volatility Share of Relative Residual Variance Share of Relative Total Variance
VRX Valeant Pharmaceuticals International, Inc. 2.67 43.72 31.56 9.76
NFLX Netflix, Inc. 1.57 54.62 17.15 5.30
JD JD.com, Inc. Sponsored ADR Class A 1.60 31.91 6.05 1.87
LNG Cheniere Energy, Inc. 1.38 33.35 4.88 1.51
CHTR Charter Communications, Inc. Class A 1.79 20.31 3.08 0.95
TWC Time Warner Cable Inc. 1.85 16.14 2.06 0.64
AGN Allergan plc 1.83 14.62 1.66 0.51
FLT FleetCor Technologies, Inc. 1.18 19.61 1.23 0.38
PCLN Priceline Group Inc 1.12 20.10 1.18 0.36
MSFT Microsoft Corporation 1.54 14.13 1.10 0.34

(Relative exposures and relative variance contribution. All values are in %. Volatility is annualized.)

Though stock-specific bets remain important, allocators and fund followers should pay particular attention to their factor exposures in the current environment of extreme systematic hedge fund crowding. Many may be effectively invested in leveraged passive index fund portfolio, with the added insult of high fees. AlphaBetaWorks Analytics address all of these needs with the coverage of market-wide and sector-specific herding, plus aggregate factor exposures of funds and portfolios of funds.

Summary

  • The main source of Q4 2015 hedge fund crowding, responsible for nearly half of the relative long equity risk, was record U.S. Market exposure.
  • The main sources of Q4 2015 residual crowding were VRX and NFLX.
  • Given the high factor (systematic) crowding among hedge funds’ long equity portfolios, current analysis of crowding risks must focus on the factor exposures, rather than individual positions.
The information herein is not represented or warranted to be accurate, correct, complete or timely.
Past performance is no guarantee of future results.
Copyright © 2012-2016, AlphaBetaWorks, a division of Alpha Beta Analytics, LLC. All rights reserved.
Content may not be republished without express written consent.