U.S. hedge funds share a few systematic and idiosyncratic long bets. These crowded bets are the main sources of aggregate hedge fund relative performance and of many individual funds’ returns. We survey the risk factors and the stocks behind most of Q3 2014 hedge fund herding.
Investors should treat crowded ideas with caution: Due to the congestion of their hedge fund investor base, crowded stocks tend to be more volatile and are vulnerable to mass selling. In addition, the risk-adjusted performance of consensus bets has been disappointing.
Identifying Crowding
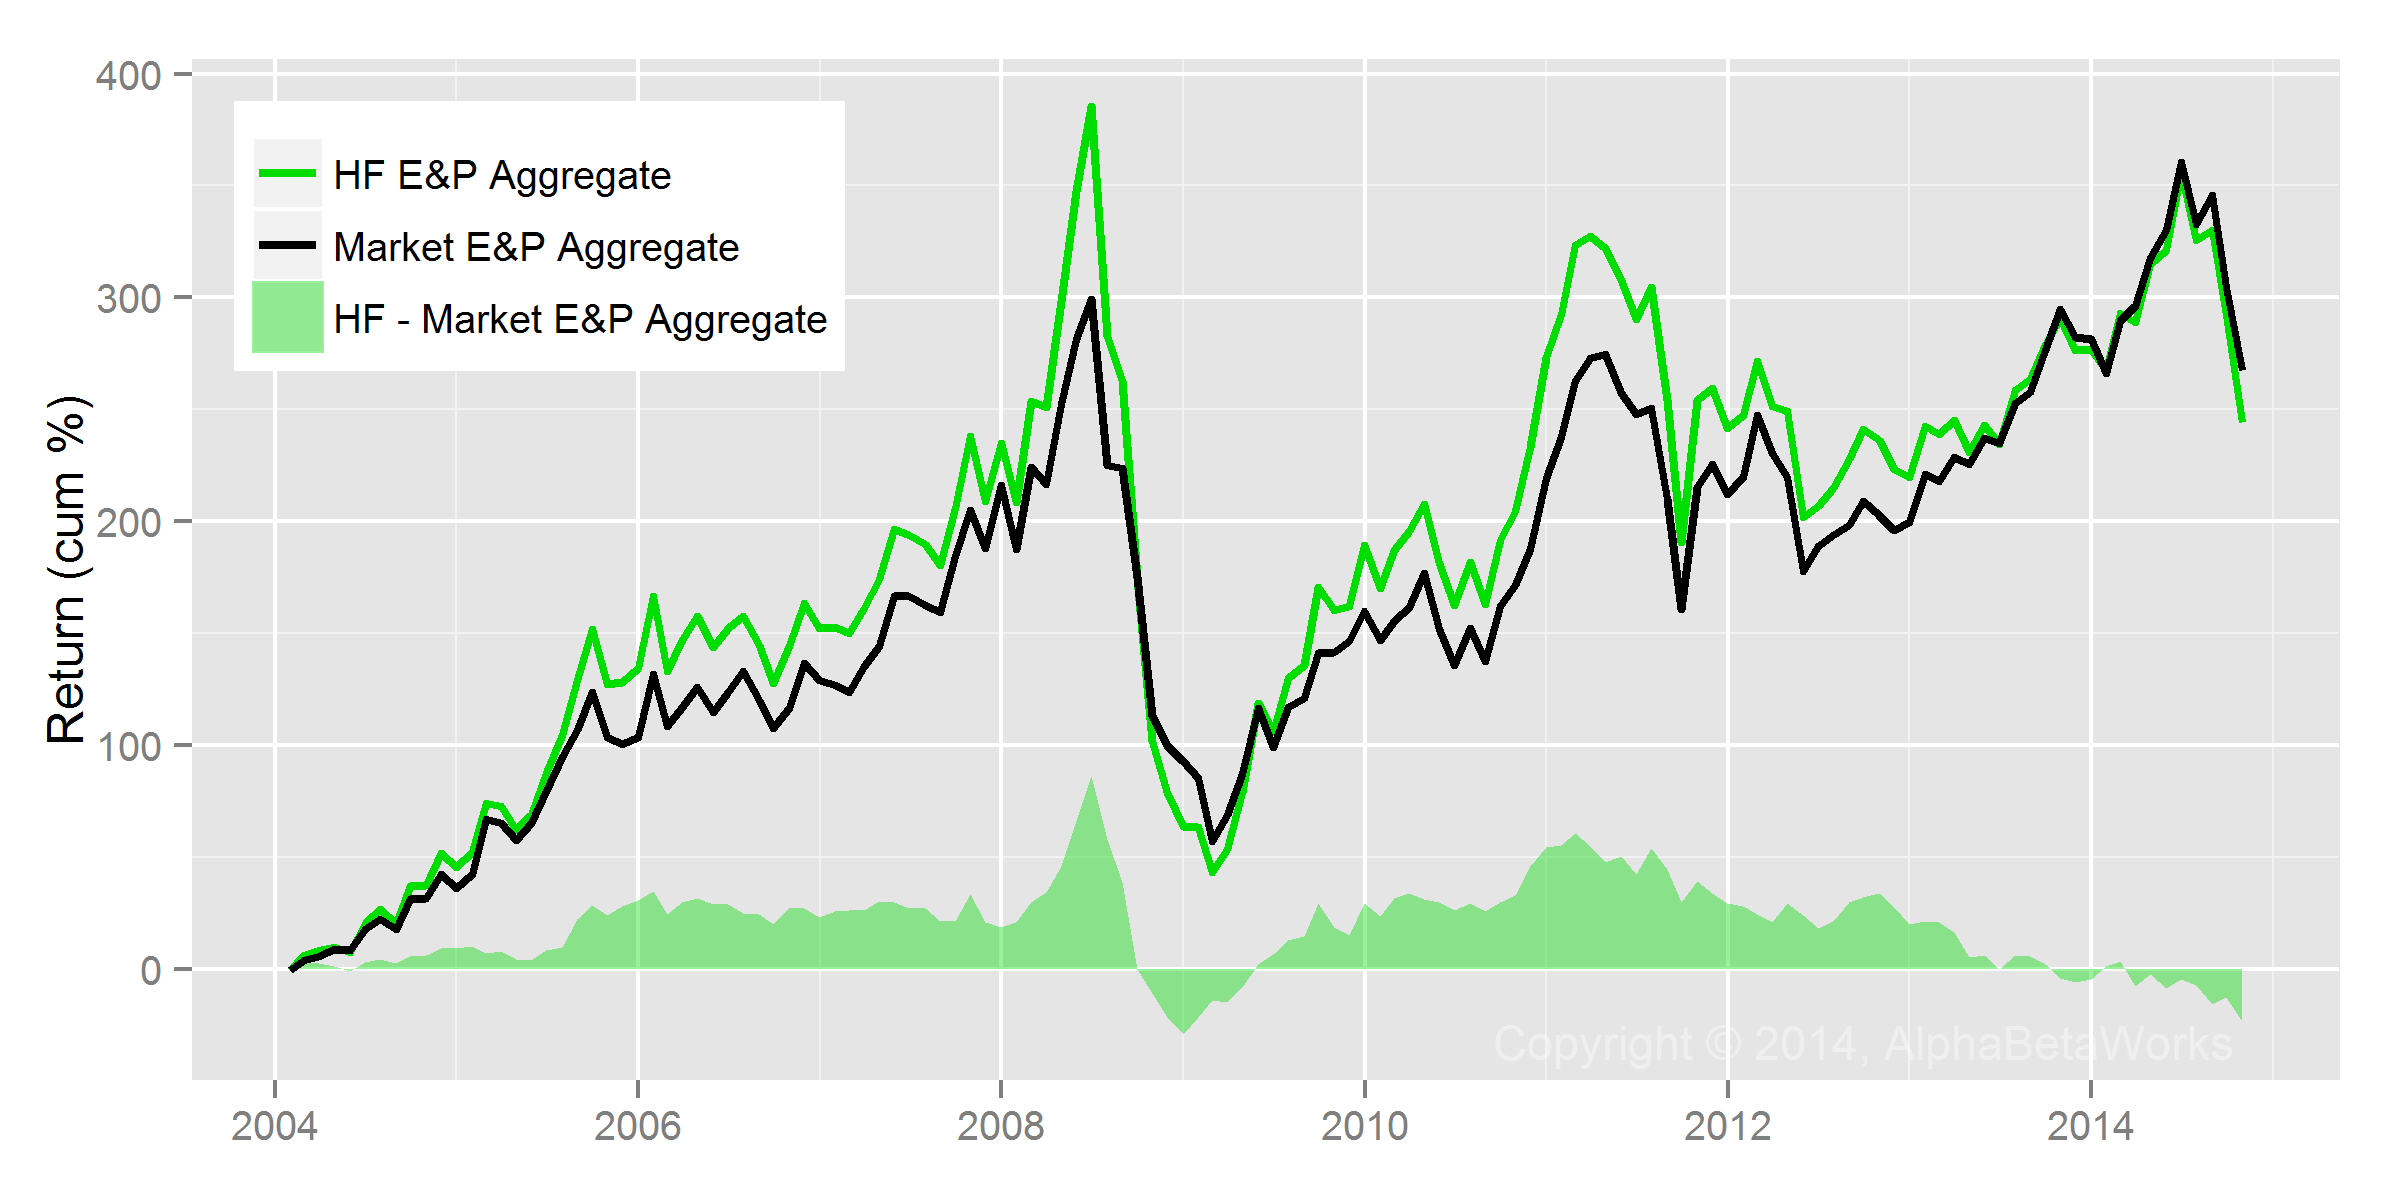
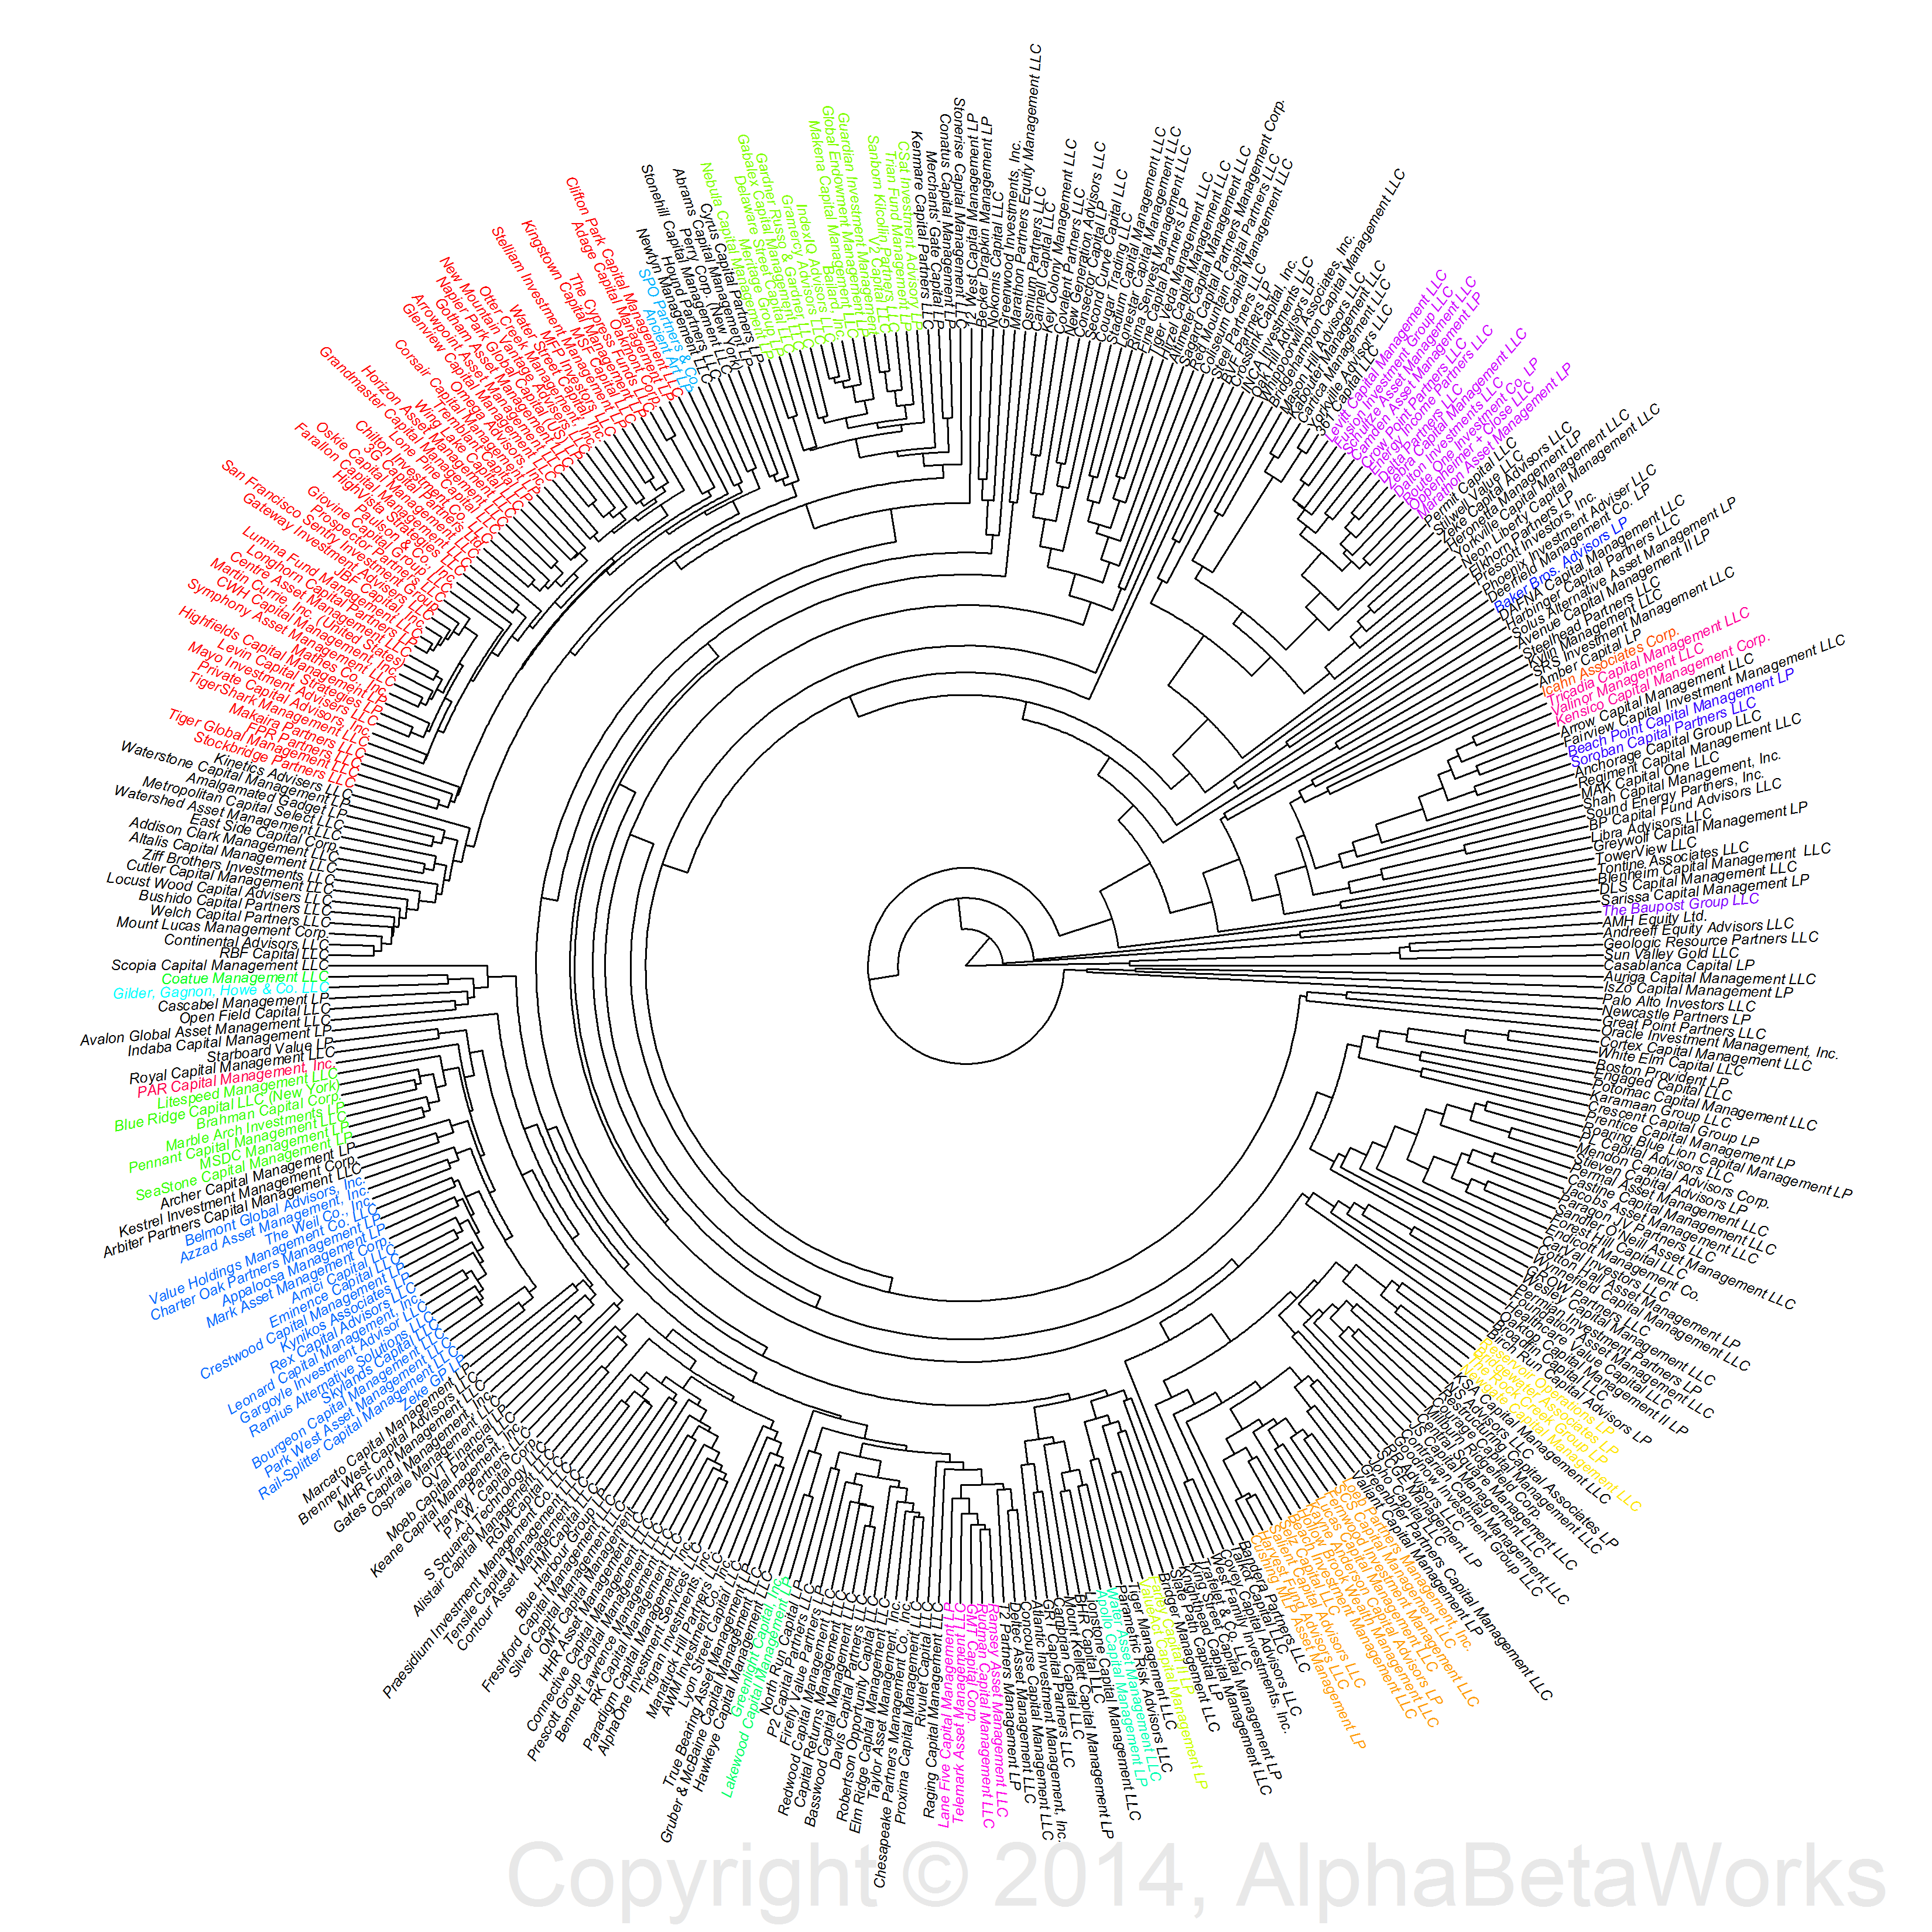
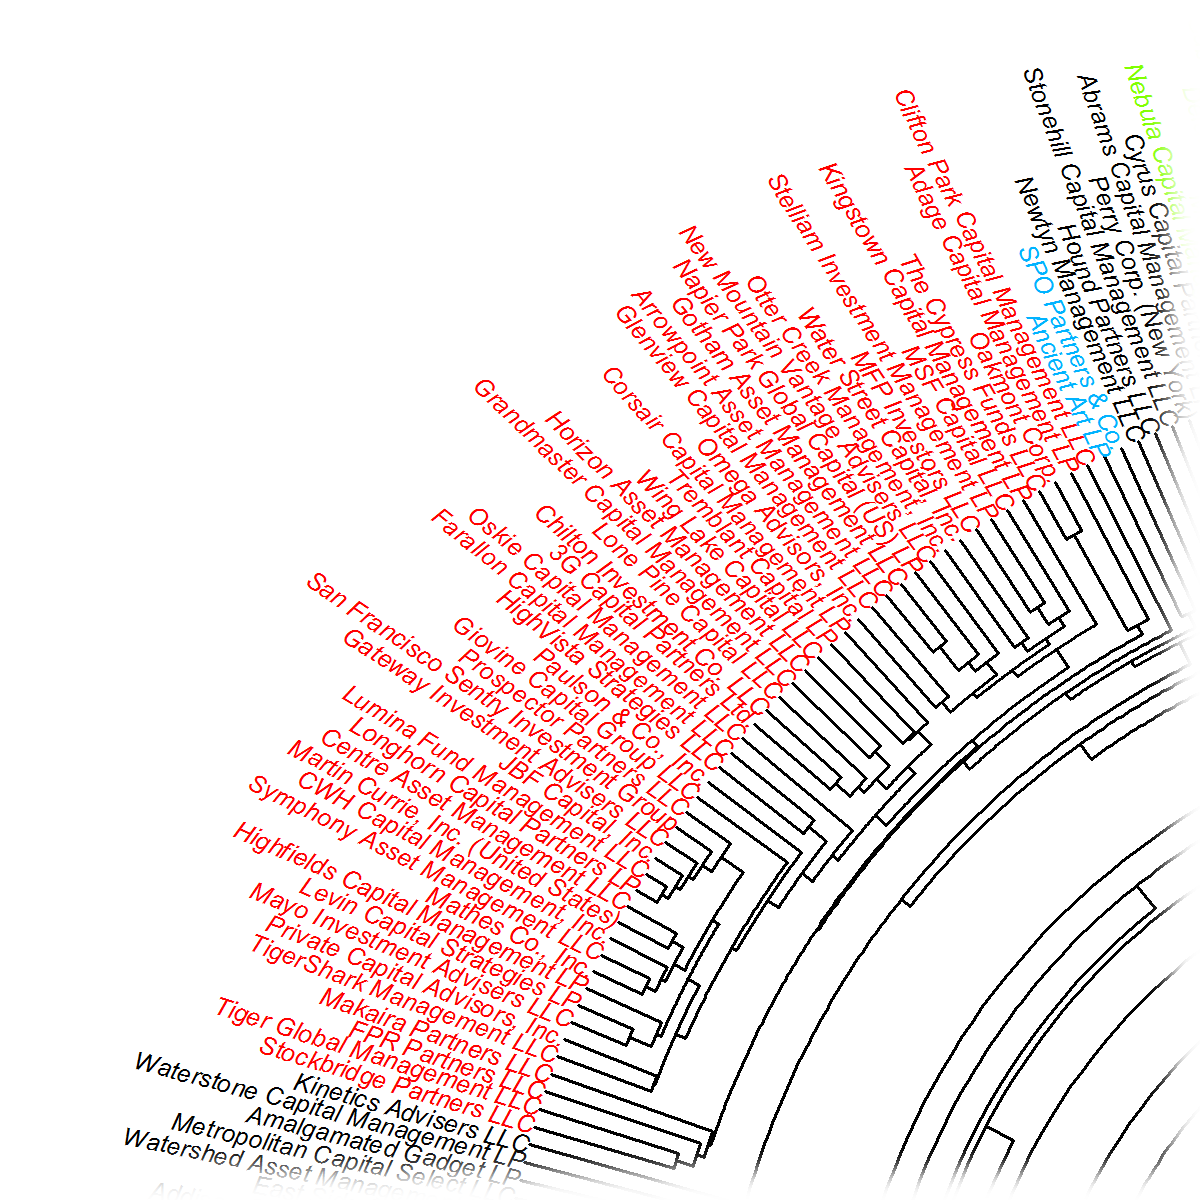
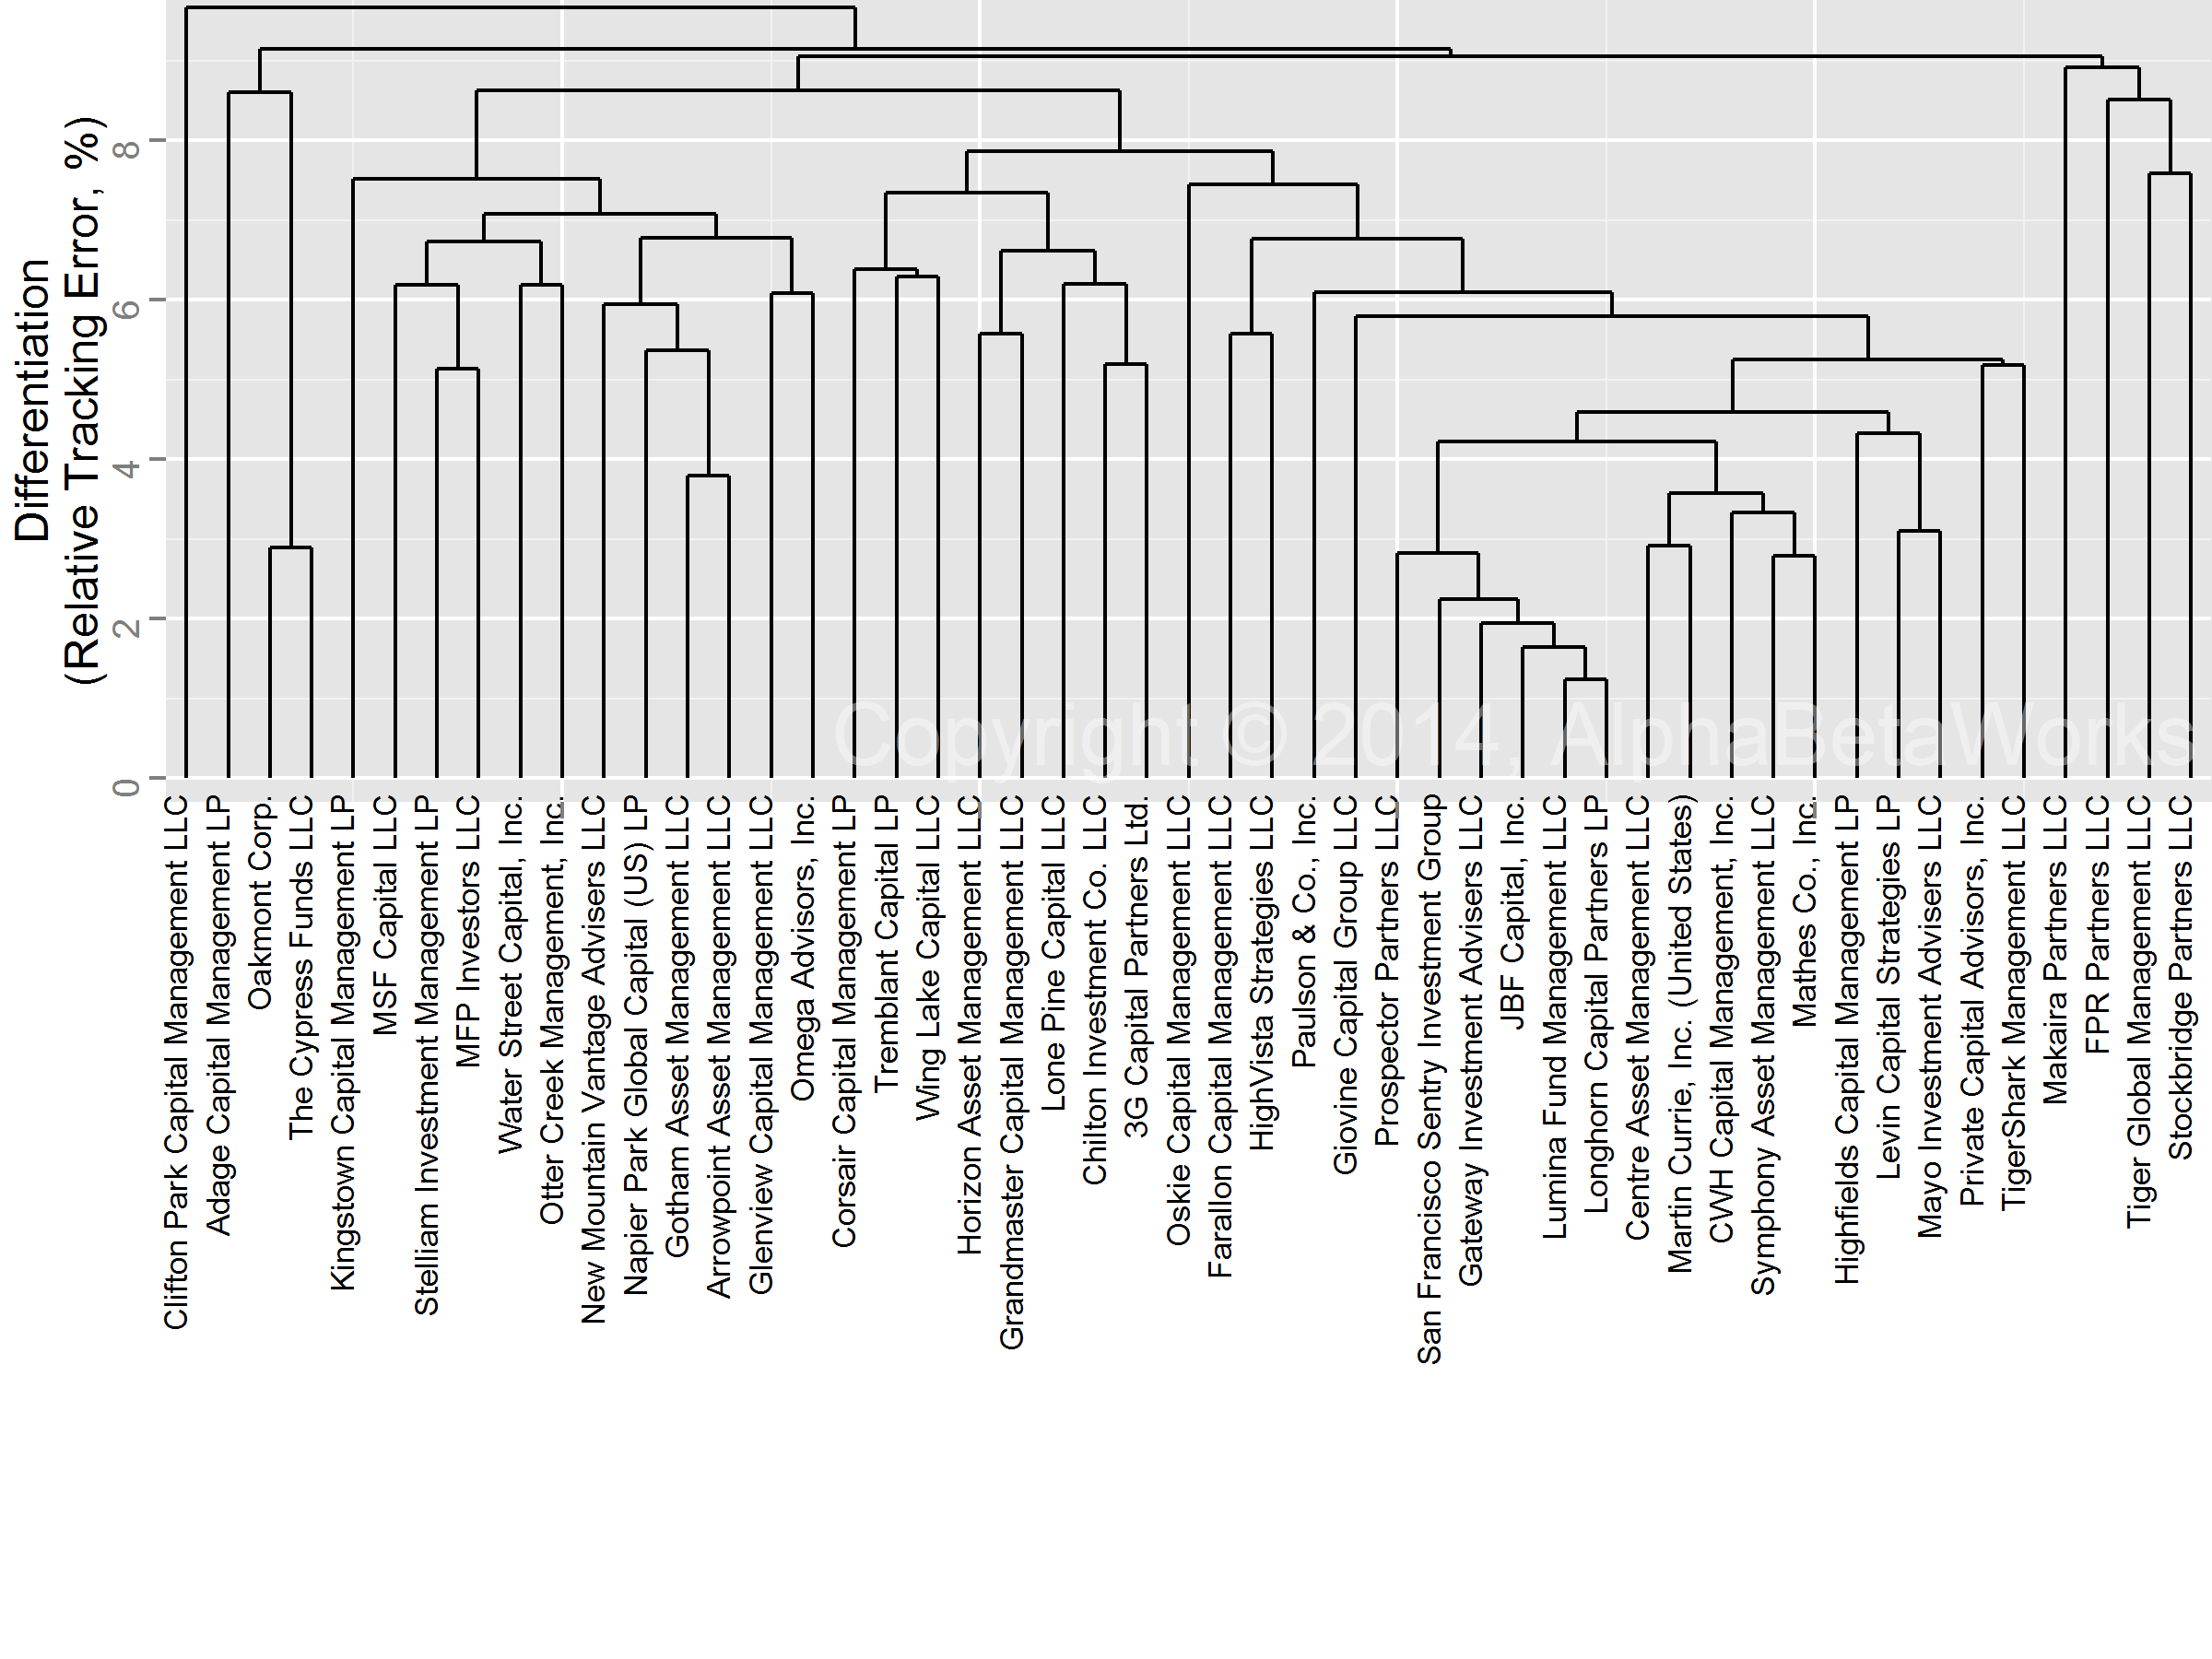
This piece follows the approach of our earlier articles on fund crowding: We created an aggregate position-weighted portfolio (HF Aggregate) consisting of popular securities held by approximately 500 U.S. hedge funds with medium to low turnover. We then evaluated the HF Aggregate risk relative to the U.S. Market (Russell 3000) using AlphaBetaWorks’ Statistical Equity Risk Model and looked for evidence of crowding. Finally, we analyzed risk and calculated each fund’s tracking error relative to HF Aggregate to see which most closely resembled it.
Hedge Fund Aggregate Risk
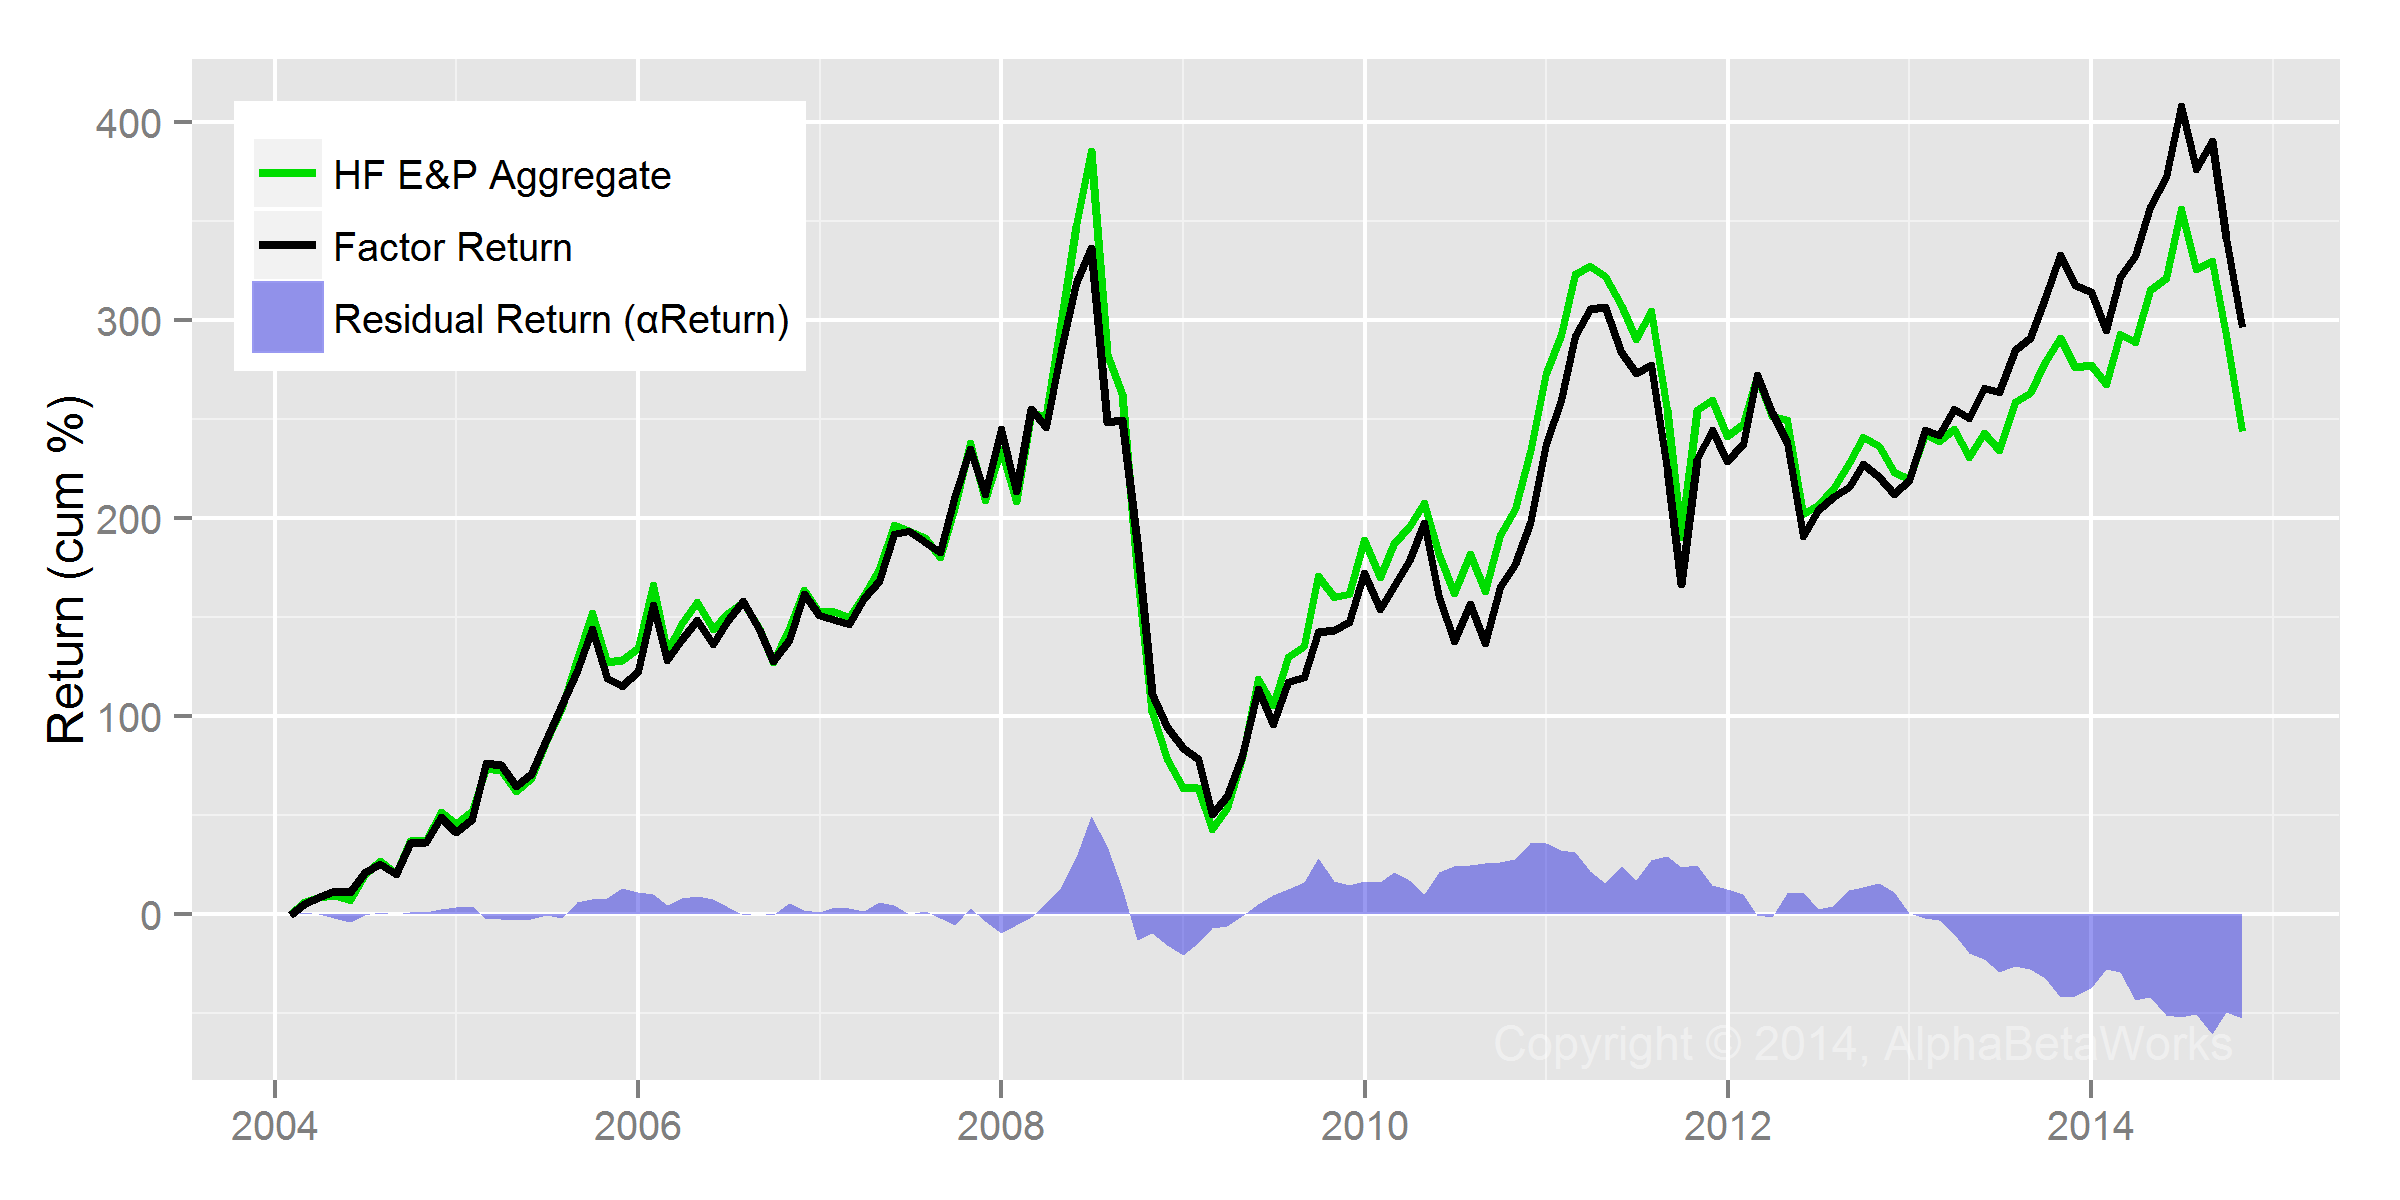
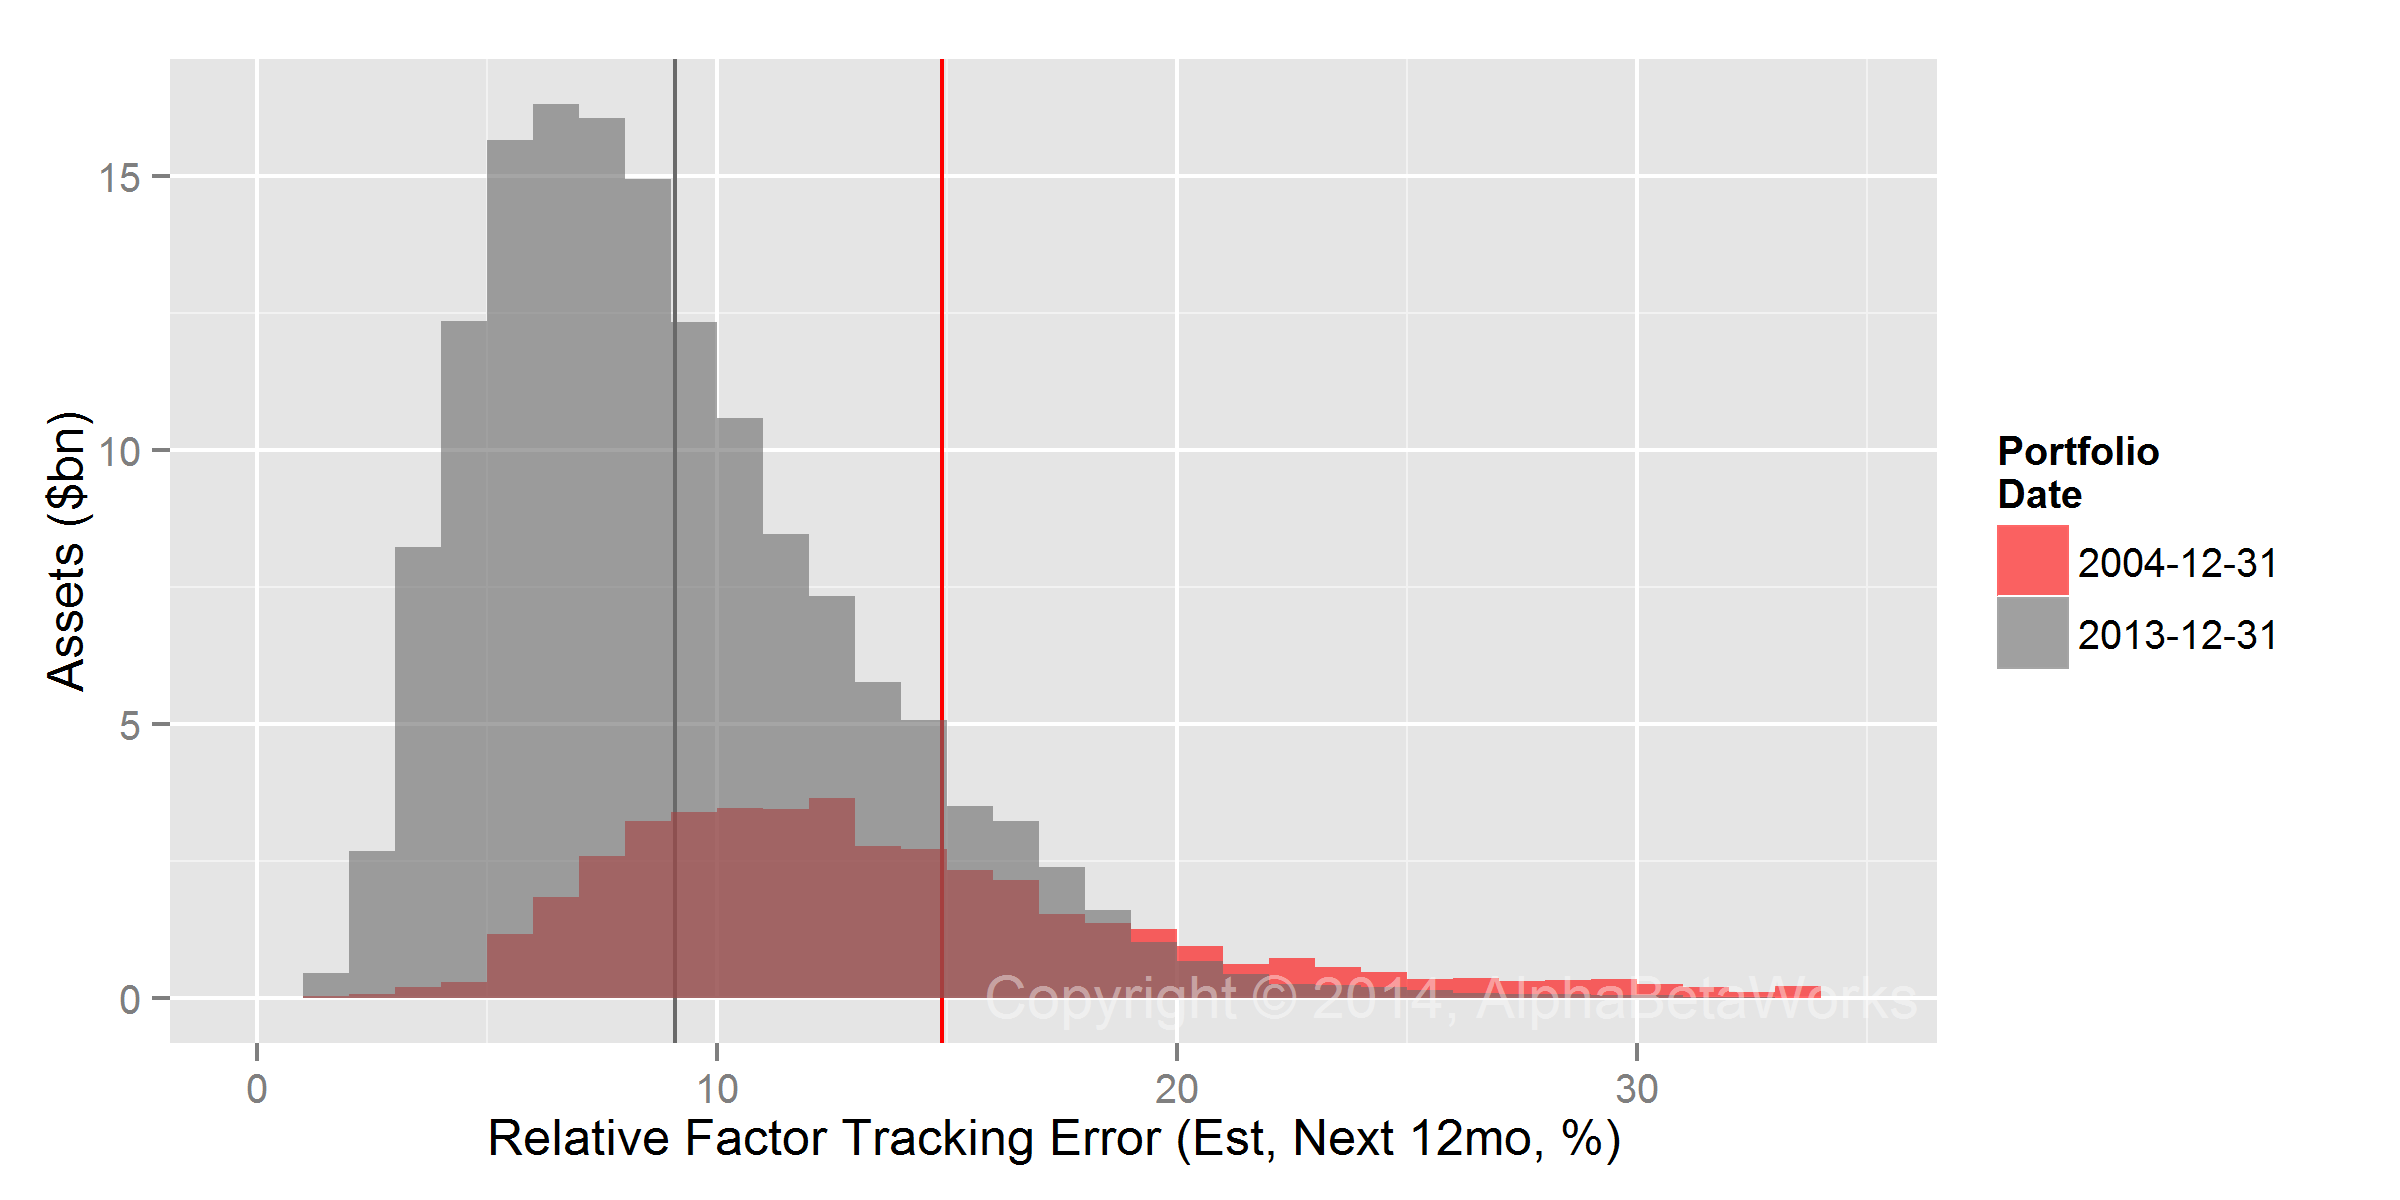
The Q3 2014 HF Aggregate had 2.7% estimated future tracking error relative to the Market. Risk was evenly split between factor (systematic) and residual (idiosyncratic) bets:
| Source | Volatility (%) | Share of Variance (%) |
| Factor | 1.99 | 52.64 |
| Residual | 1.89 | 47.36 |
| Total | 2.74 | 100 |
This 2.7% tracking error estimate decreased by a fifth since our Q2 2014 estimate of 3.3%.
The HF Aggregate is nearly passive and will have a very hard time earning a typical fee. Because of this, investing in a broadly diversified portfolio of long-biased hedge funds is almost certainly a bad idea.
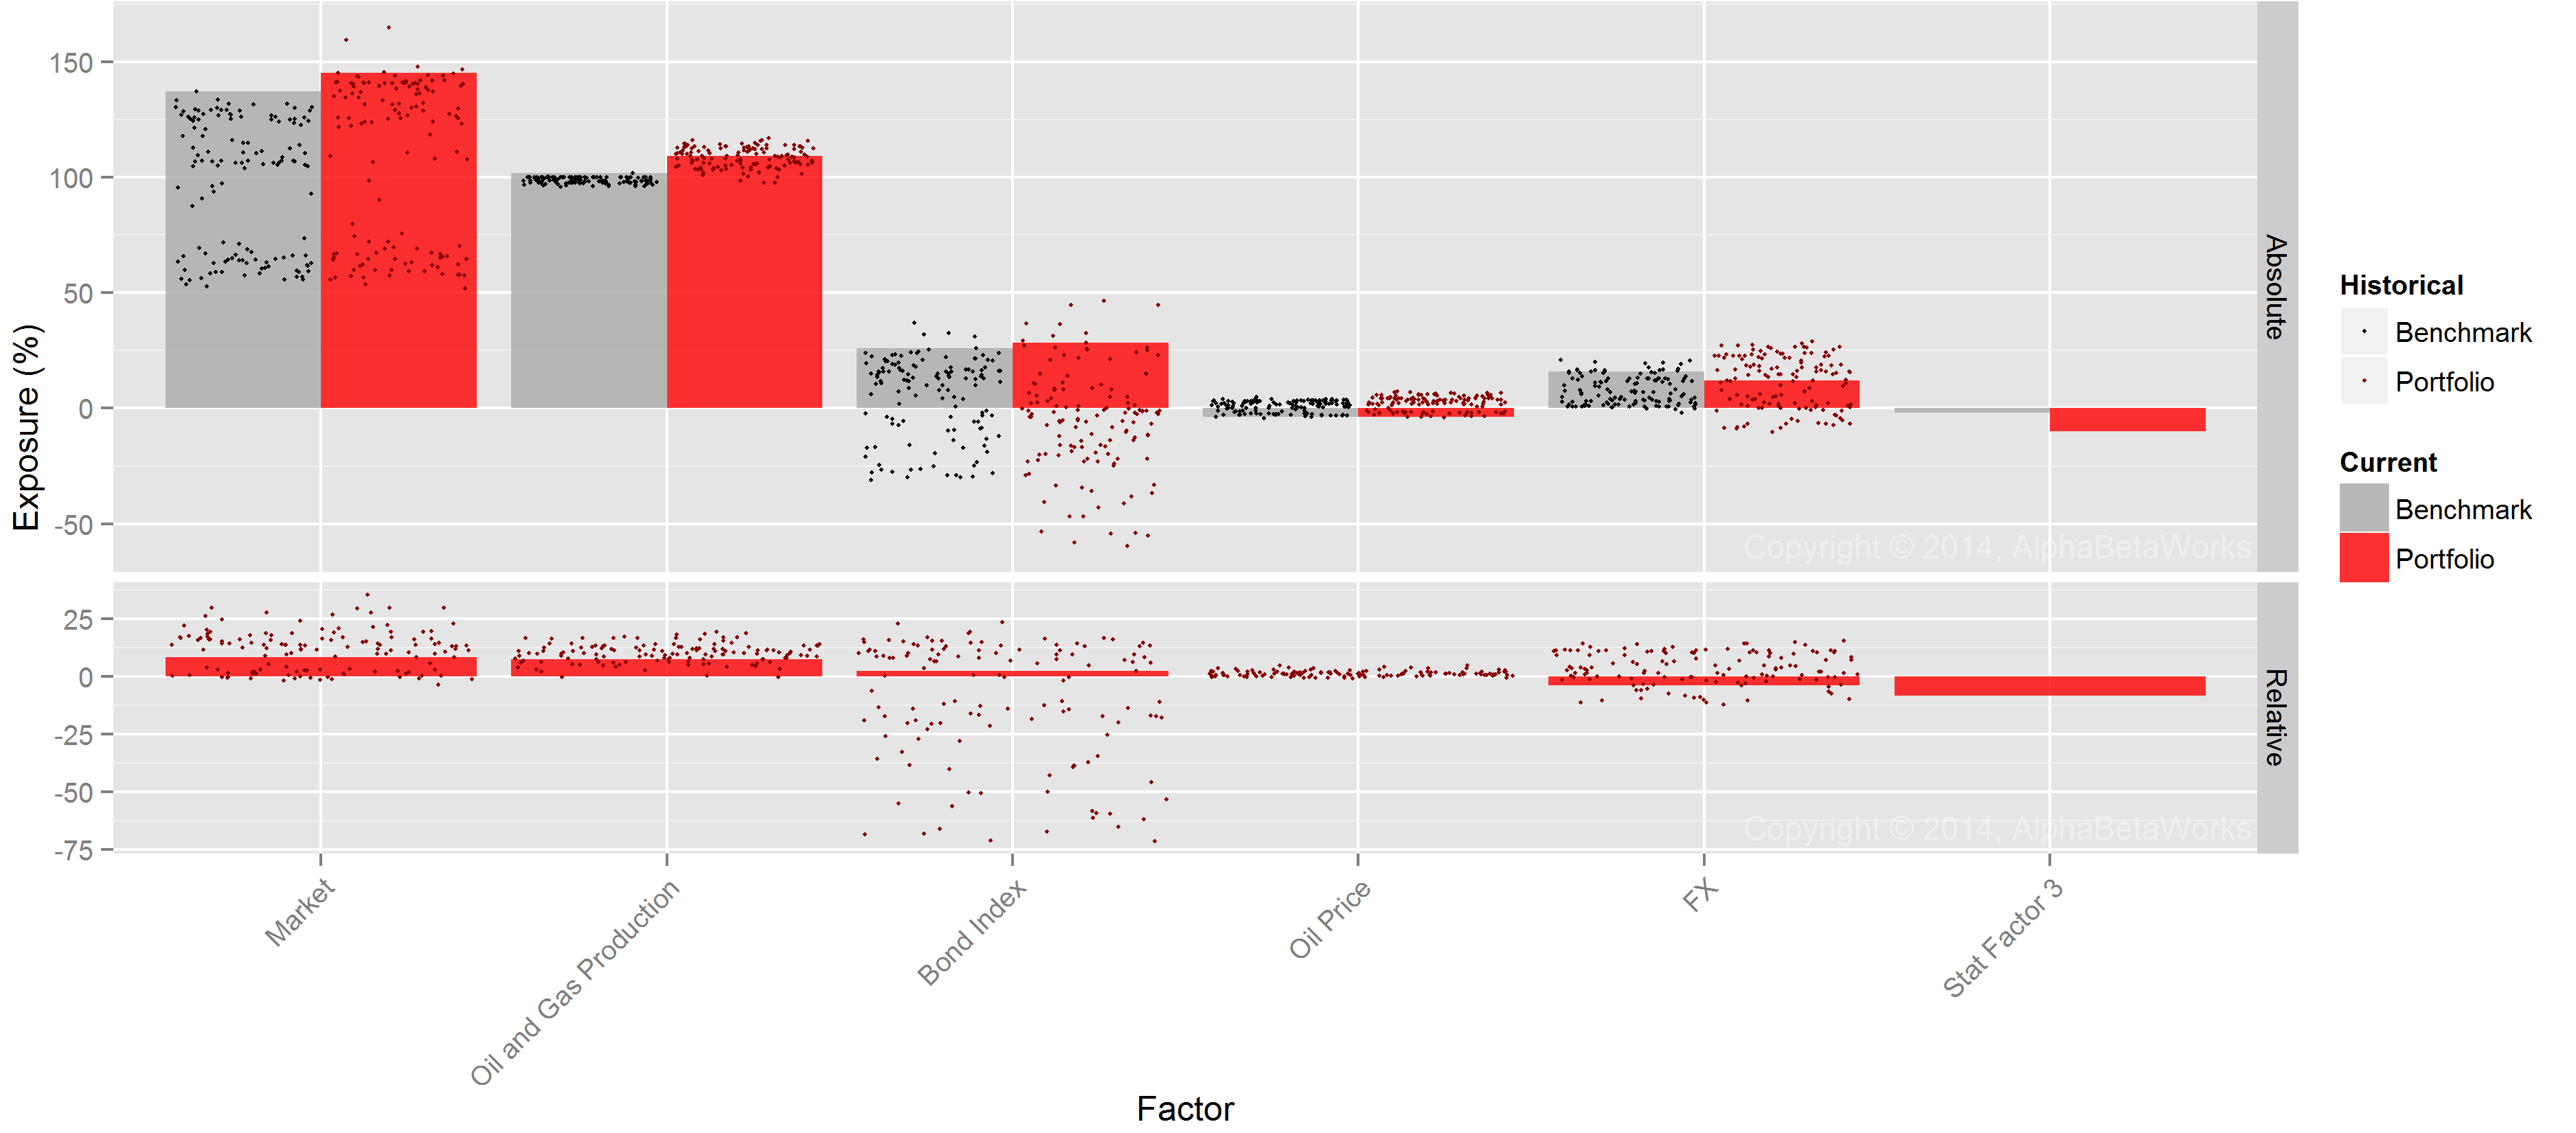
Hedge Fund Factor (Systematic) Crowding
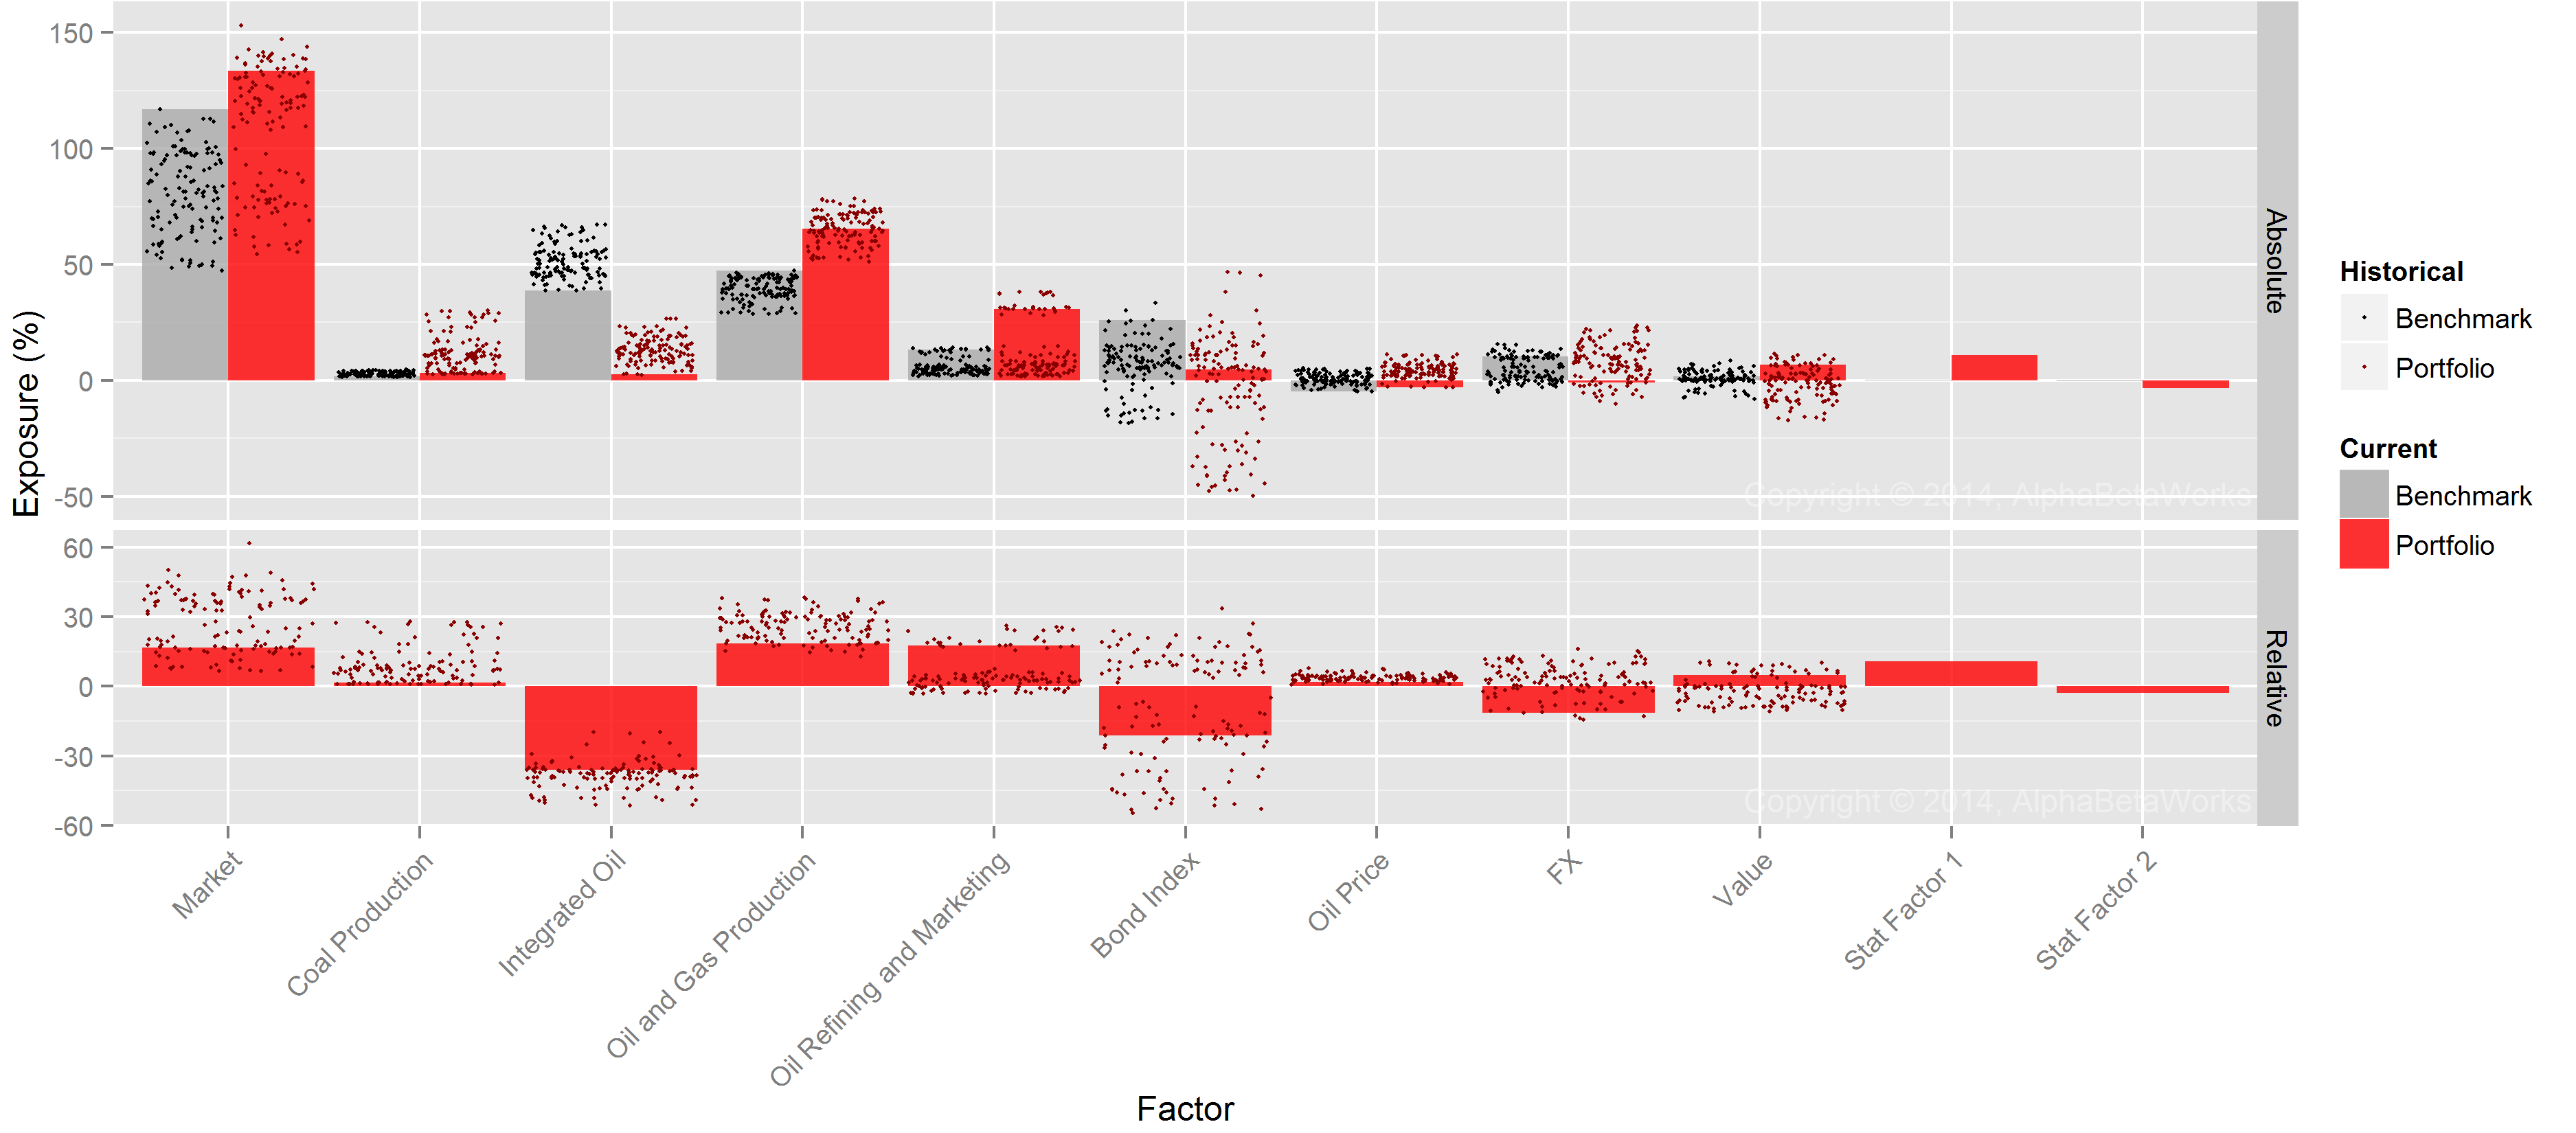
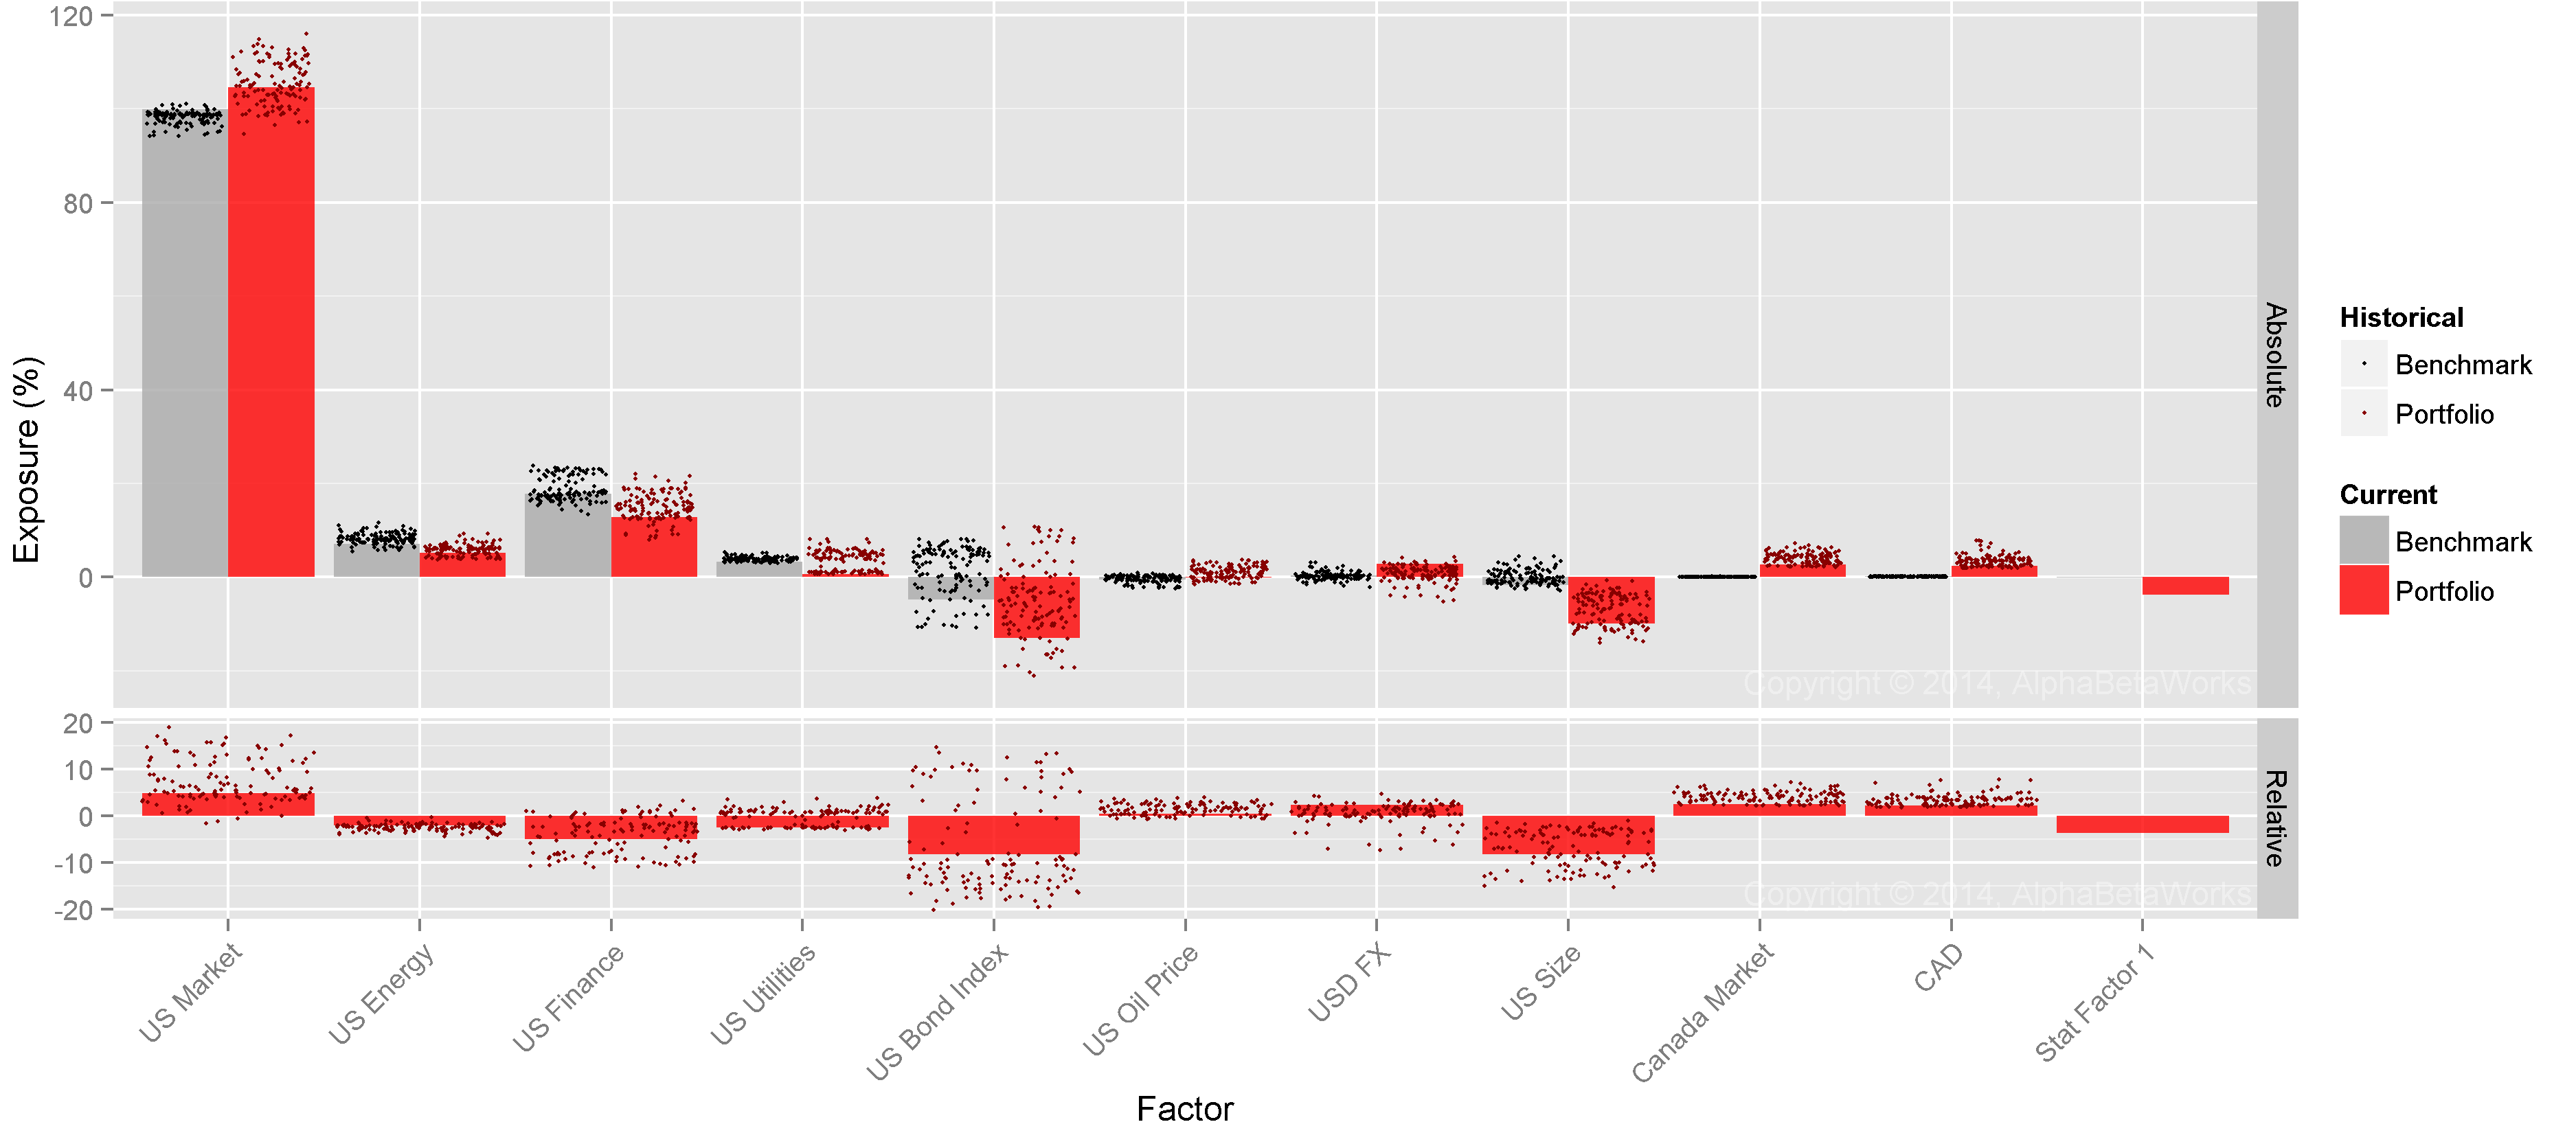
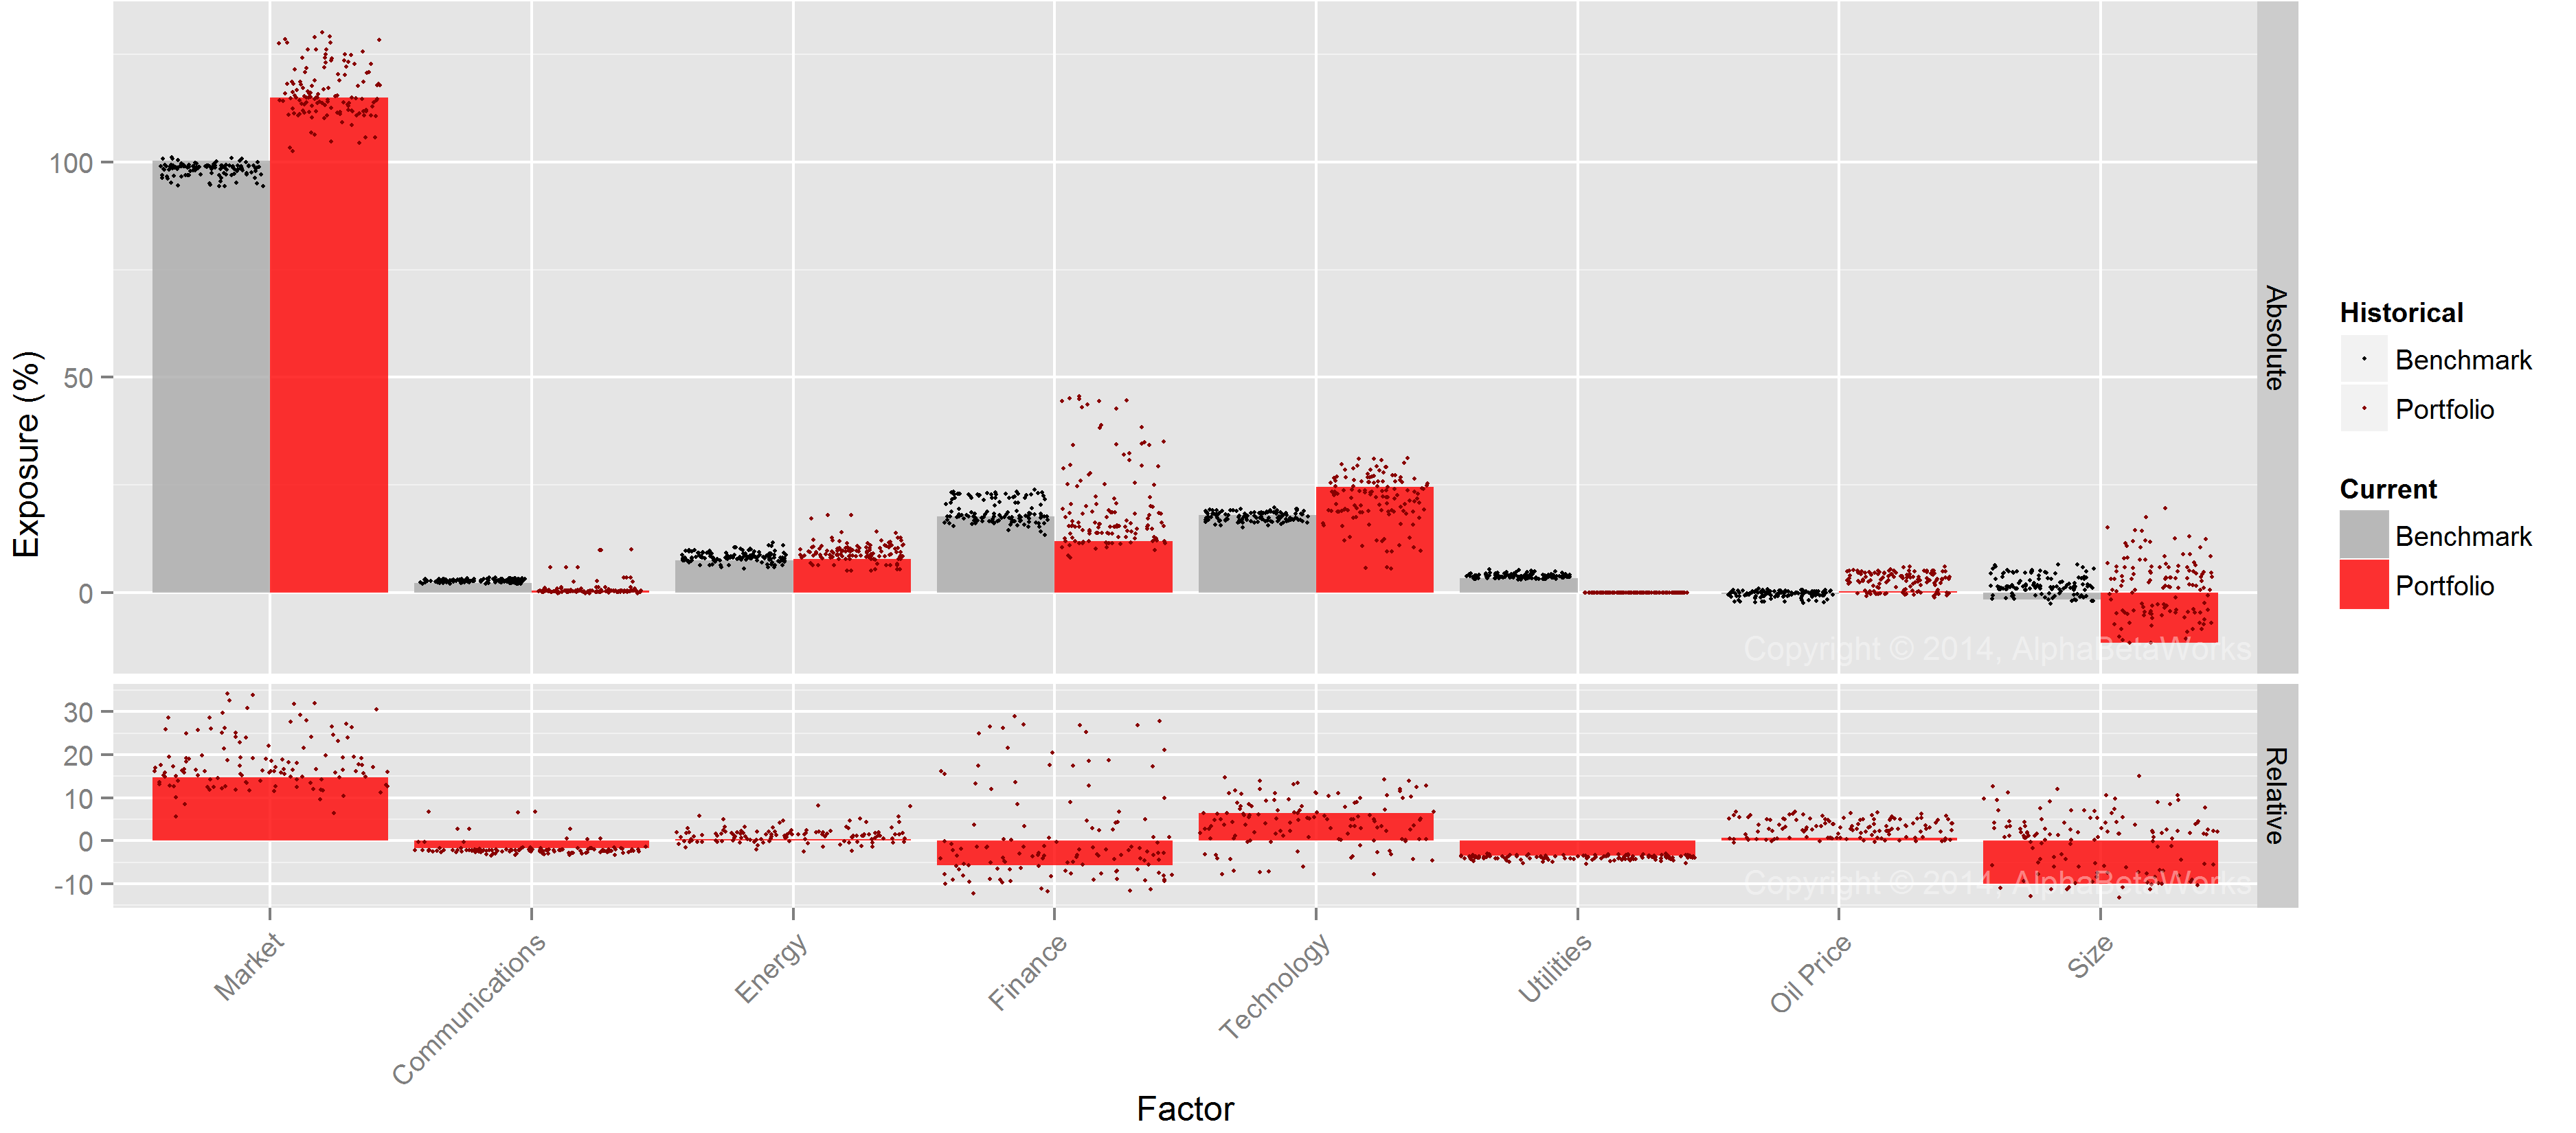
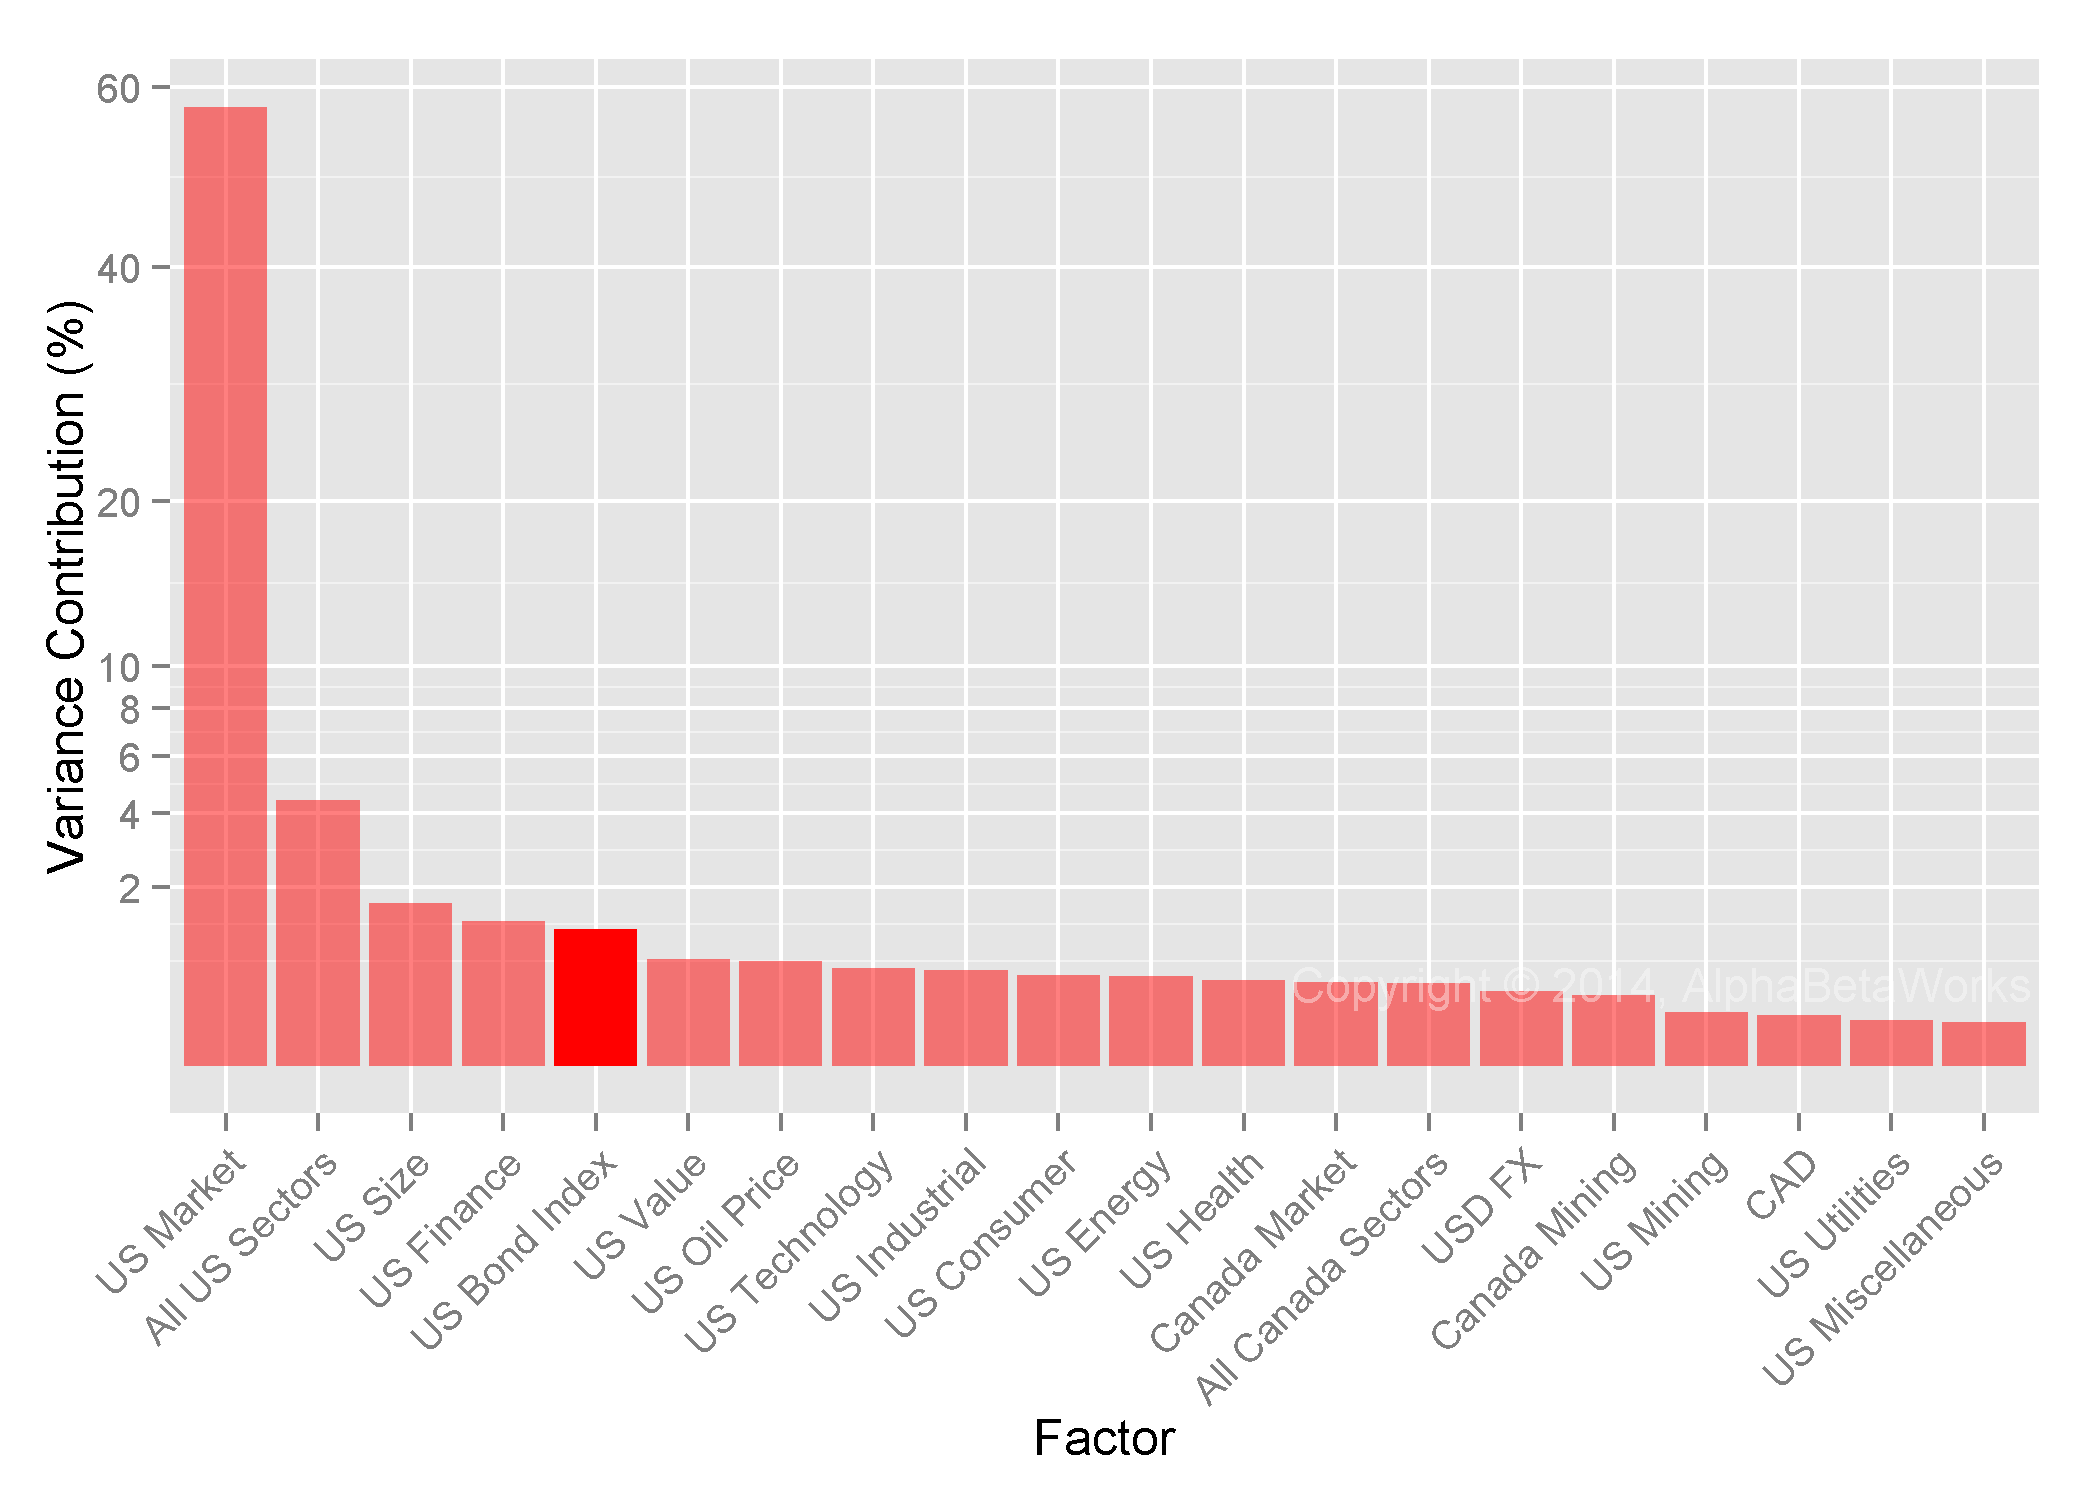
Below are HF Aggregate’s (red) most significant factor exposures relative to the U.S. Market (gray):
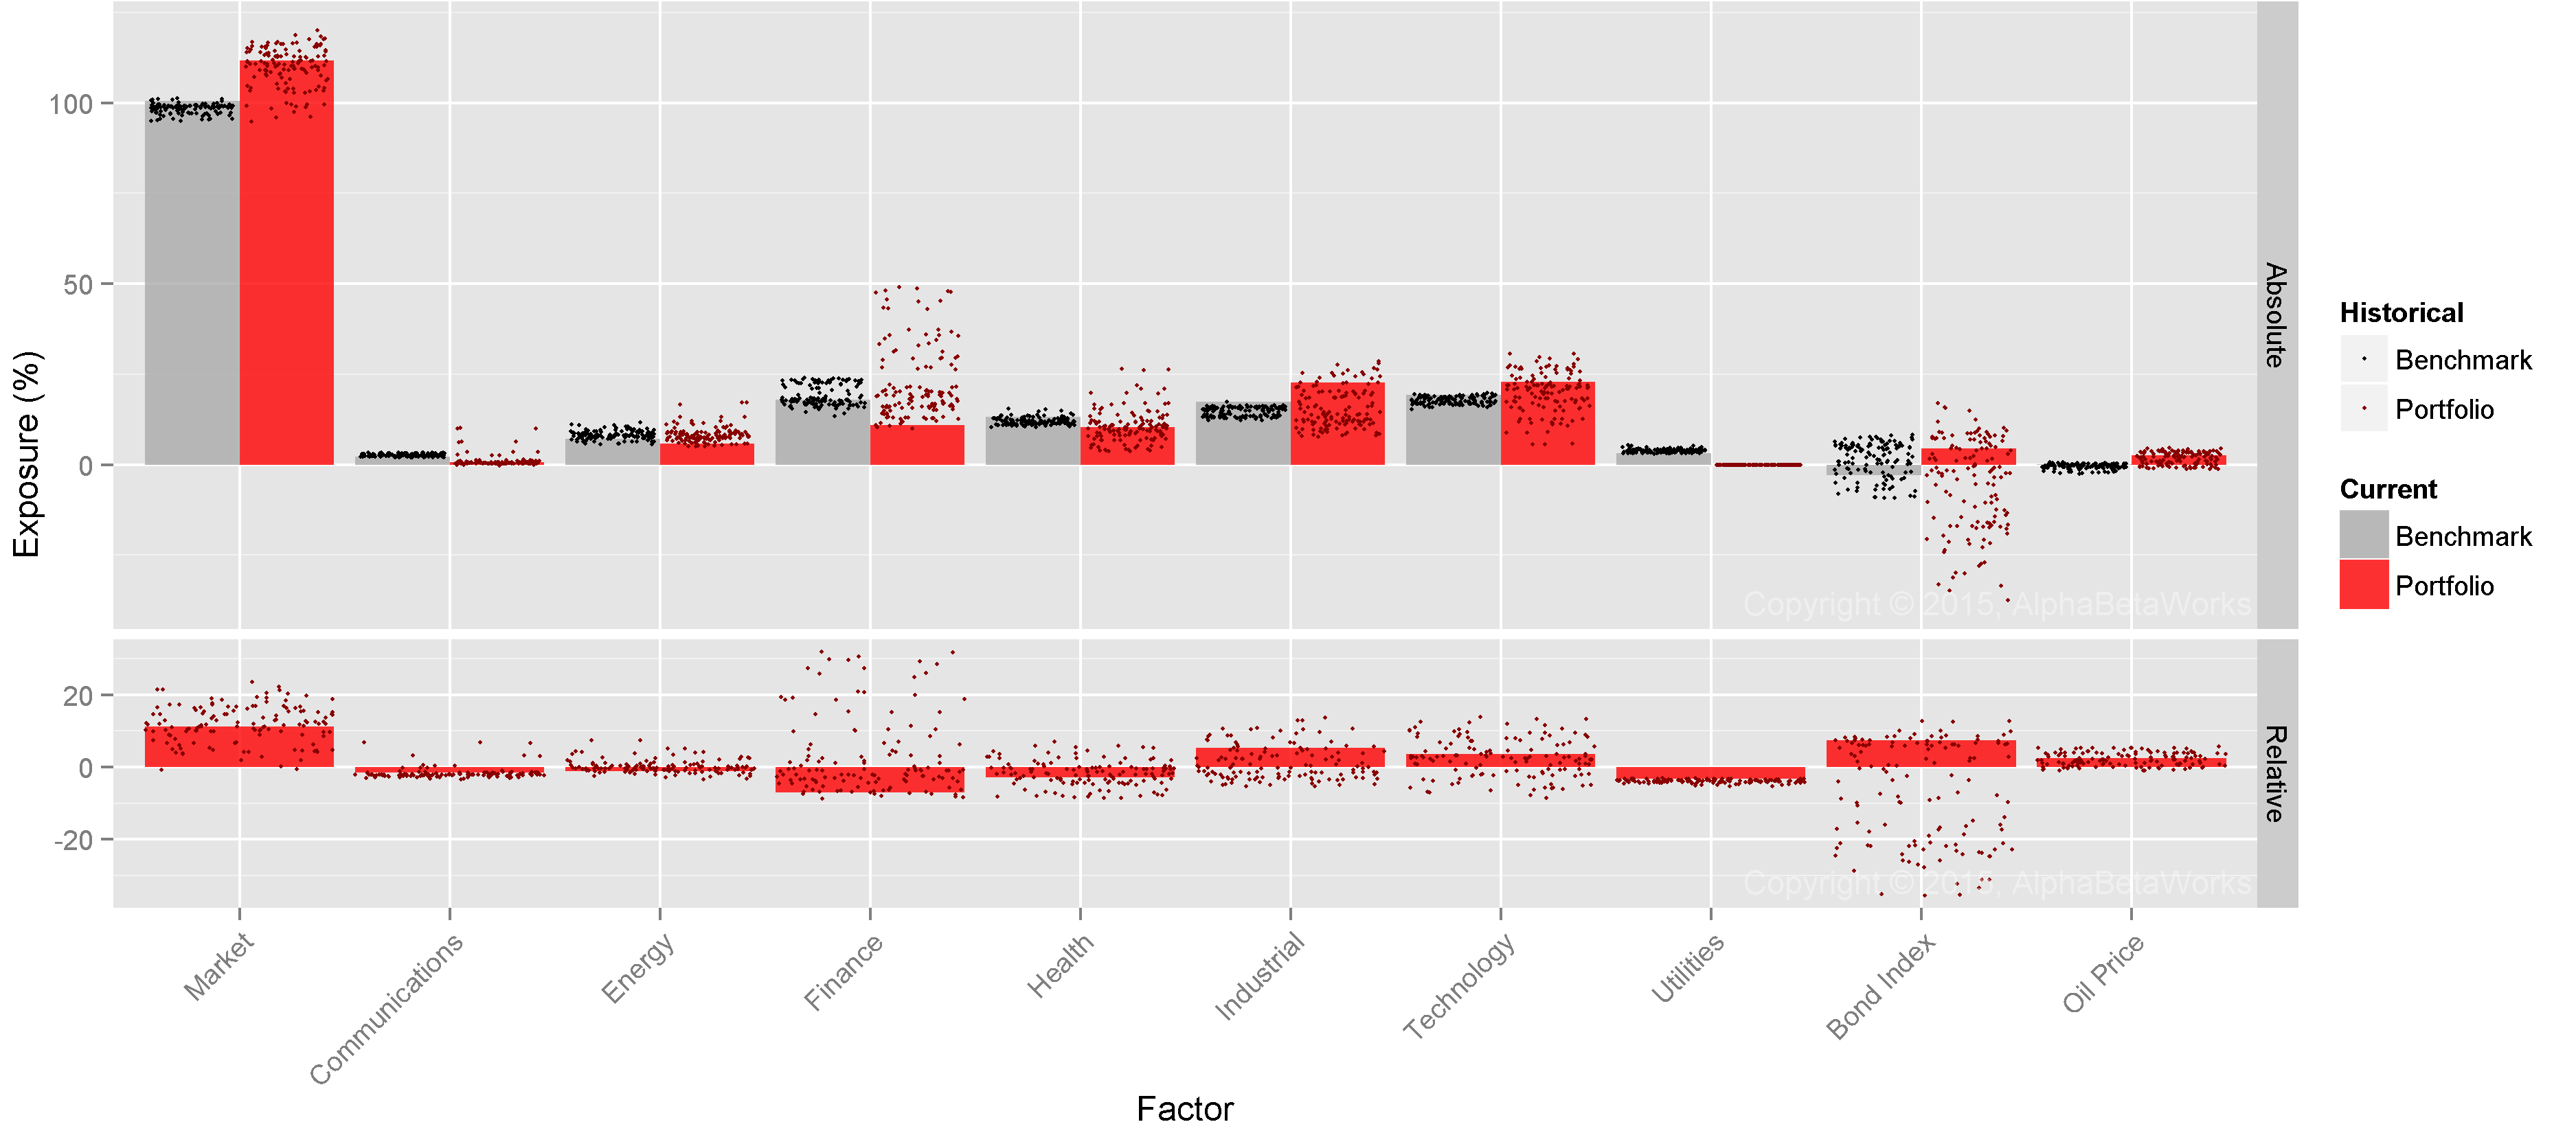
Factors Contributing Most to the Relative Risk for U.S. Hedge Fund Aggregate
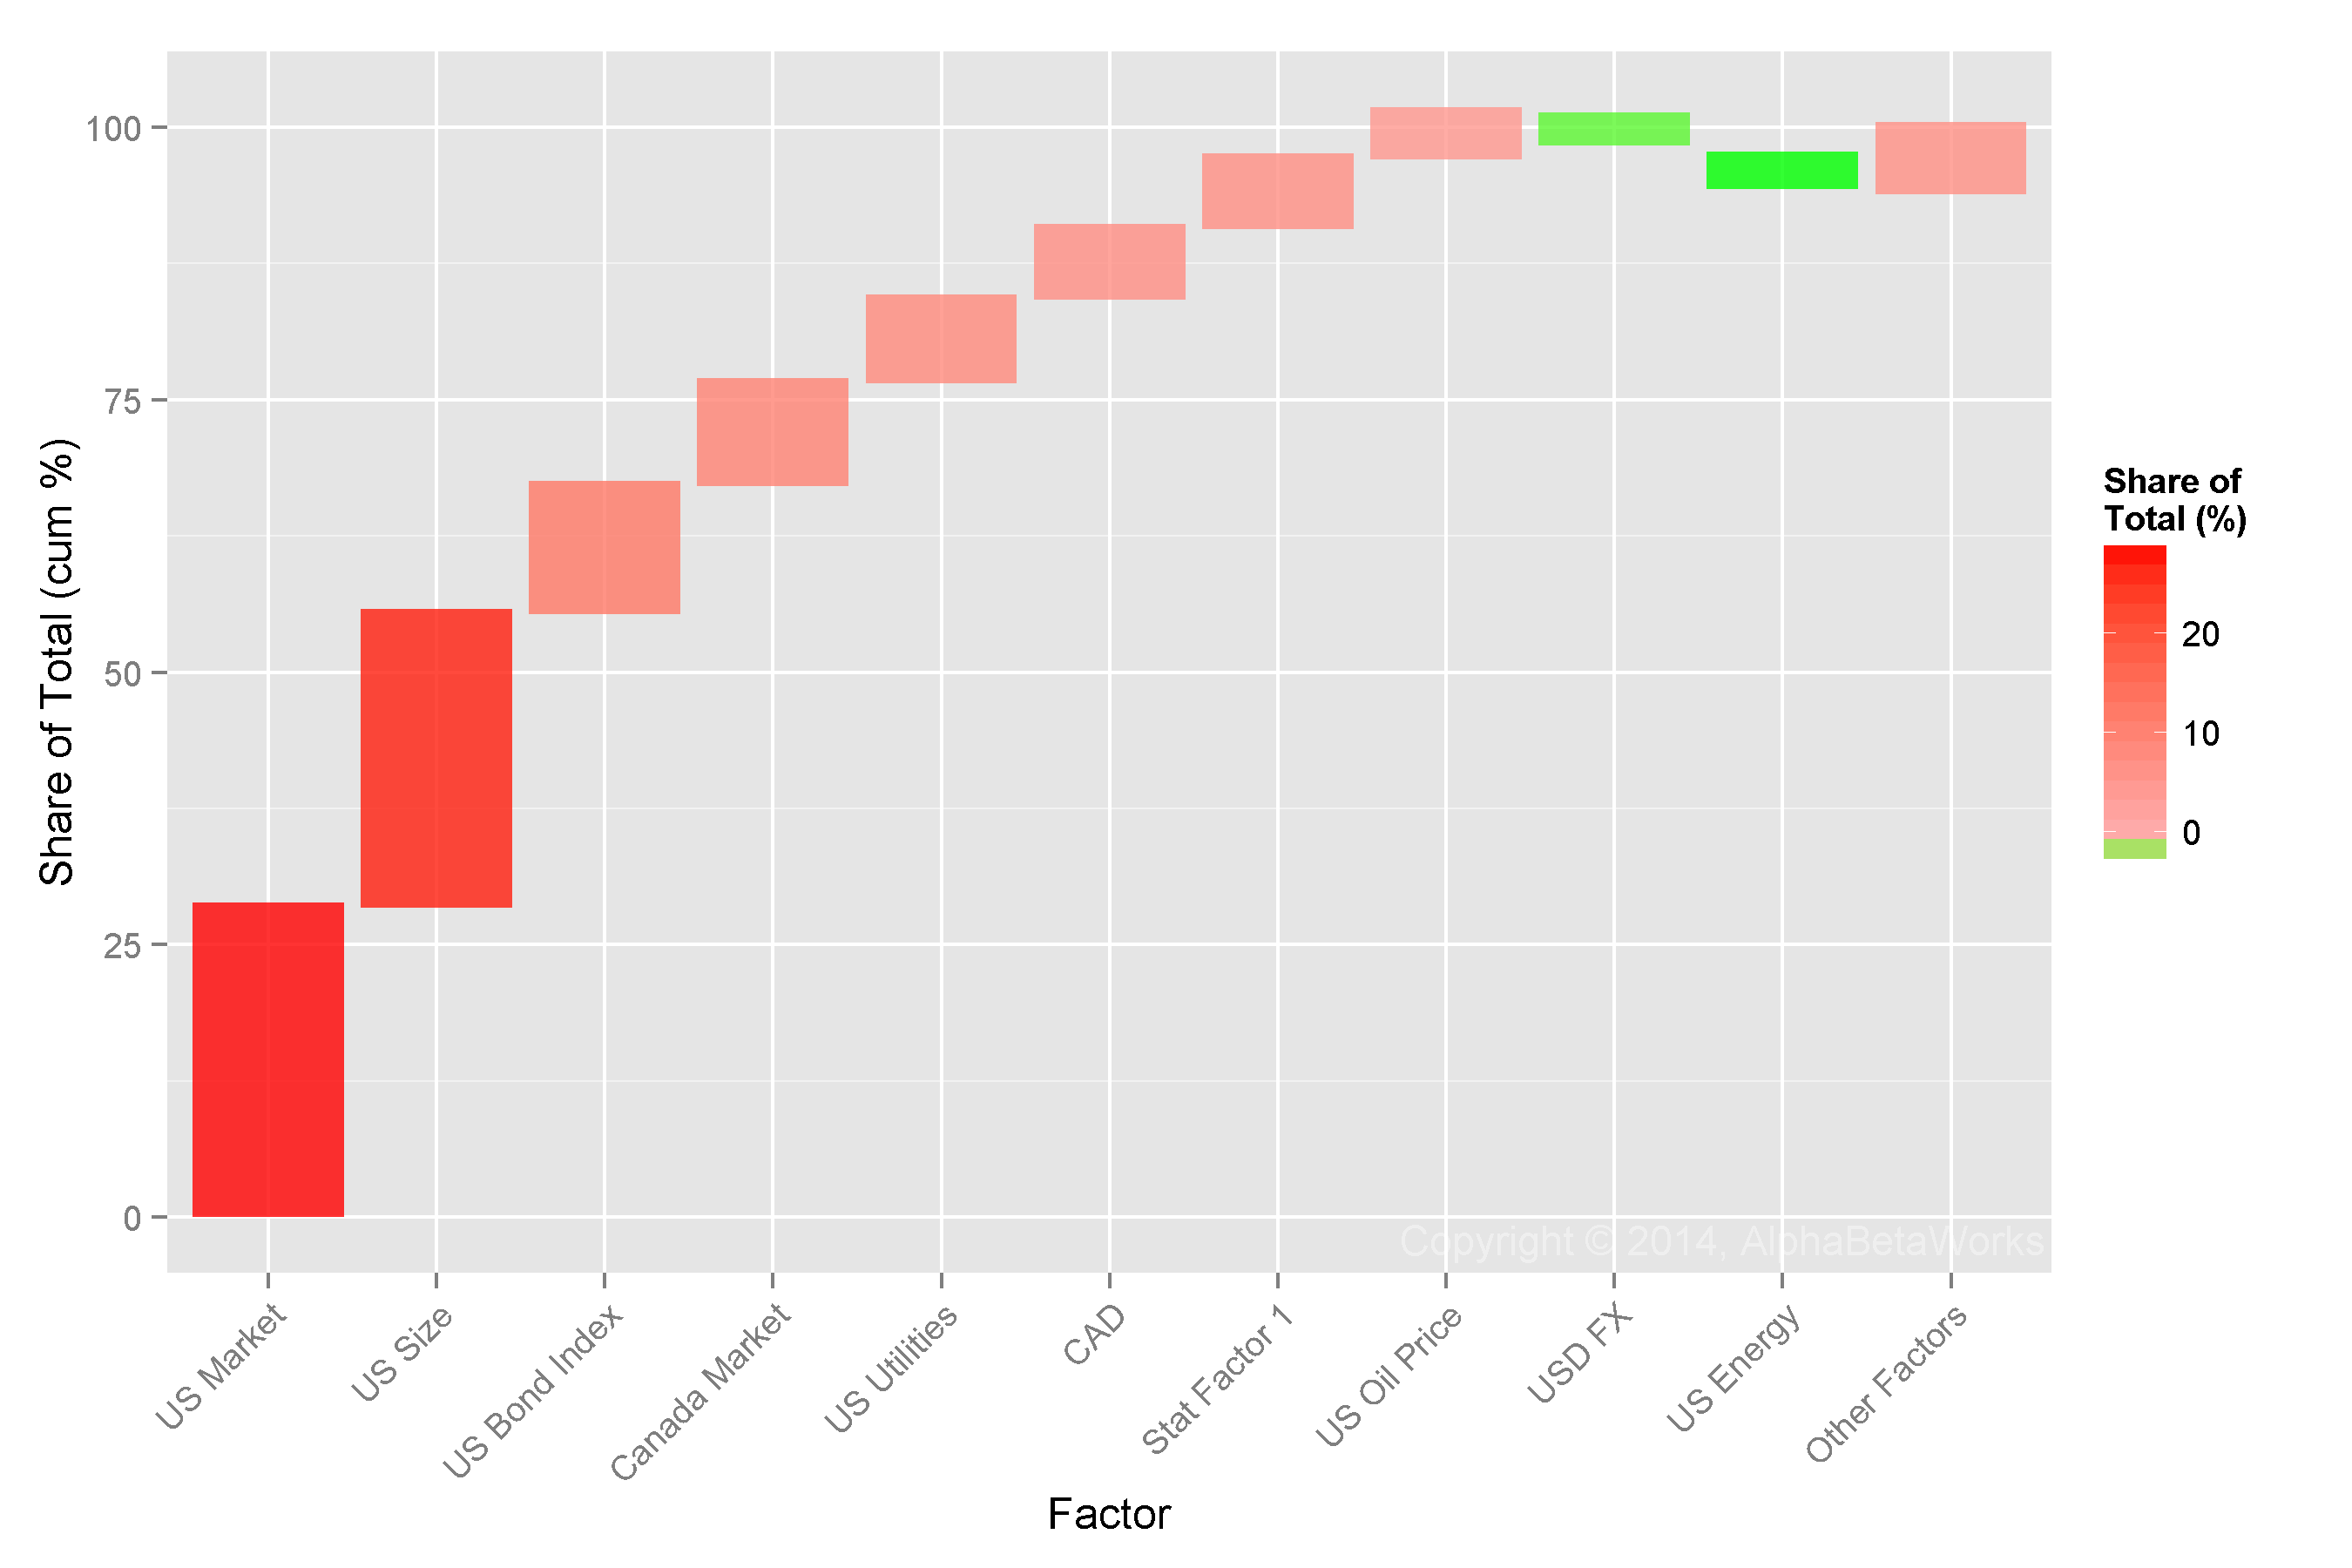
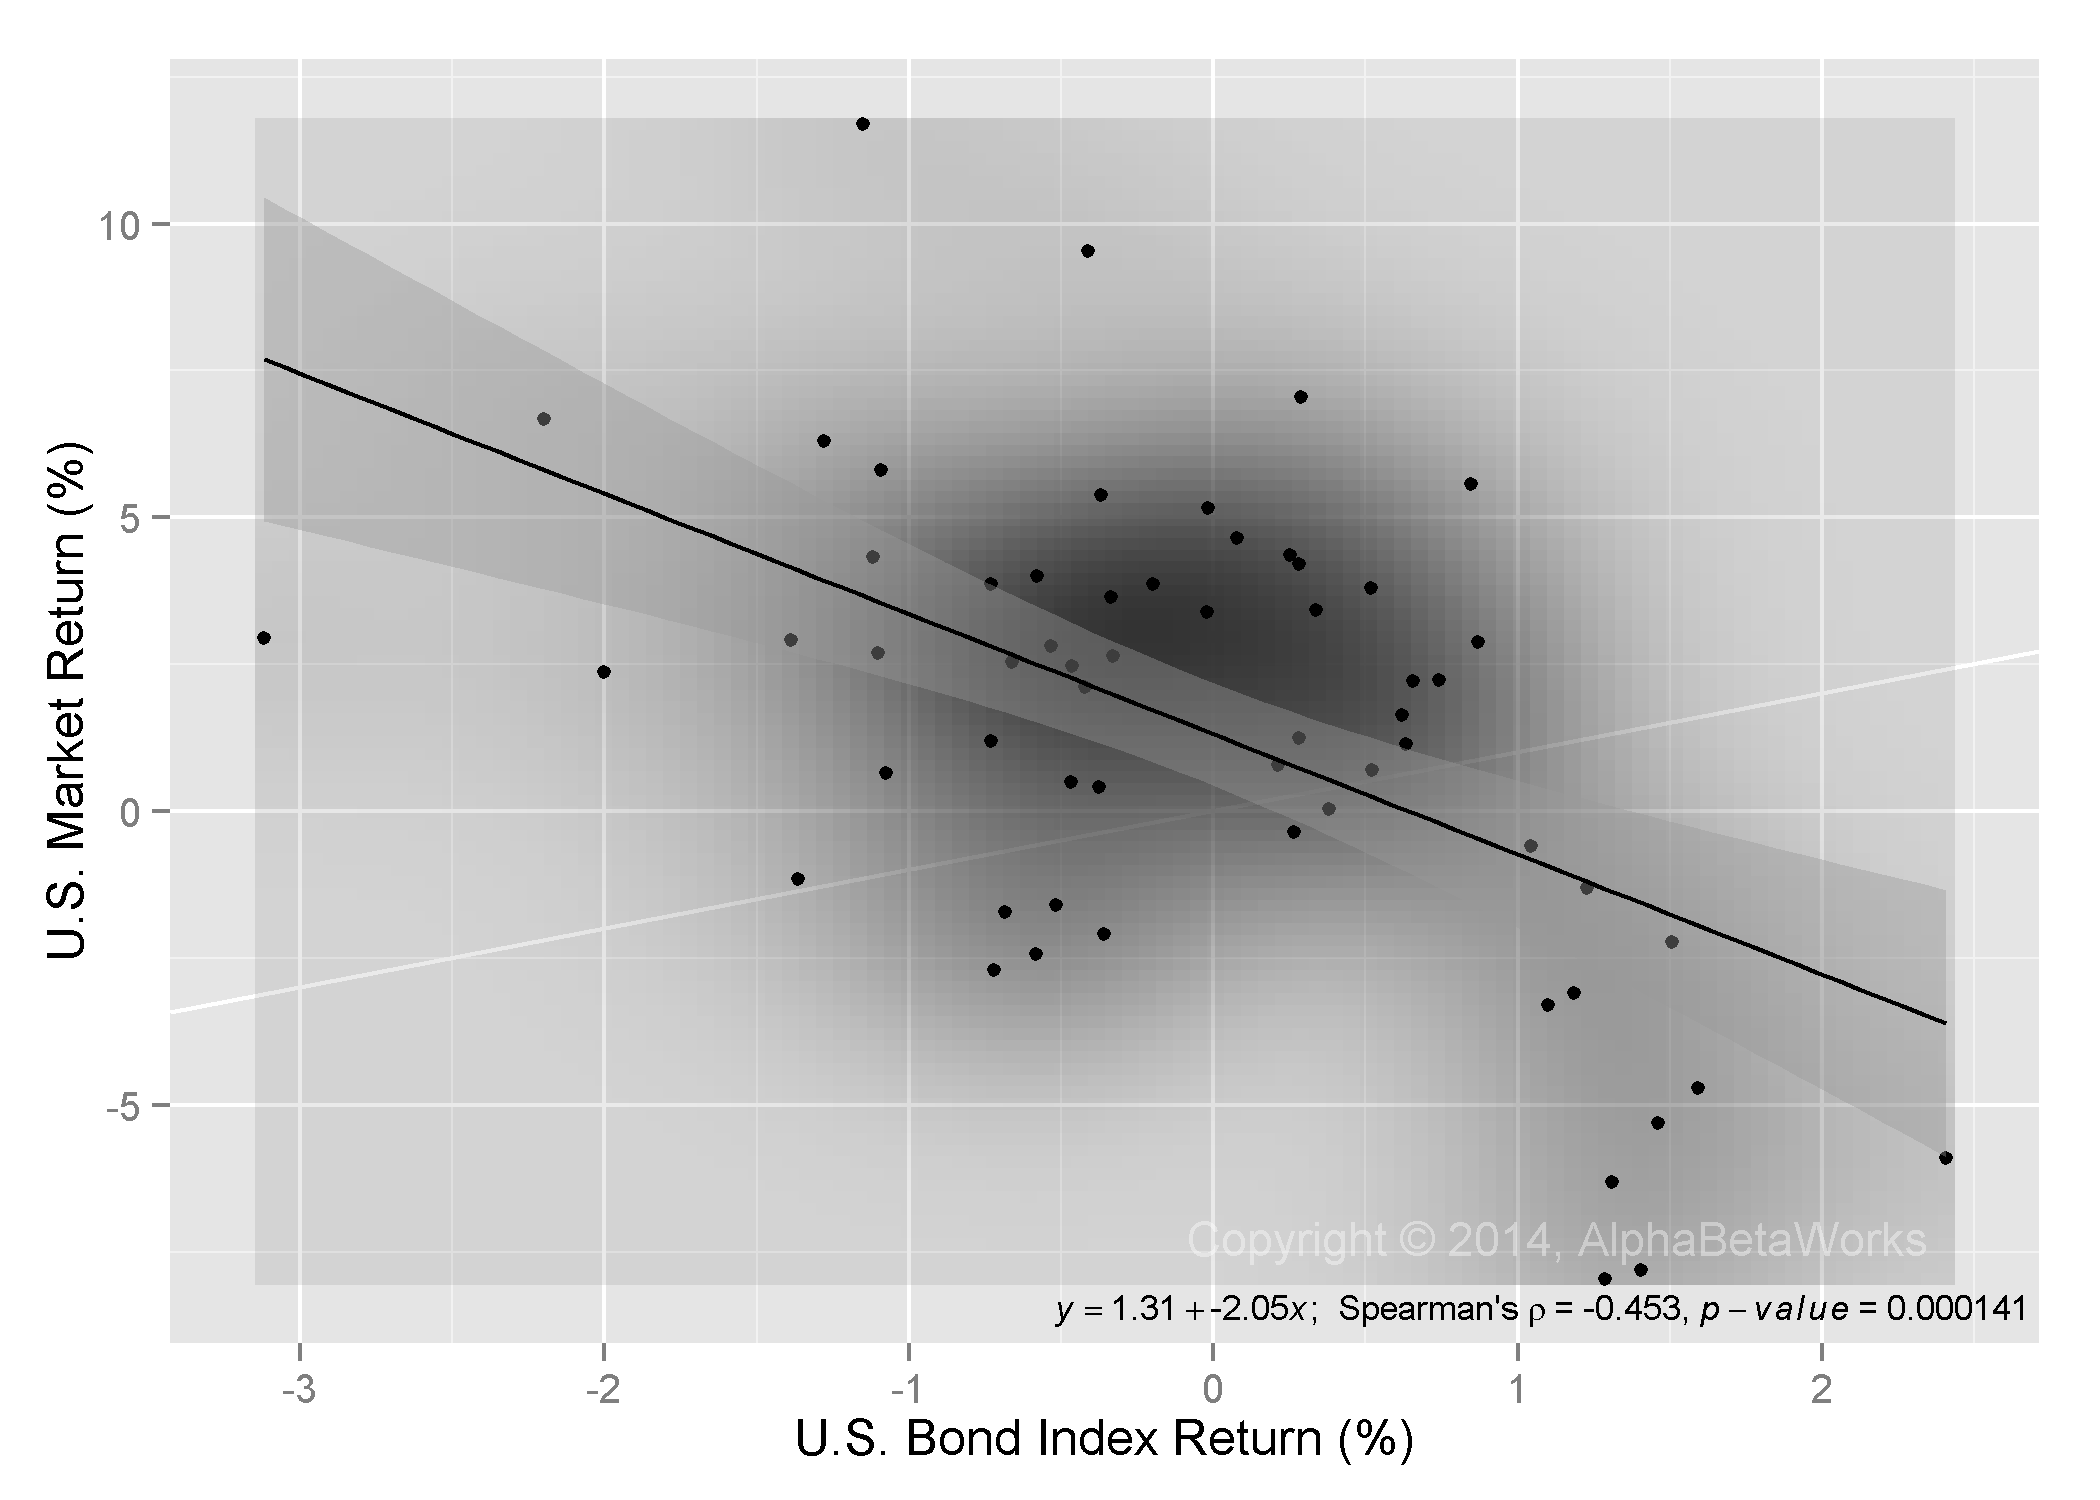
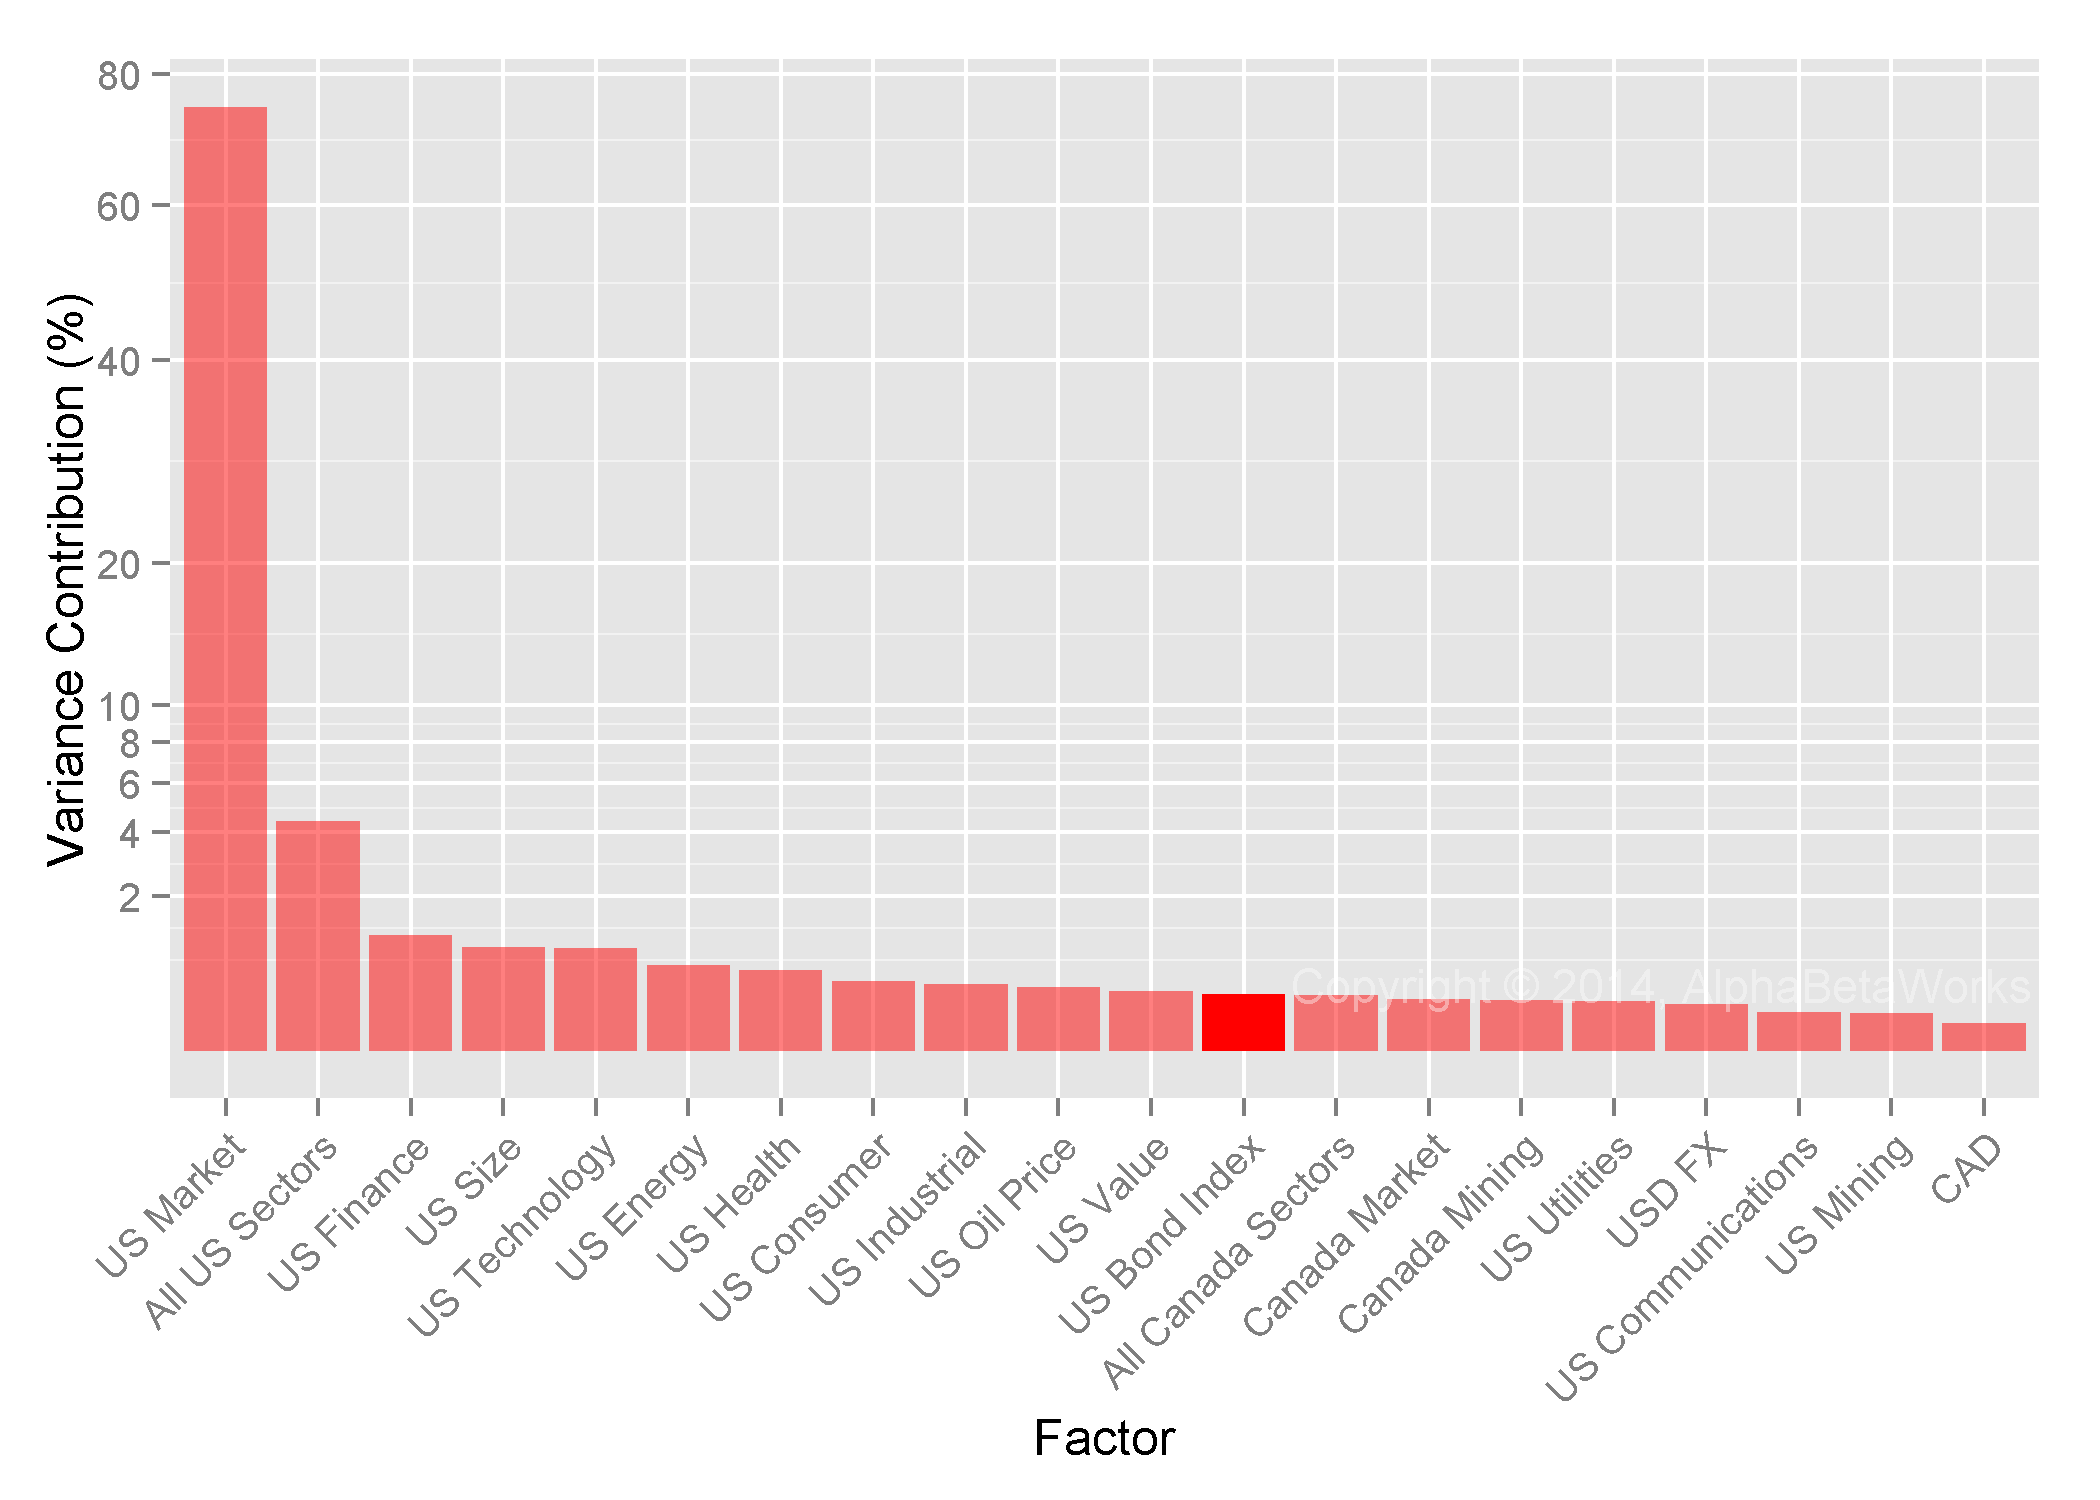
We now consider the sources of HF Aggregate’s factor (systematic) variance relative to the U.S. Market. These are the components of the Factor Volatility in the above table. Market (higher beta) and Oil bets are responsible for over 80% of the factor risk relative to the U.S. Market:
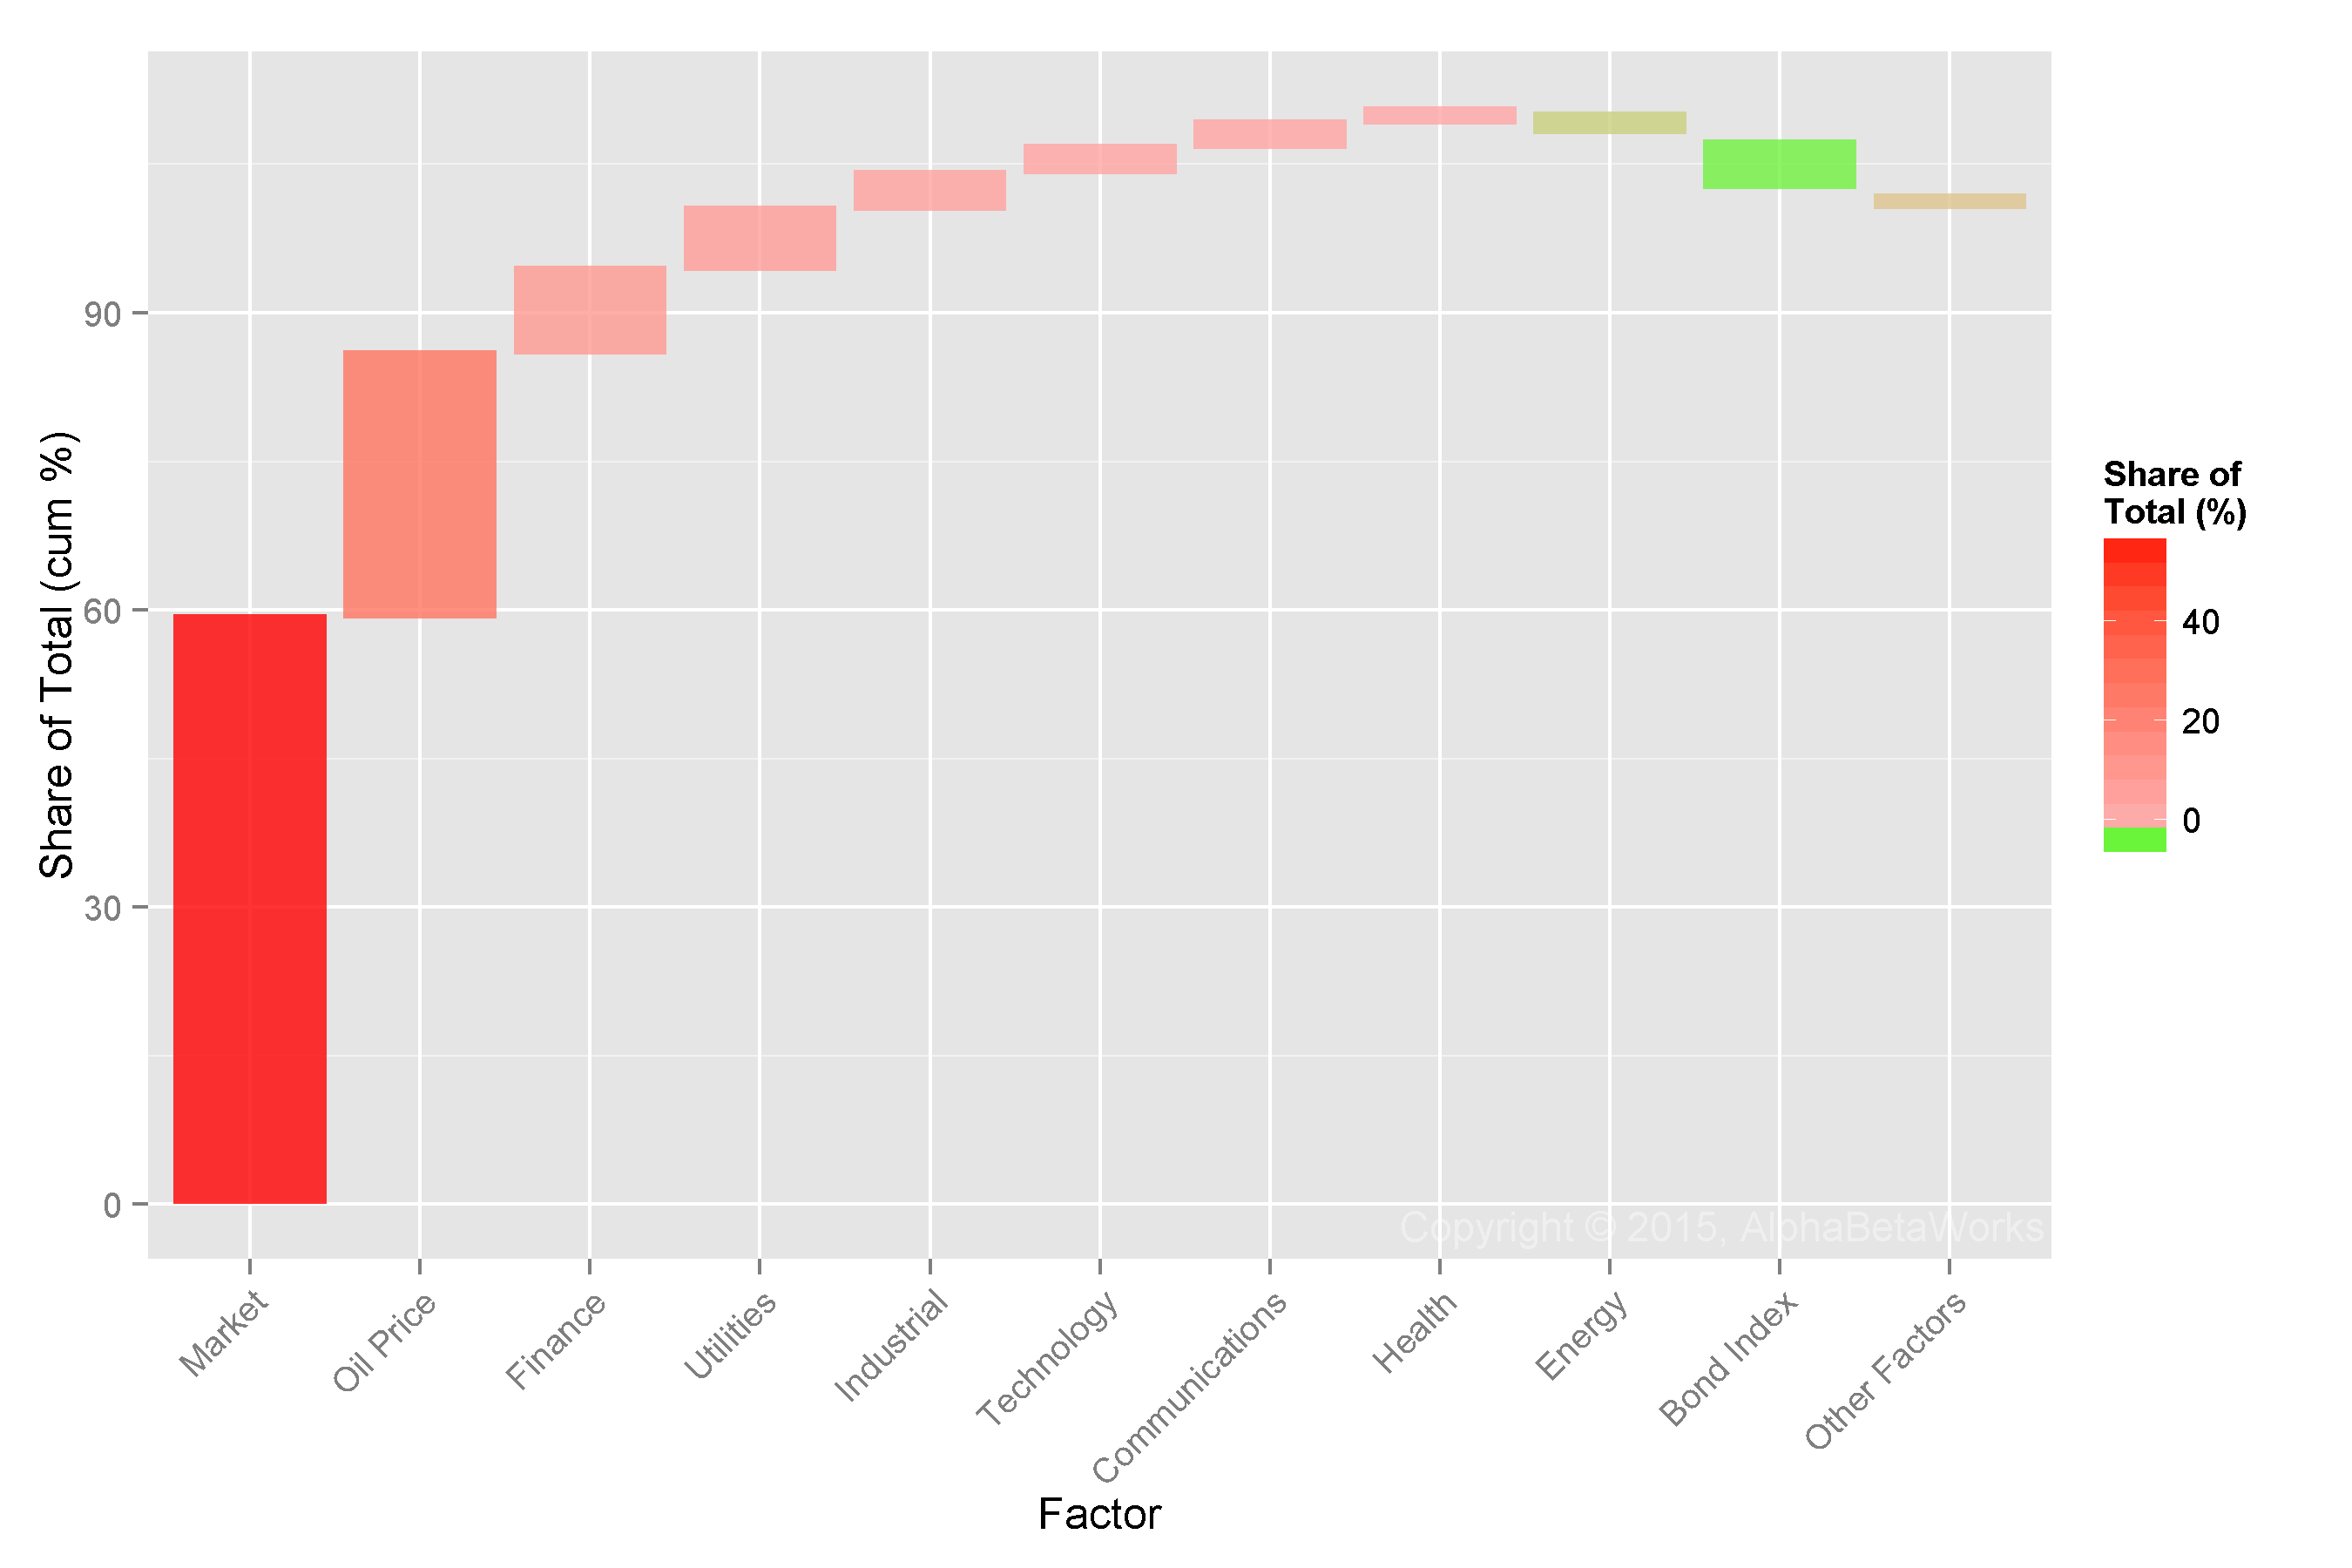
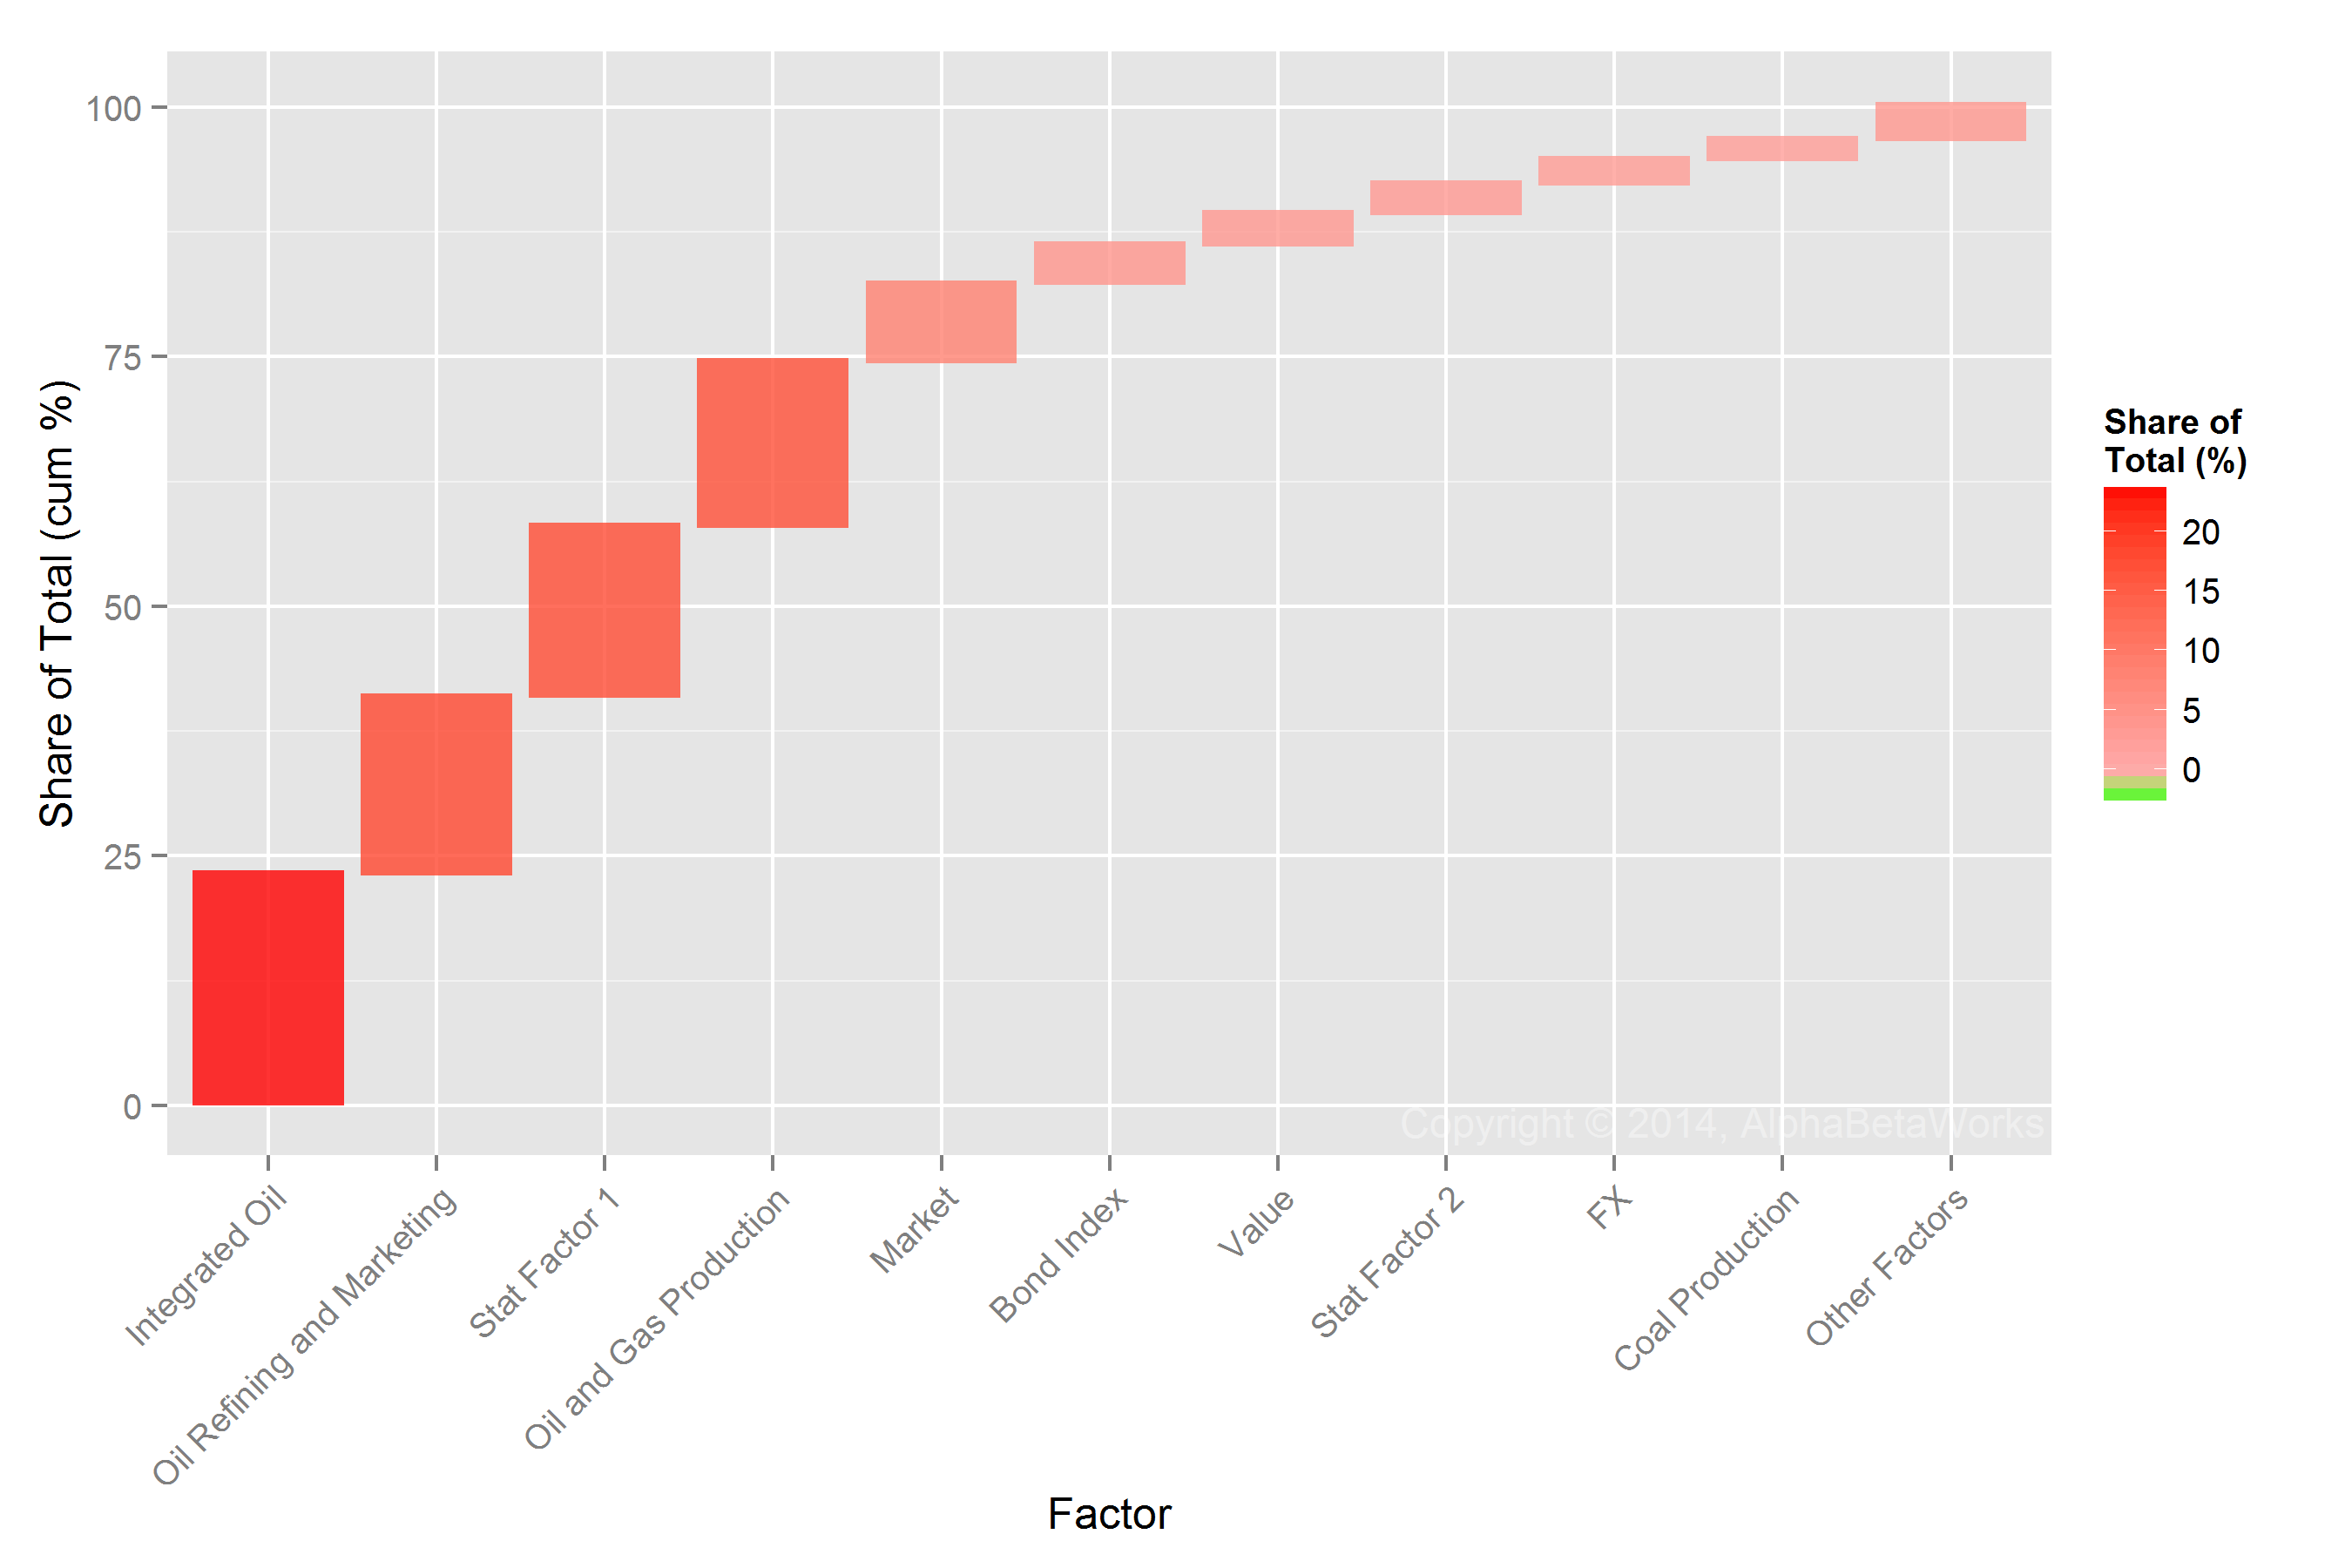
Factors Contributing Most to Relative Factor Variance of U.S. Hedge Fund Aggregate
The HF Aggregate has become considerably more systematically crowded since Q2 2014: The following factors are the top contributors to the Q3 2014 relative systematic risk:
| Factor | HF Relative Exposure (%) | Portfolio Variance (%²) | Share of Systematic Variance (%) |
| Market | 11.23 | 2.34 | 59.10 |
| Oil Price | 2.52 | 1.05 | 26.66 |
| Finance | -7.04 | 0.33 | 8.46 |
| Utilities | -3.19 | 0.24 | 6.11 |
| Industrial | 5.27 | 0.14 | 3.64 |
| Other Factors | -0.14 | -3.97 | |
| Total | 3.96 | 100.00 |
The following were the top contributors to the Q2 2014 relative systematic risk:
| Factor | HF Relative Exposure (%) | Portfoio Variance (%²) | Share of Systematic Variance (%) |
| Market | 14.64 | 4.01 | 65.41 |
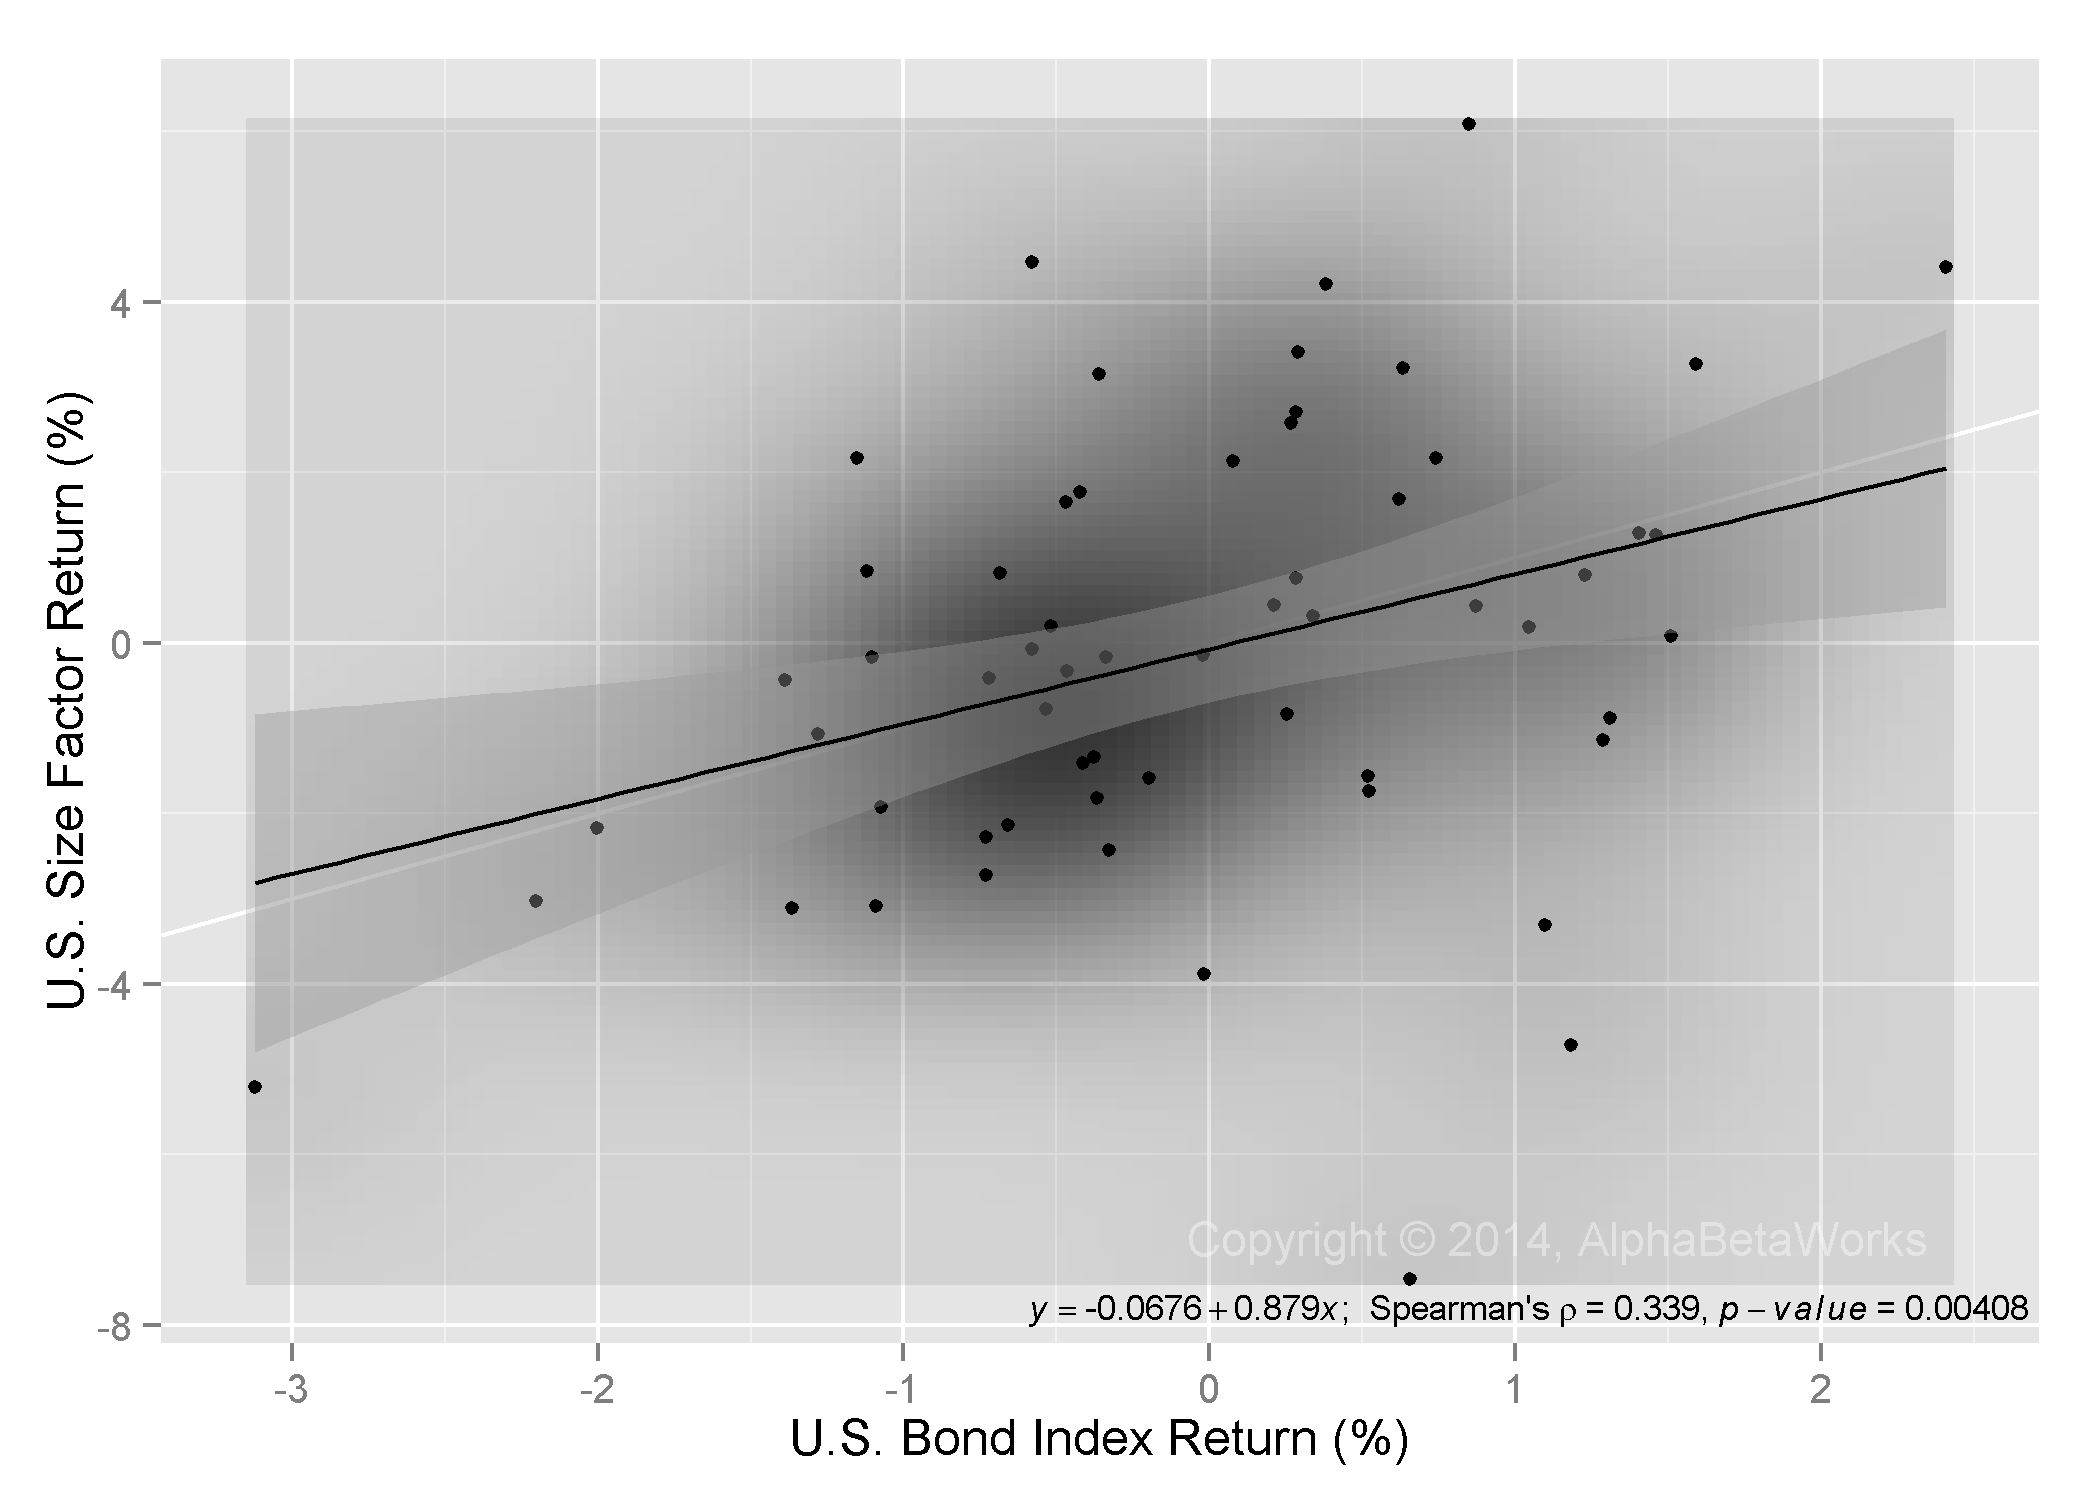
| Size | -9.93 | 0.90 | 14.61 |
| Utilities | -3.40 | 0.32 | 5.25 |
| Technology | 6.46 | 0.27 | 4.44 |
| Oil Price | 0.62 | 0.23 | 3.68 |
| Other Factors | 0.40 | 6.61 | |
| Total | 6.13 | 100.00 |
Note that, following the poor performance of this factor throughout 2014, the short Size (small-cap) bet has been liquidated. Instead, hedge funds increased their long oil exposure by almost 2%. This crowded long oil bet has been another costly mistake.
Hedge Fund Residual (Idiosyncratic) Crowding
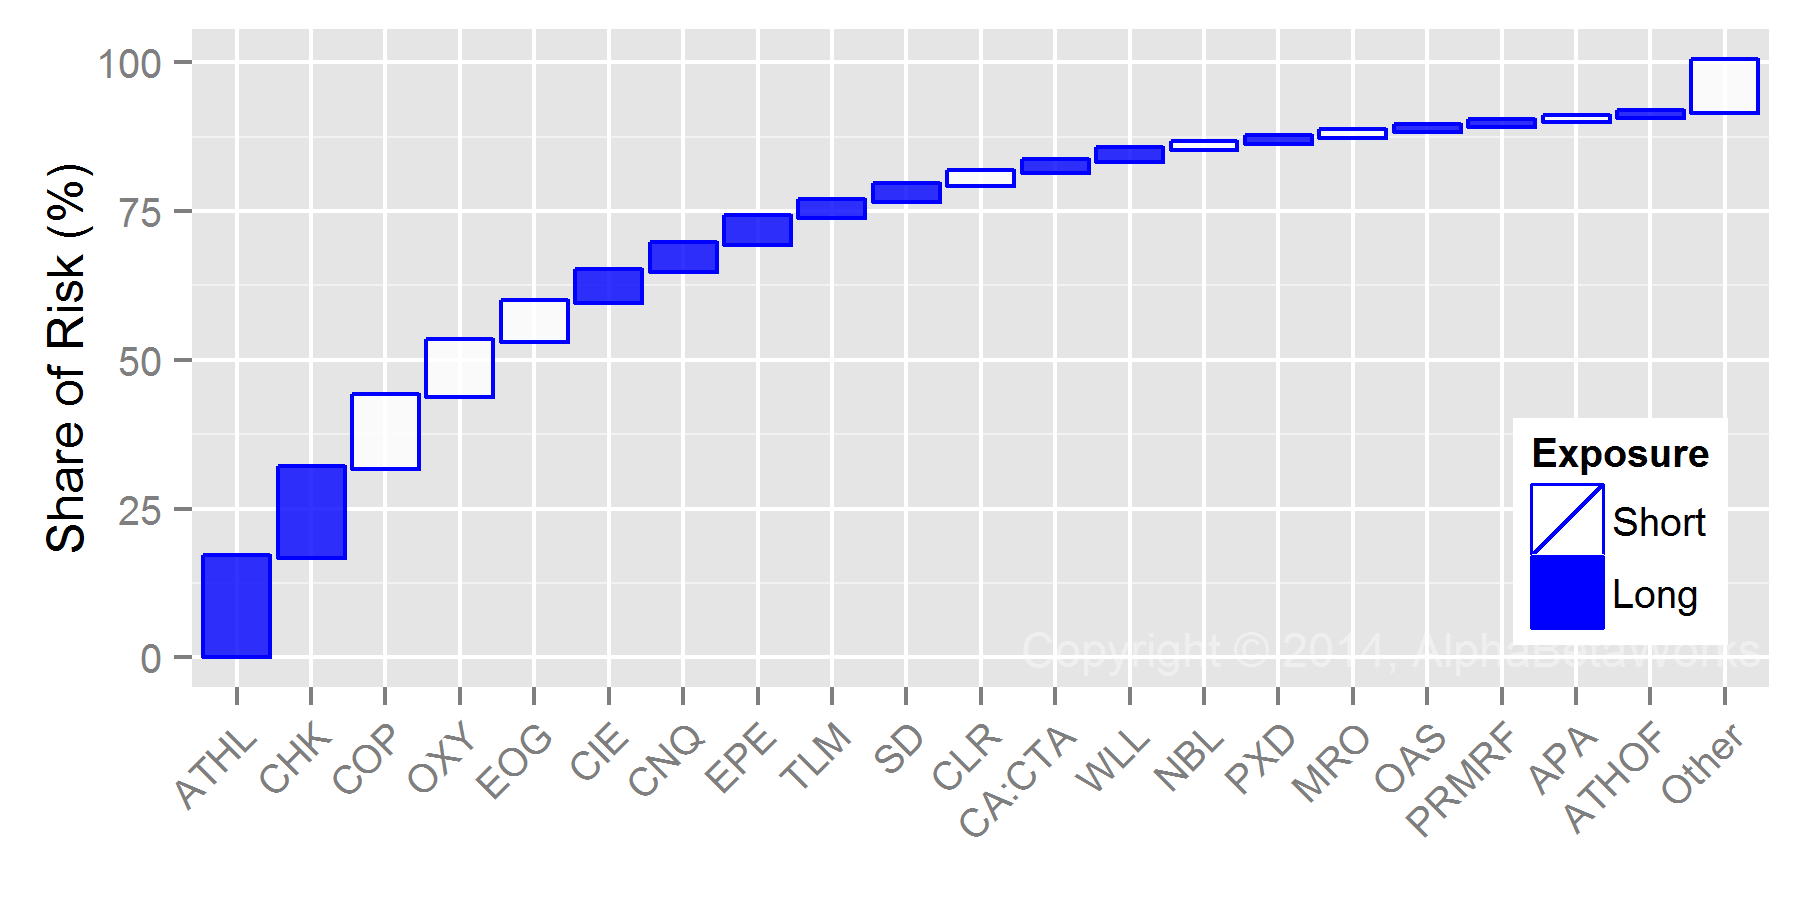
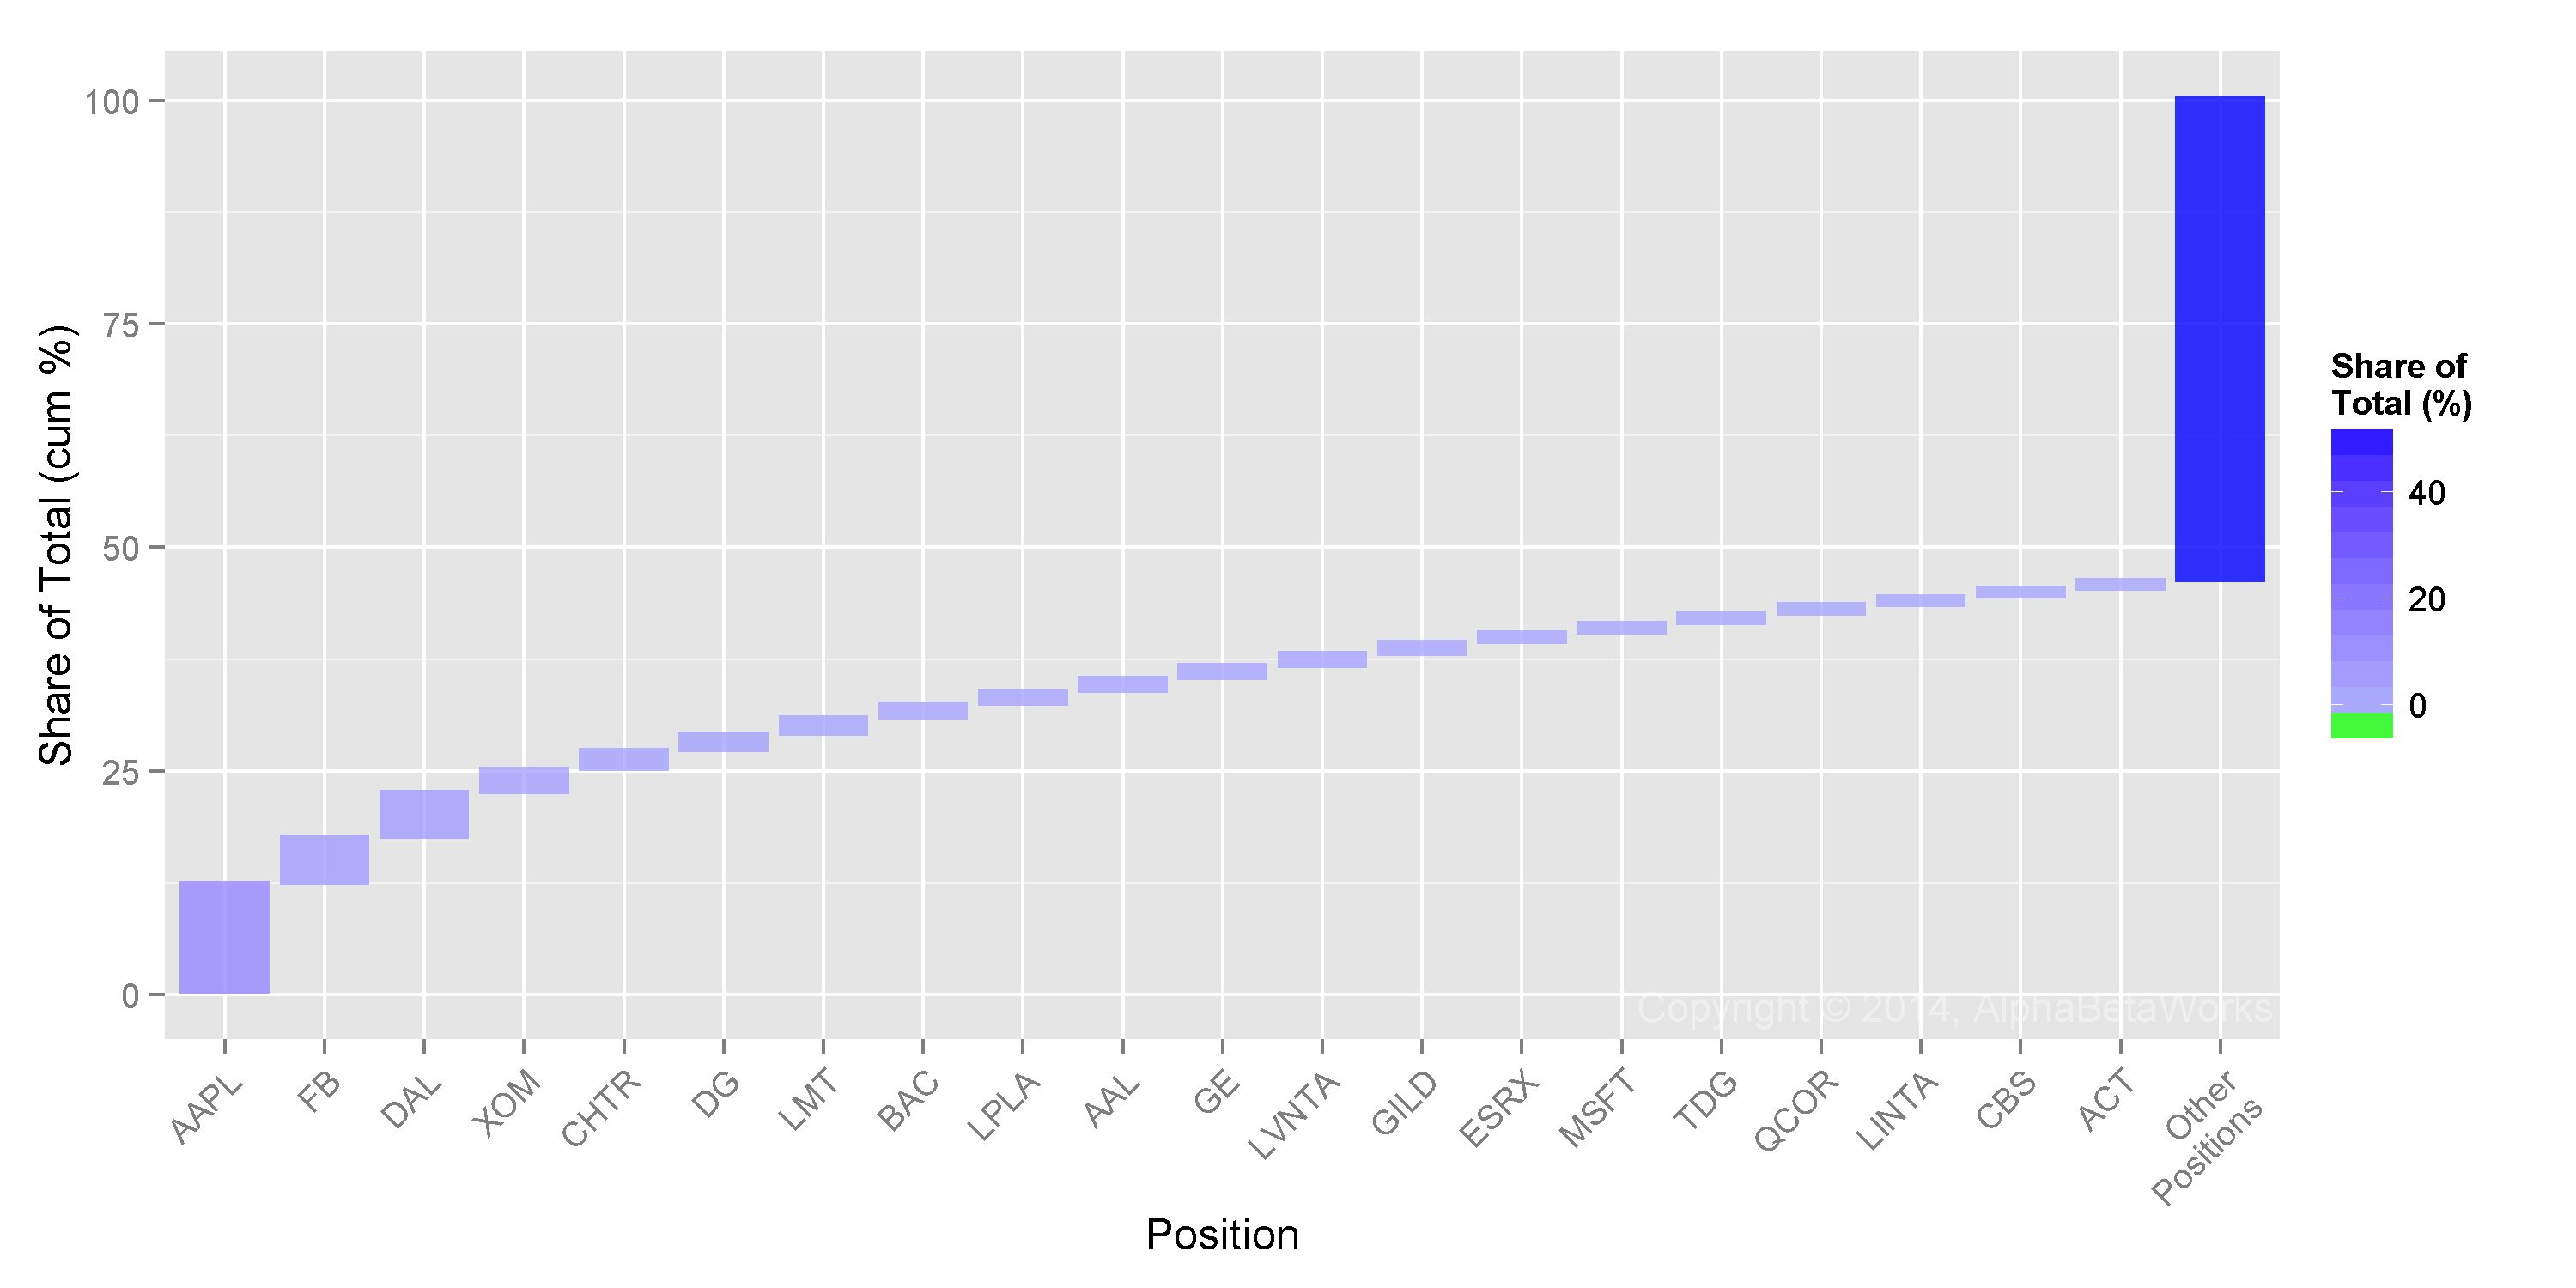
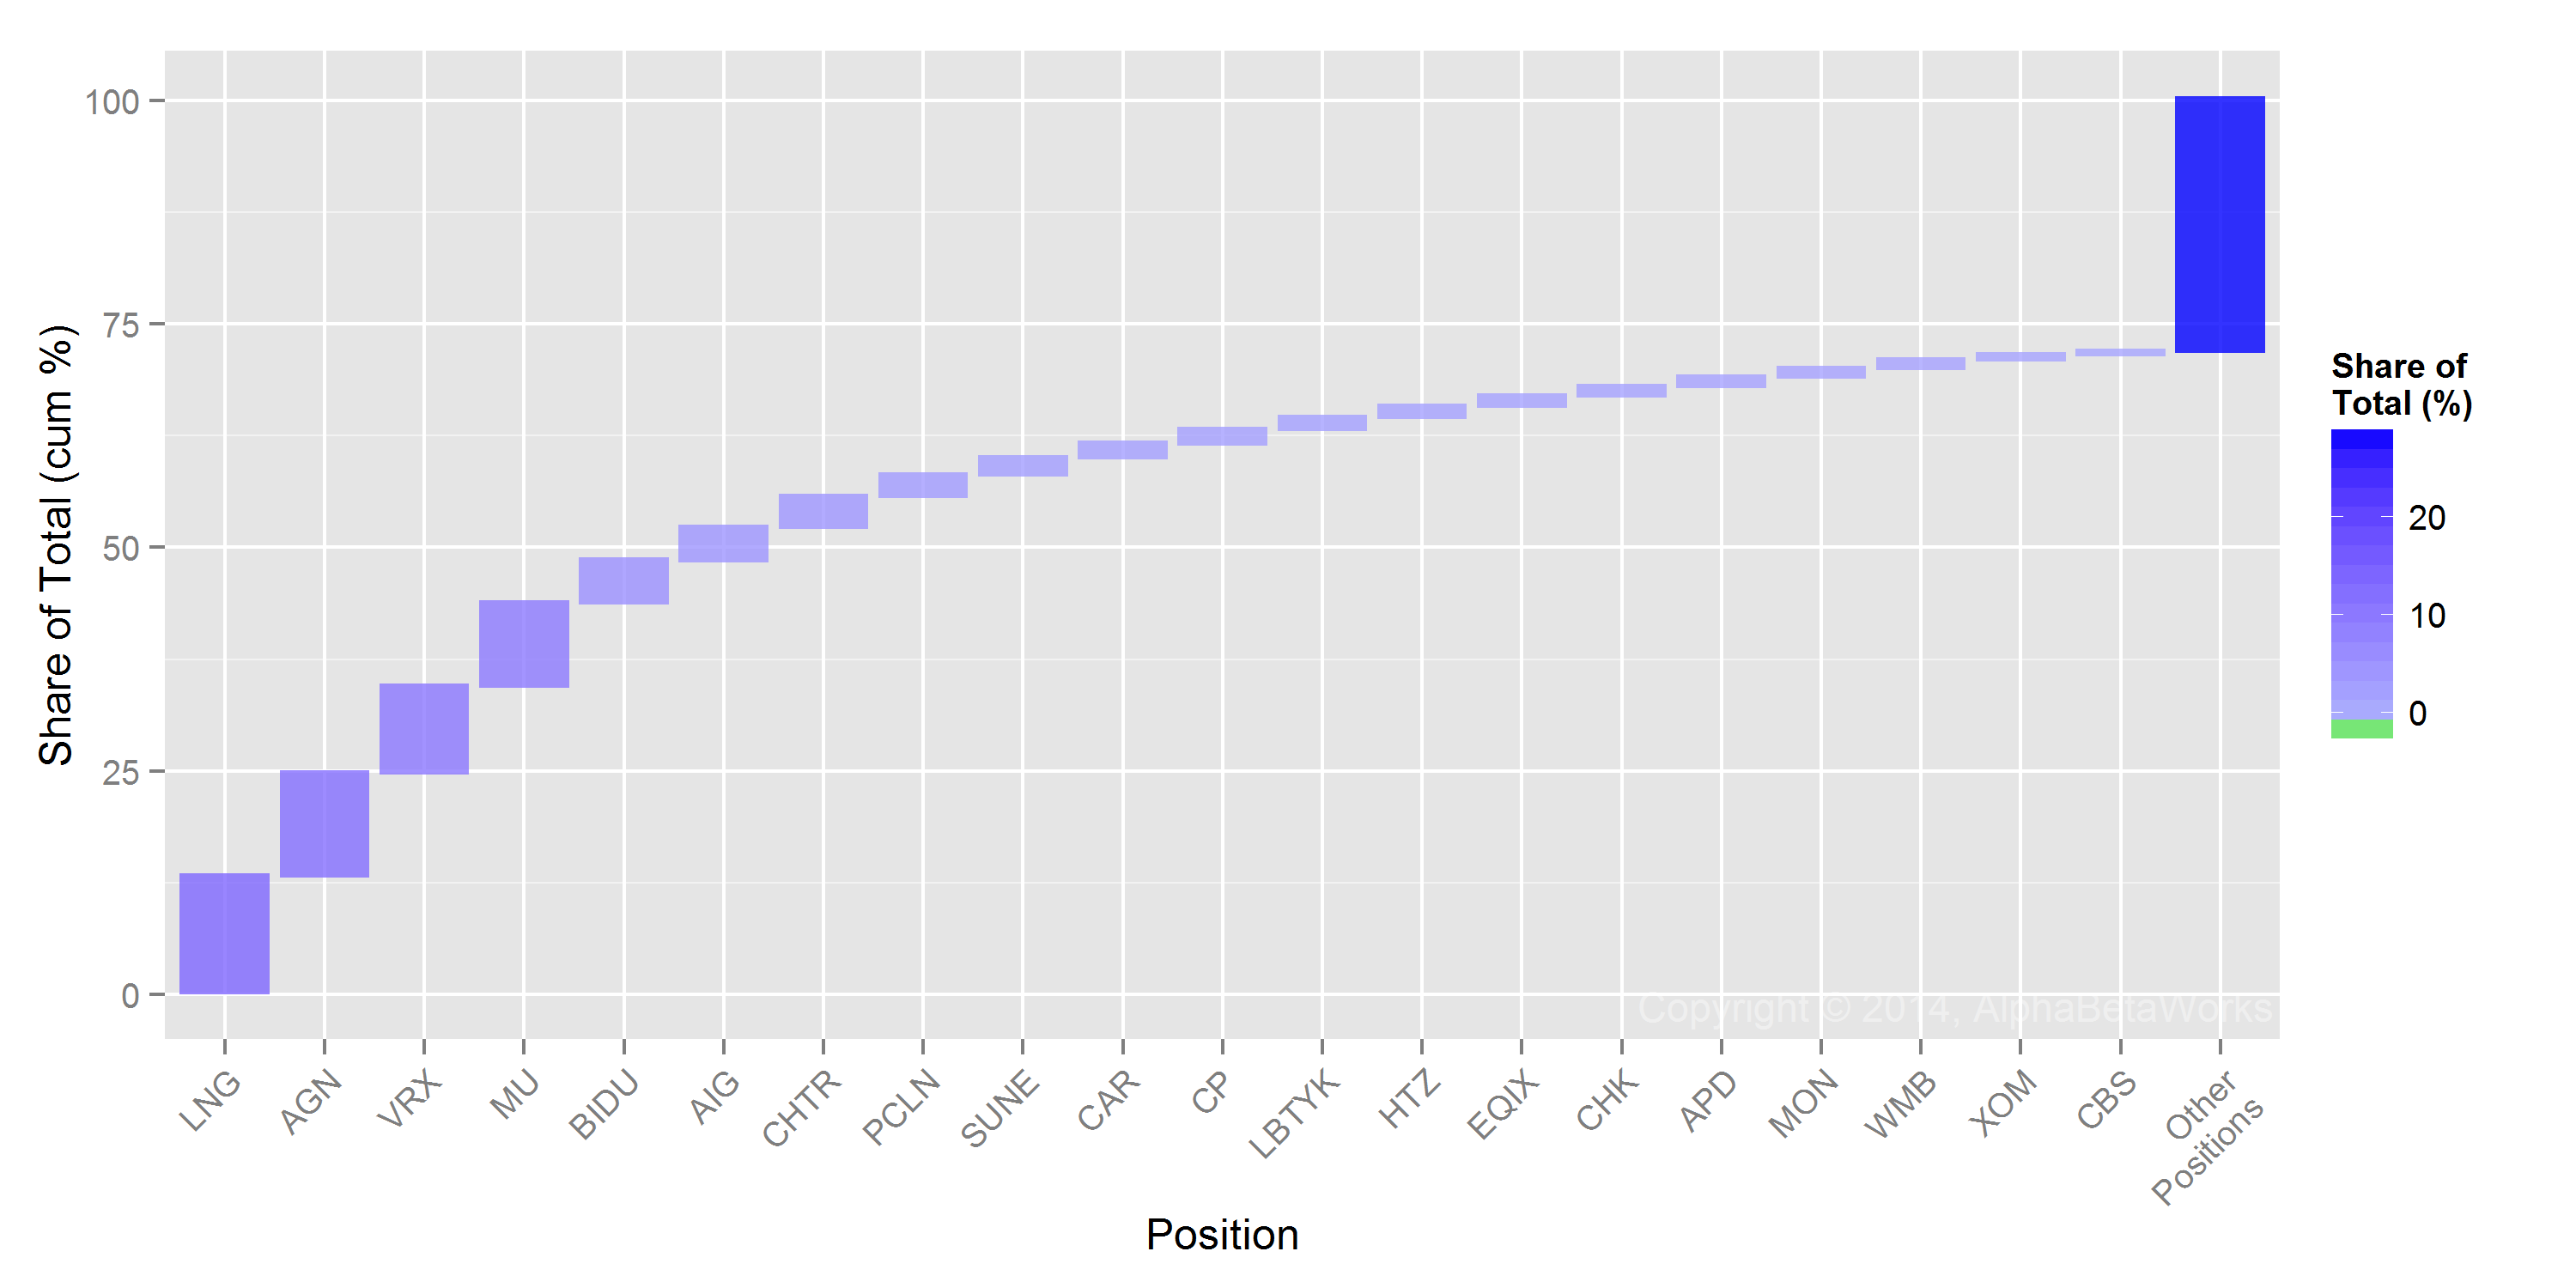
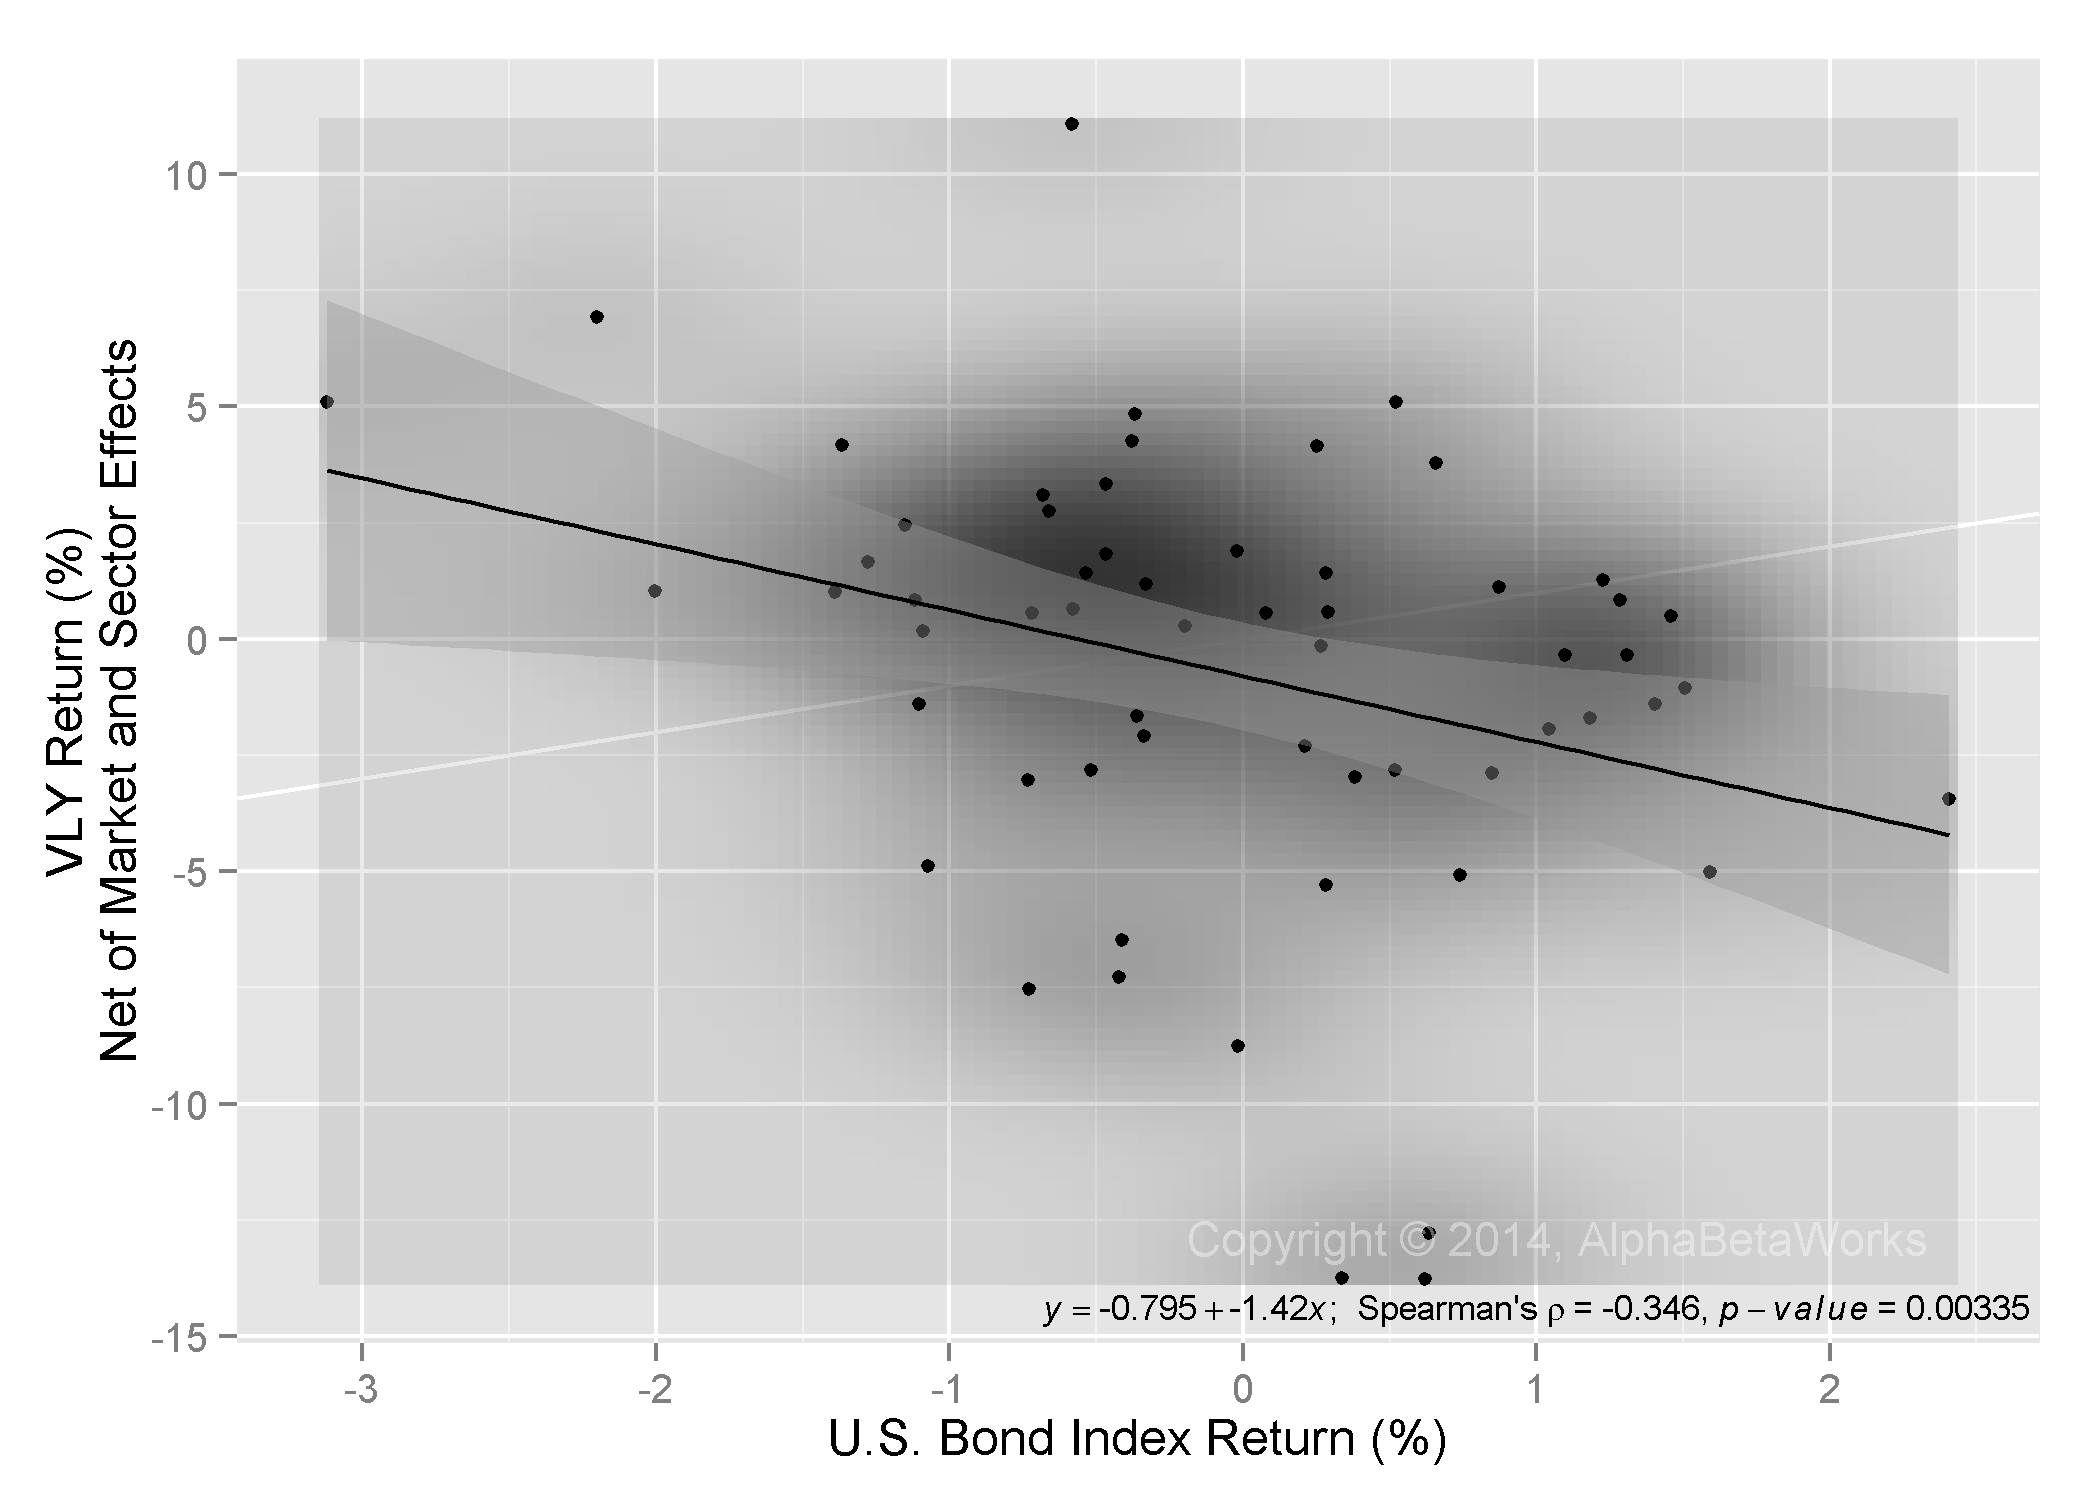
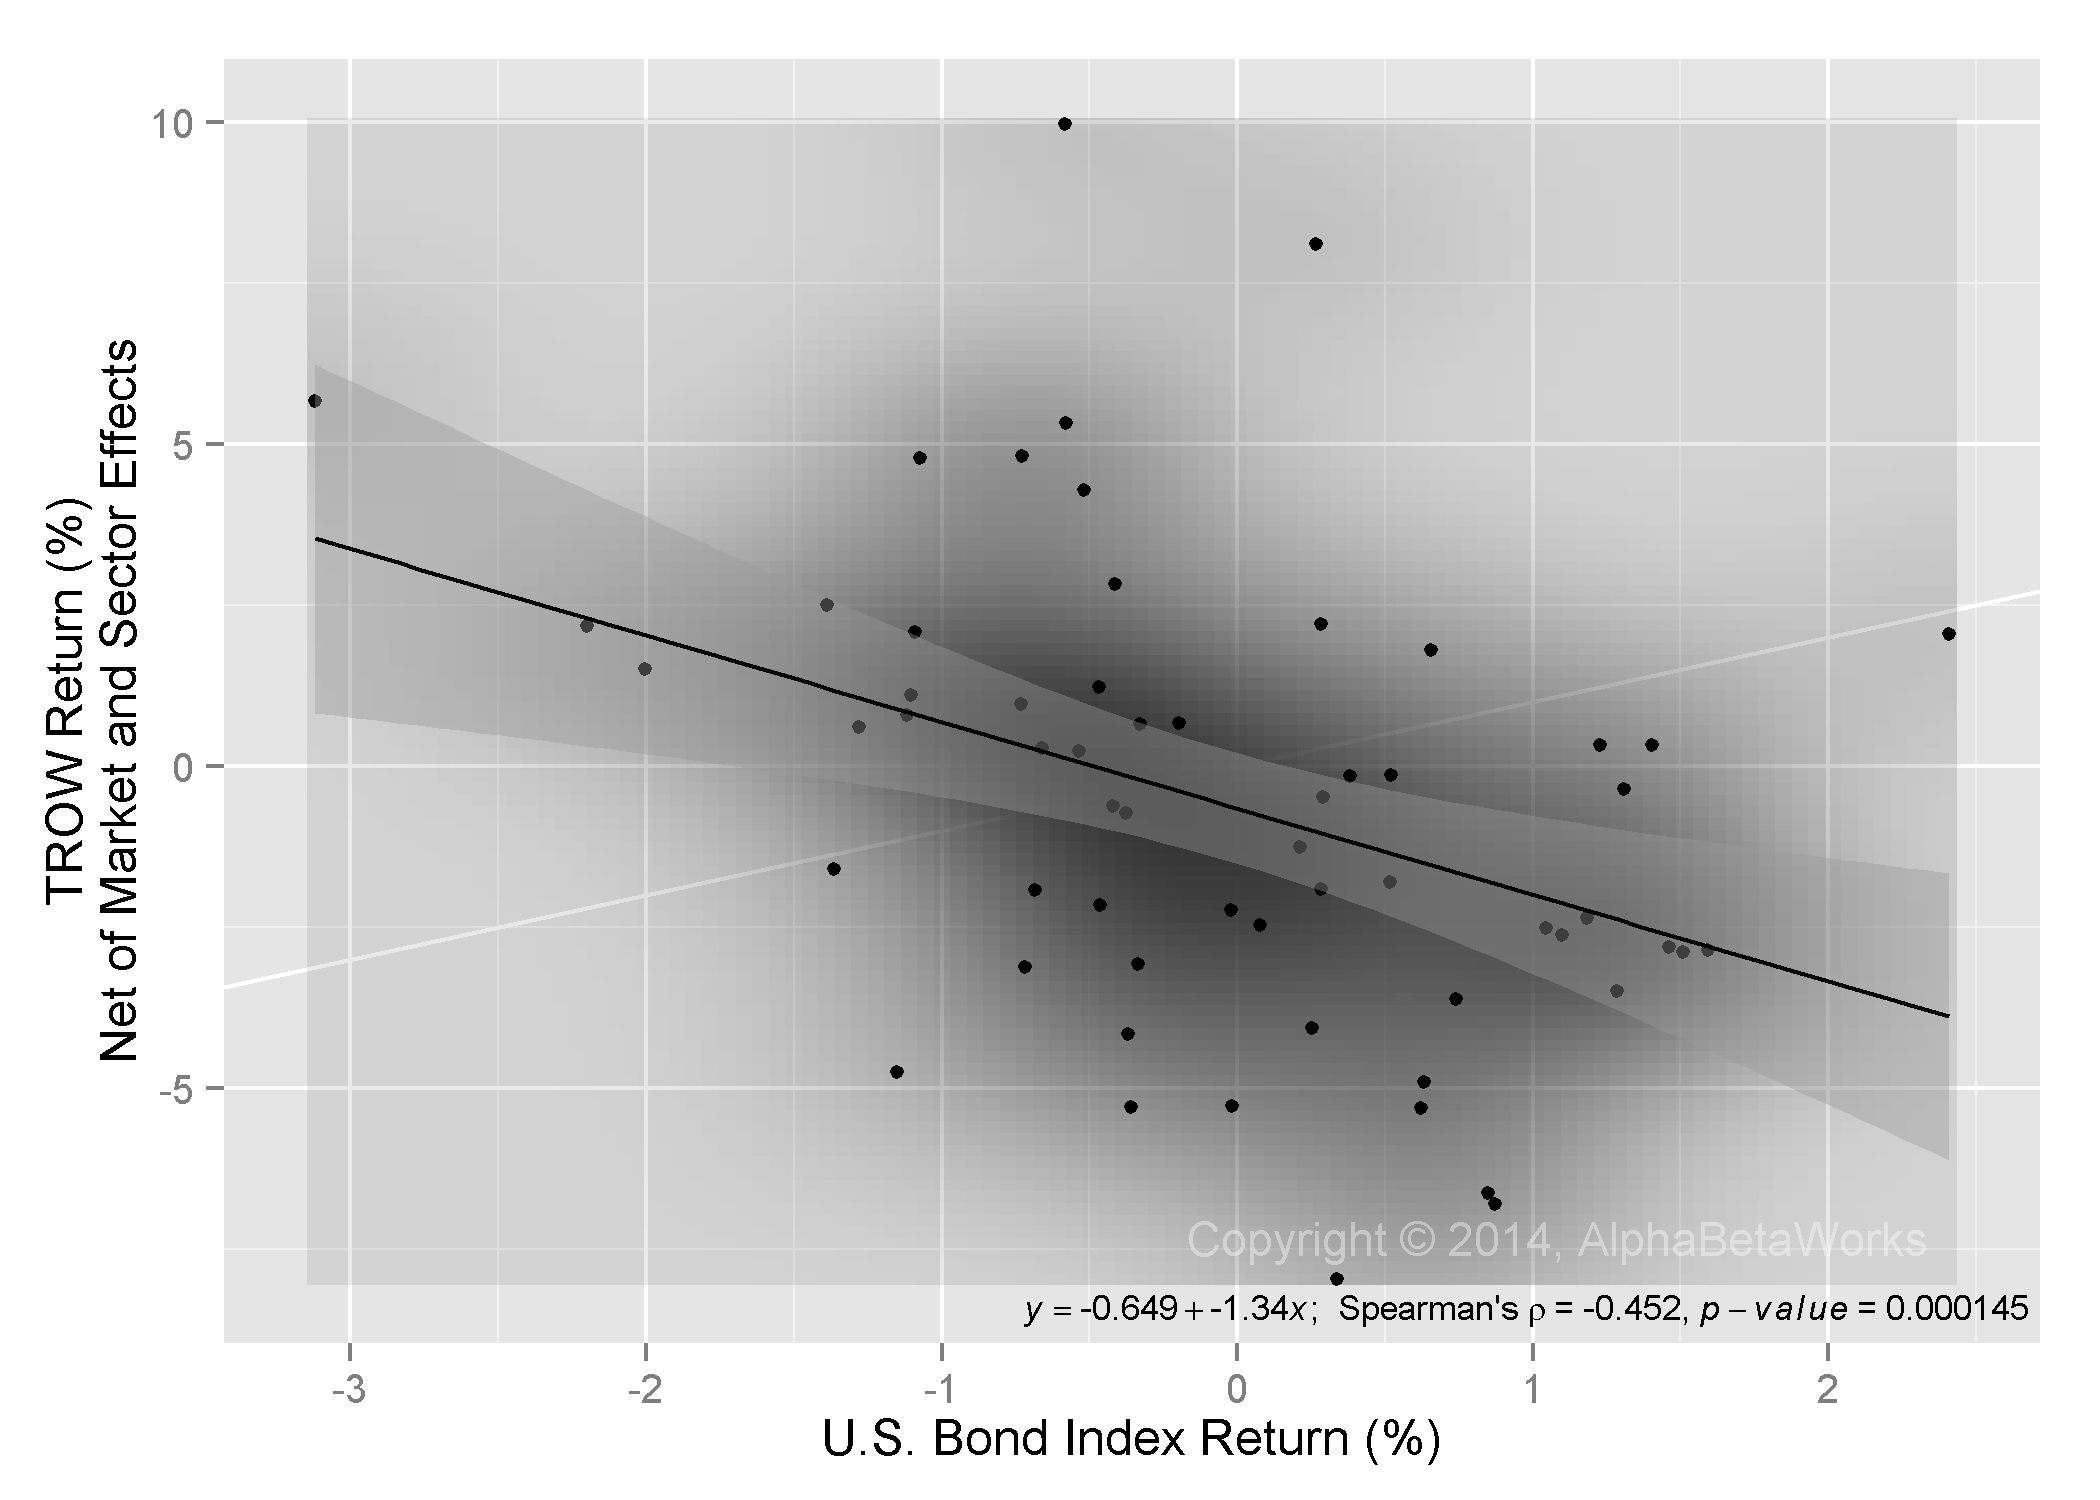
Turning to HF Aggregate’s residual variance relative to the U.S. Market, just seven stocks are responsible for half of the relative residual (idiosyncratic) risk:
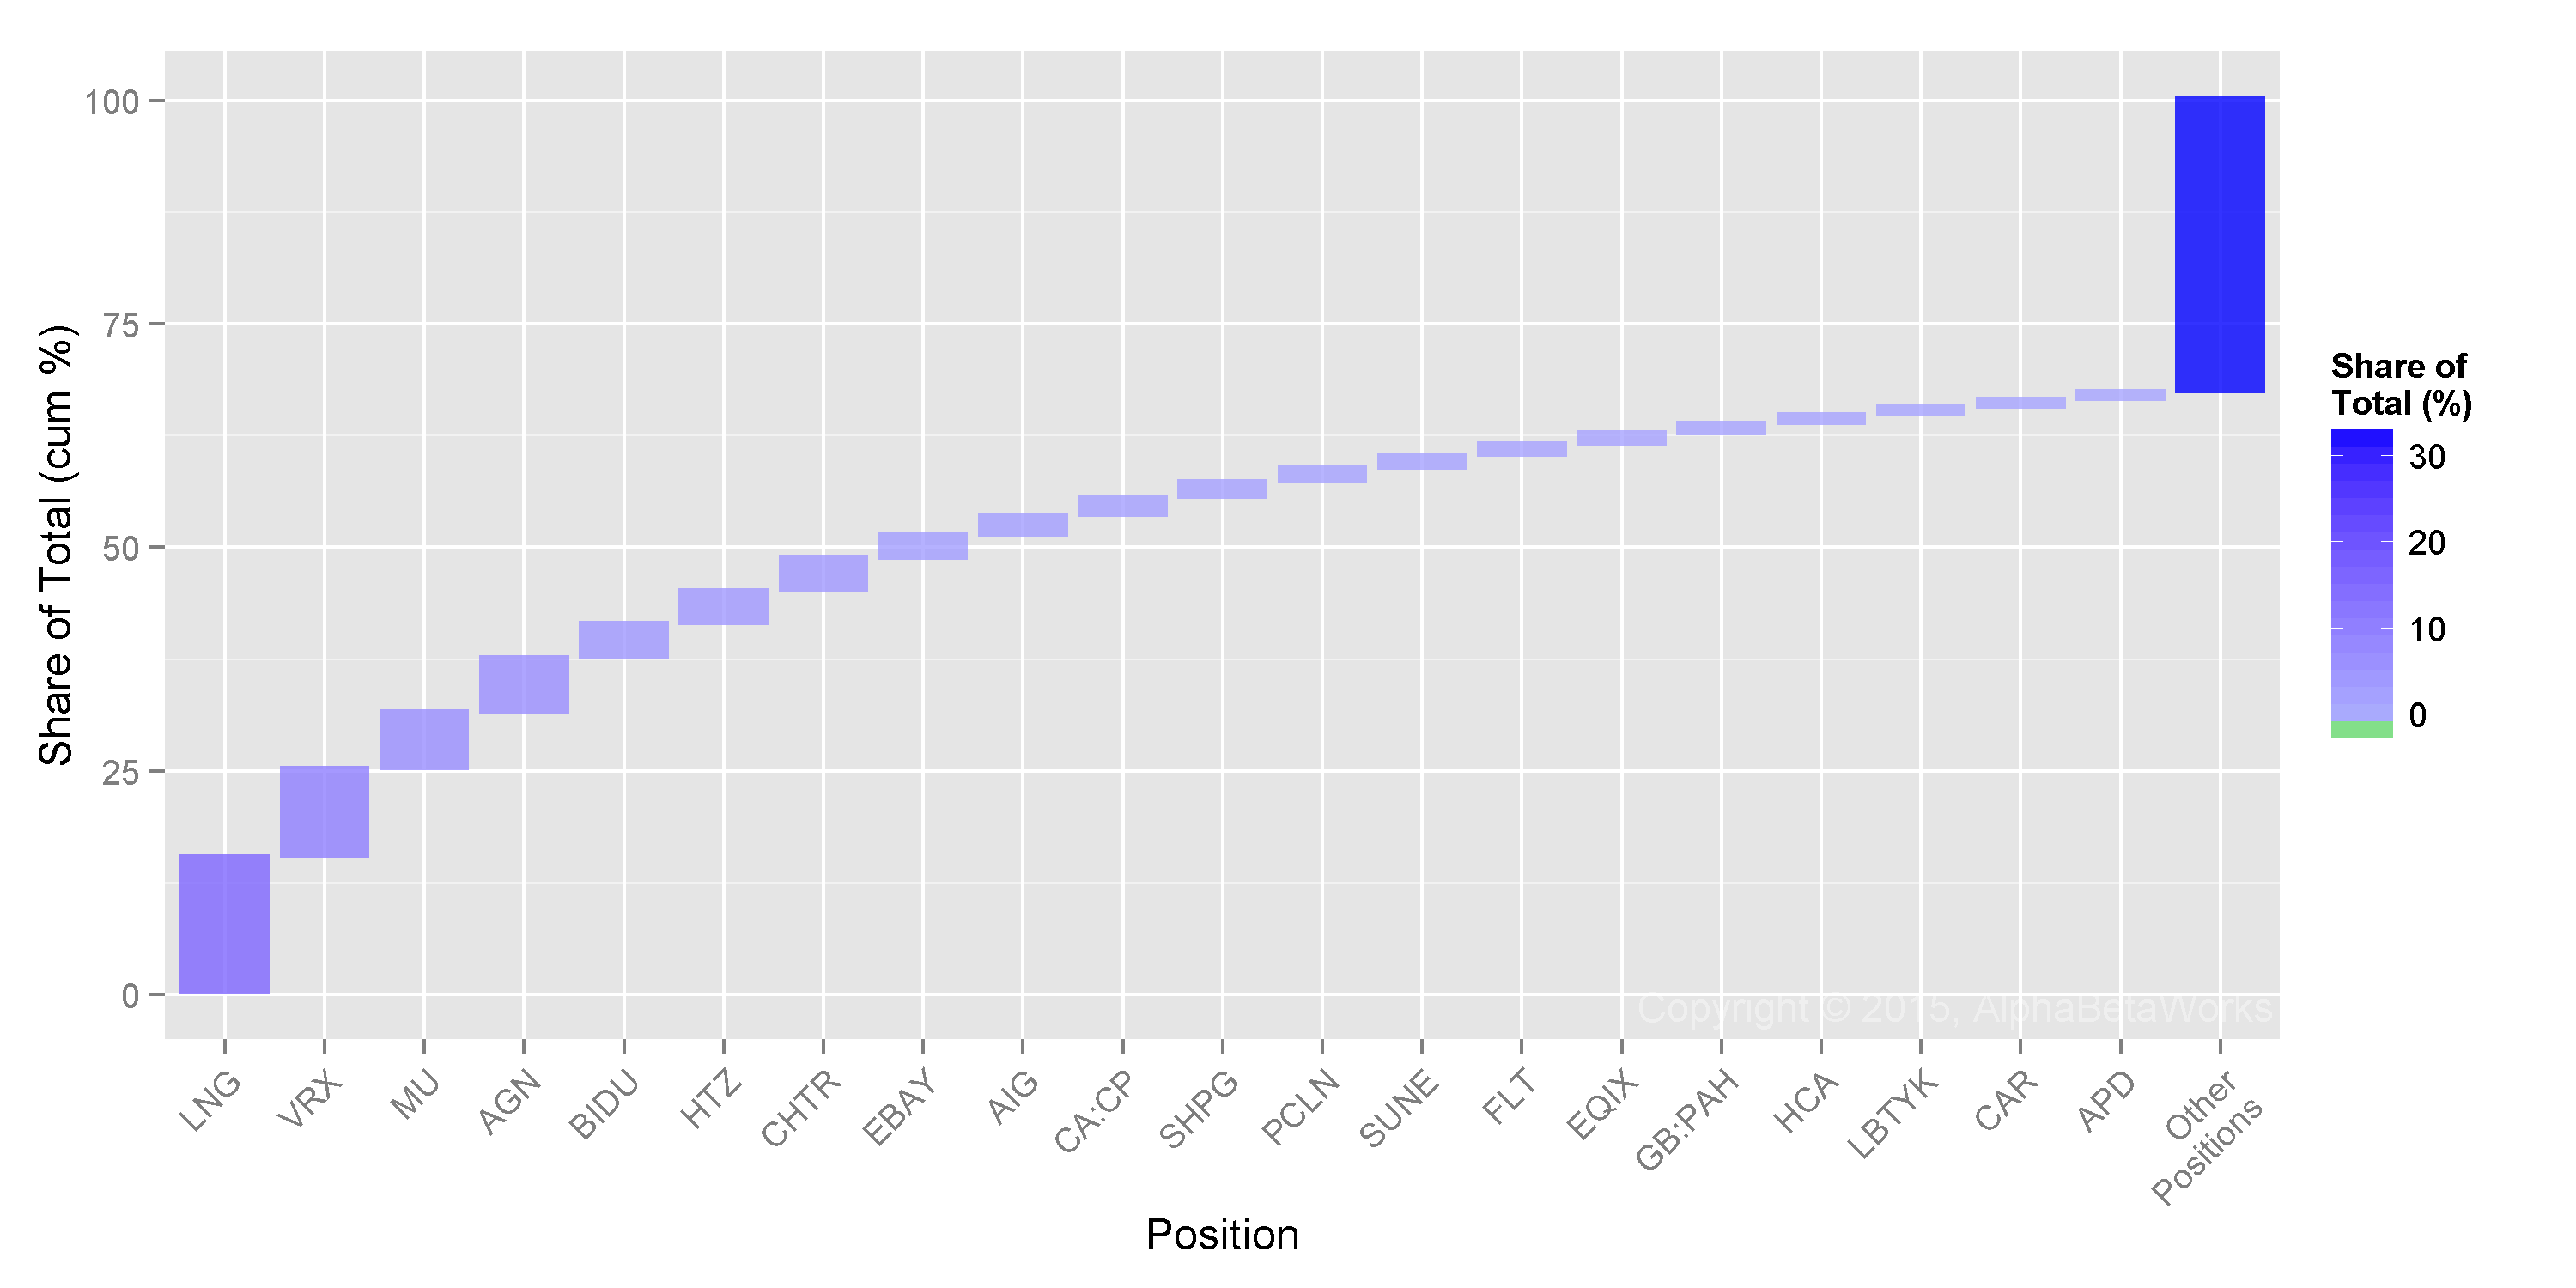
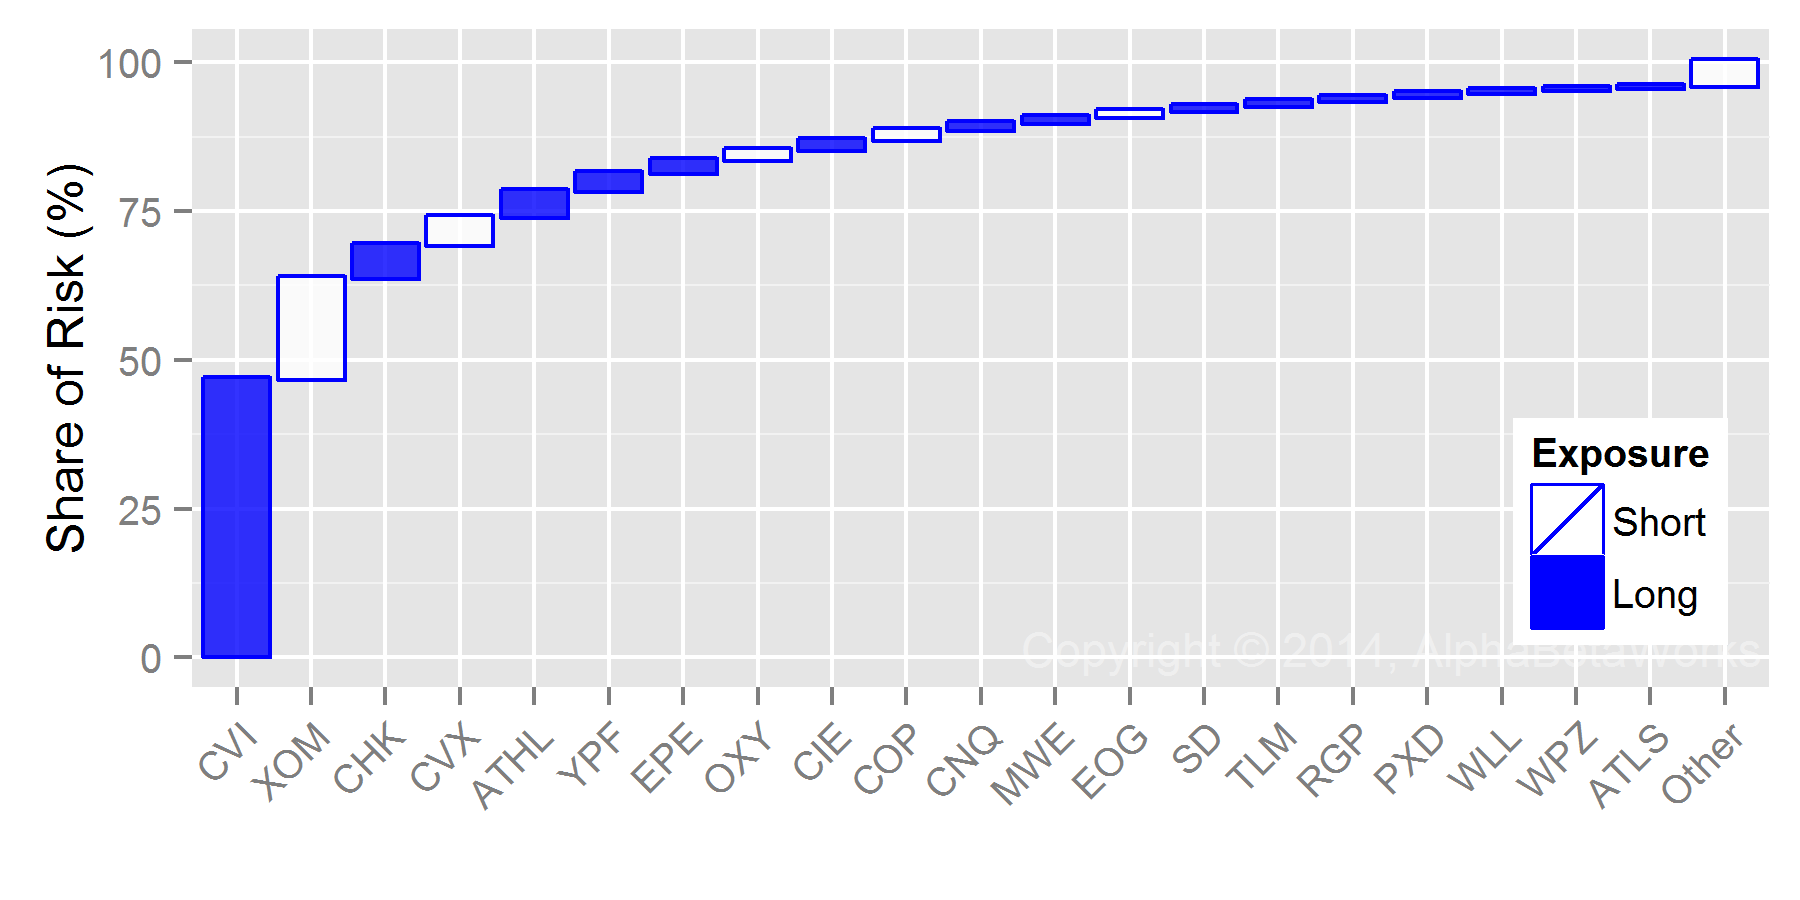
Stocks Contributing Most to Relative Residual Variance of U.S. Hedge Fund Aggregate
These stocks may be wonderful individual investments, but they have a lot of sway in the way HF Aggregate and individual funds closely matching it will move. They will also be affected by the whims of capital allocation into hedge funds as an asset class. Investors should be ready for seemingly inexplicable volatility in these names. The list is mostly unchanged from the previous quarter:
| Symbol | Name | Exposure (%) | Share of Idiosyncratic Variance (%) |
| LNG | Cheniere Energy, Inc. | 1.61 | 15.28 |
| VRX | Valeant Pharmaceuticals International, Inc. | 2.36 | 9.76 |
| MU | Micron Technology, Inc. | 1.45 | 6.34 |
| AGN | Allergan, Inc. | 2.82 | 6.08 |
| BIDU | Baidu, Inc. Sponsored ADR Class A | 1.30 | 3.83 |
| HTZ | Hertz Global Holdings, Inc. | 1.36 | 3.68 |
| CHTR | Charter Communications, Inc. Class A | 1.68 | 3.67 |
| EBAY | eBay Inc. | 1.62 | 2.58 |
| AIG | American International Group, Inc. | 1.37 | 2.17 |
| CA:CP | Canadian Pacific Railway | 1.74 | 2.02 |
| SHPG | Shire PLC Sponsored ADR | 1.28 | 1.70 |
Investors should be especially careful and perform particularly thorough due-diligence when investing in crowded names, since any losses will be magnified when hedge funds rush for the exits. Fund allocators should thoroughly investigate hedge fund managers’ crowding to avoid investing in a pool of undifferentiated bets.
AlphaBetaWorks assists in both tasks: Our sector crowding reports identify hedge fund herding in each equity sector. Our hedge fund crowding data identifies manager skill and differentiation and is predictive of future performance.
Summary
- There is both factor (systematic/market) and residual (idiosyncratic/security-specific) crowding of long hedge fund portfolios.
- Hedge funds have become more crowded and more passive in Q3 2014.
- The main sources of factor crowding are: Market (higher beta) and Oil.
- The main sources of residual crowding are: LNG, AGN, VRX, MU, BIDU, and AIG.
- Our research reveals that, collectively, hedge funds’ long U.S. equity portfolios tend to generate negative risk-adjusted returns. Crowded bets tend to disappoint and hedge fund investors should pay close attention to crowding before allocating capital.