
Or How to Tell if You Are Paying Top Dollar for a Flawed System
This article is part of an ongoing series exploring flaws in popular investment risk and skill evaluation techniques. We focus on the most common pitfalls that have been particularly costly for asset managers and fund investors over the years.
The two primary approaches to investment risk and skill evaluation are returns-based style analysis and holdings-based style analysis. These approaches are also the foundation of returns-based and holdings-based performance attribution. Our previous article discussed problems with returns-based analysis that can lead to flawed estimates of risk and skill – costly mistakes for fund investors and allocators. Here, we examine what it takes for holdings-based approaches to succeed.
Holdings-Based Analysis Can be Effective
In theory, holdings-based analysis can leverage all the available information on a portfolio and its constituents: past returns, composition, past holdings’ return and fundamental data. Since this information is a super-set of the data returns-based analysis uses, holdings-based analysis should be more effective.
In practice, the effectiveness of holdings-based style analysis and holdings-based performance attribution depends on the effectiveness of the underlying risk model. The risk model translates historical holdings data into portfolio style, or risk, data.
The Elements of Fund Style
A holdings-based analysis must capture the main Risk Factors that drive fund returns. We used the AlphaBetaWorks Performance Analytics Platform to analyze 15 years of portfolio and performance history of approximately 3,000 medium and lower turnover US mutual funds to determine the main sources of fund risk and return:
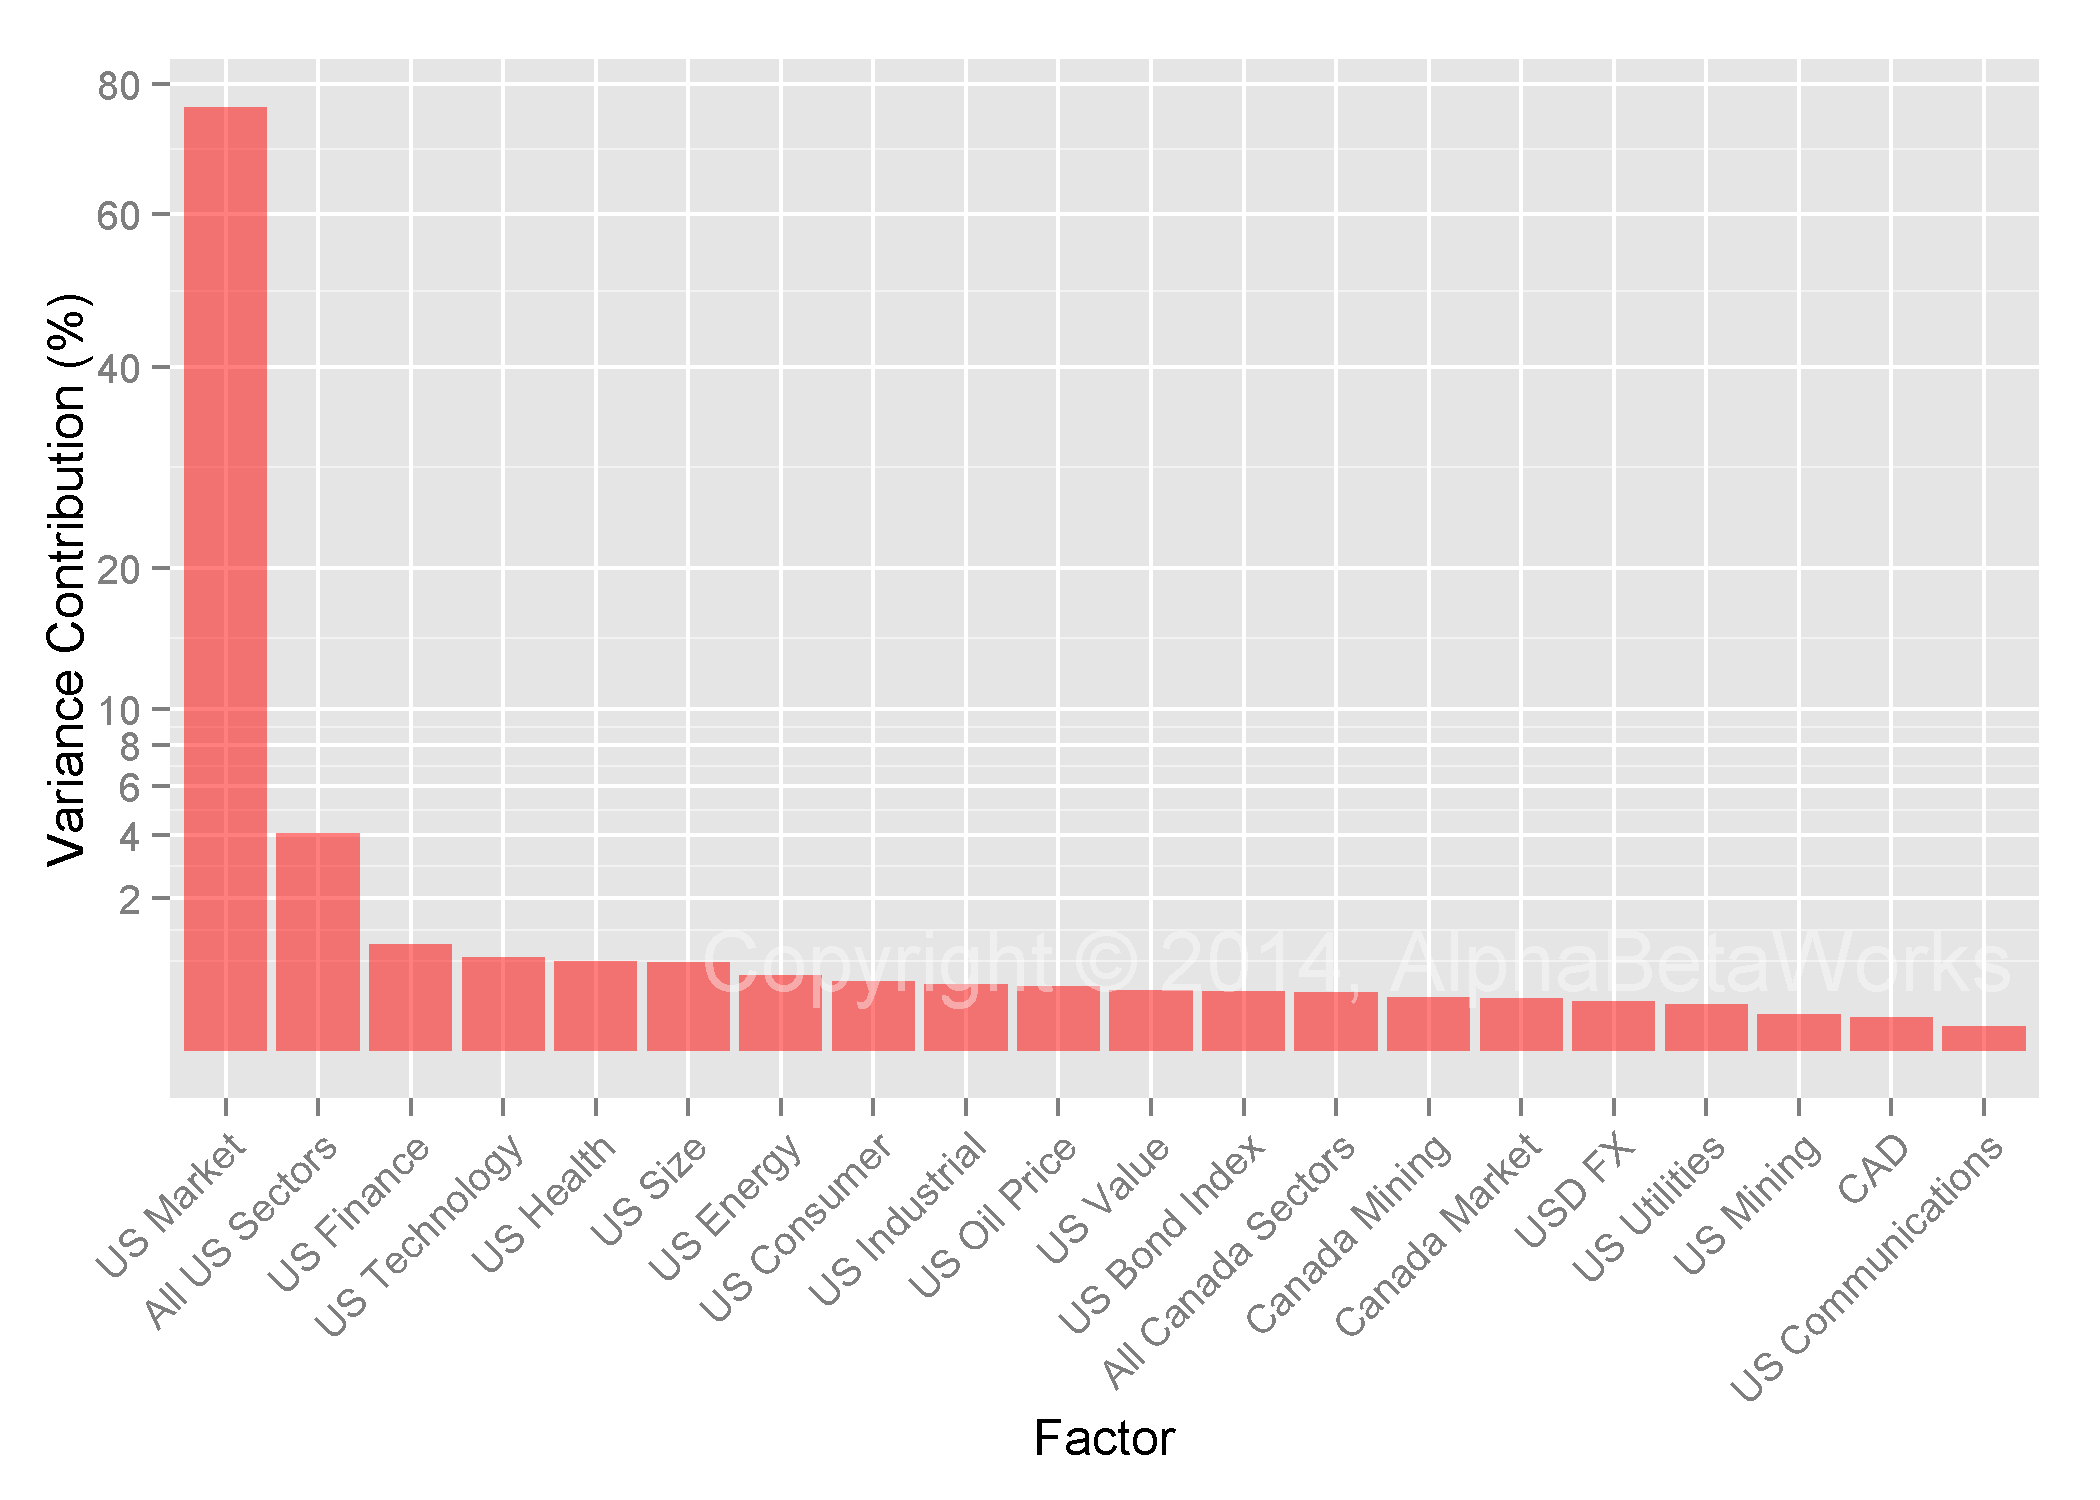
Factors Contributing Most to US Mutual Fund Performance
Approximately 76% of the variation in monthly performance of these funds is explained by their US Market Factor exposures, or US Market Betas. Sector factors, or sector betas, such as Finance and Technology, explain a further 4%. Traditional style factors, such as Value and Size explain approximately 1%.
The primacy of market and sector factors is consistent with existing research, including findings that in periods such as 1999-2001 the performance of Style Factors may be entirely due to sector effects. For holdings-based analysis to be effective, it must accurately identify market/region and sector exposures (betas).
Tests of Holdings-Based Analysis
Market factor exposure is the primary driver of fund risk and returns. Therefore, the first step in evaluating any model used for holdings-based style analysis and attribution is to establish how well it can discriminate between low-beta and high-beta securities.
We use two well-known financial stocks as examples. Bank of America Corporation (BAC) is more financially levered than M&T Bank Corporation (MTB). One would expect BAC to have correspondingly higher systematic risk. A chart of monthly returns confirms this hypothesis:
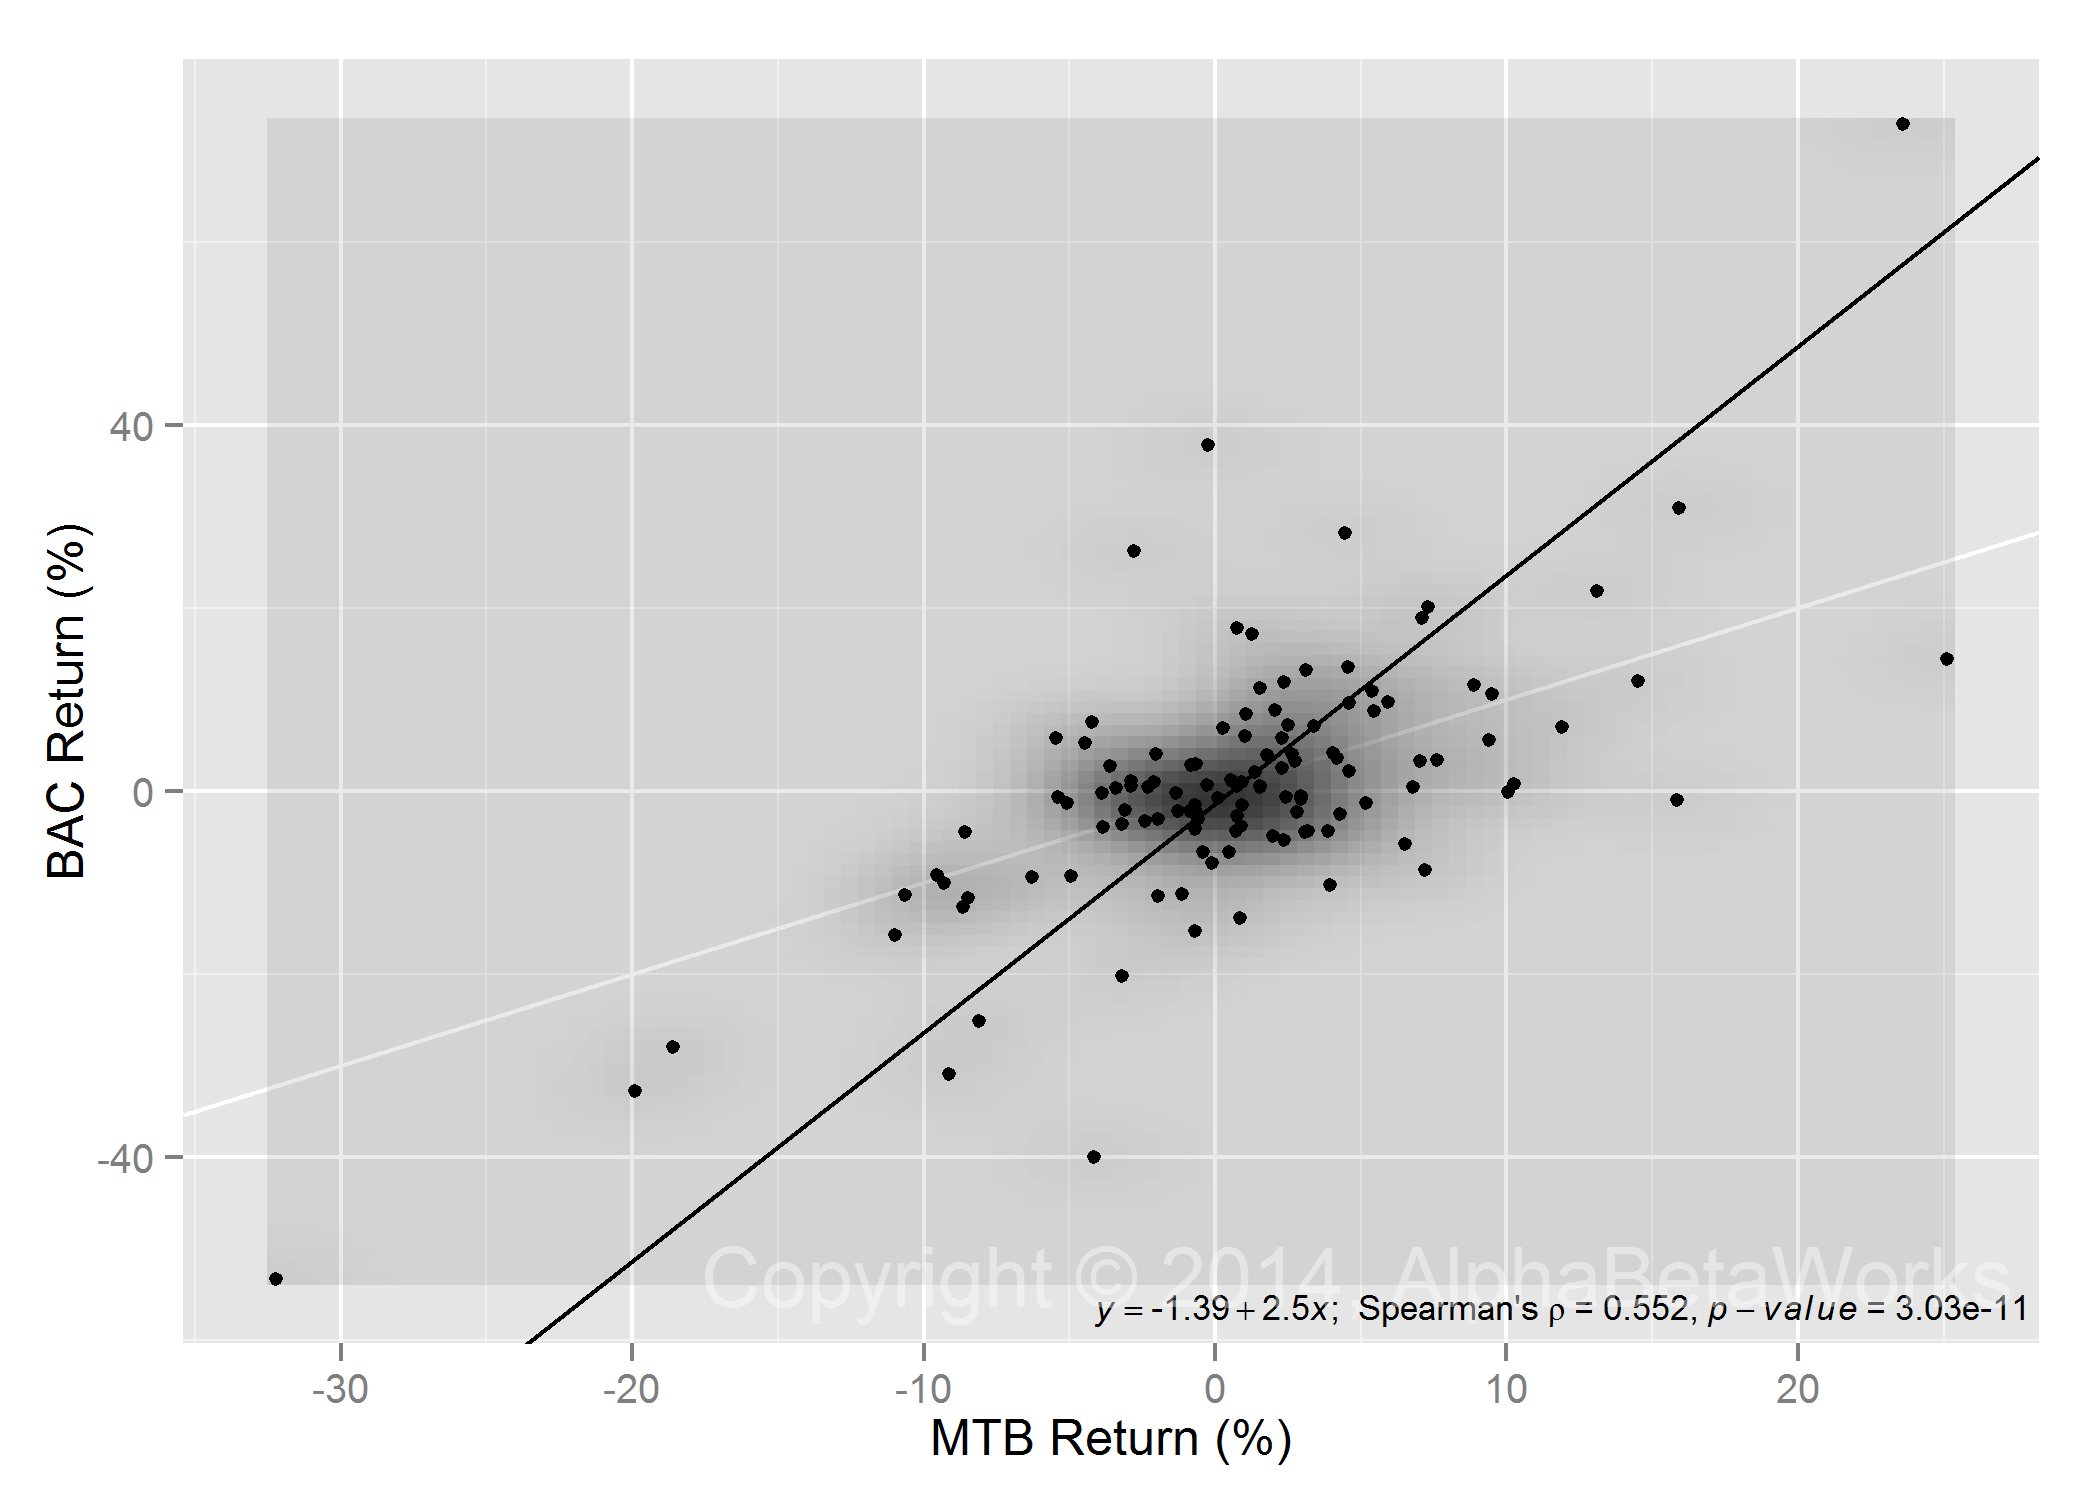
BAC Monthly Returns vs MTB Monthly Returns
BAC is significantly correlated with, and levered to, the returns of MTB. Correlation among securities is due to shared systematic risk, primarily market and sector factors. Therefore, BAC’s risk factor exposures should be higher than MTB’s.
Holdings-Based Analysis Test 1 – Market Risk
As anticipated, BAC’s US Market exposure is approximately two times larger:
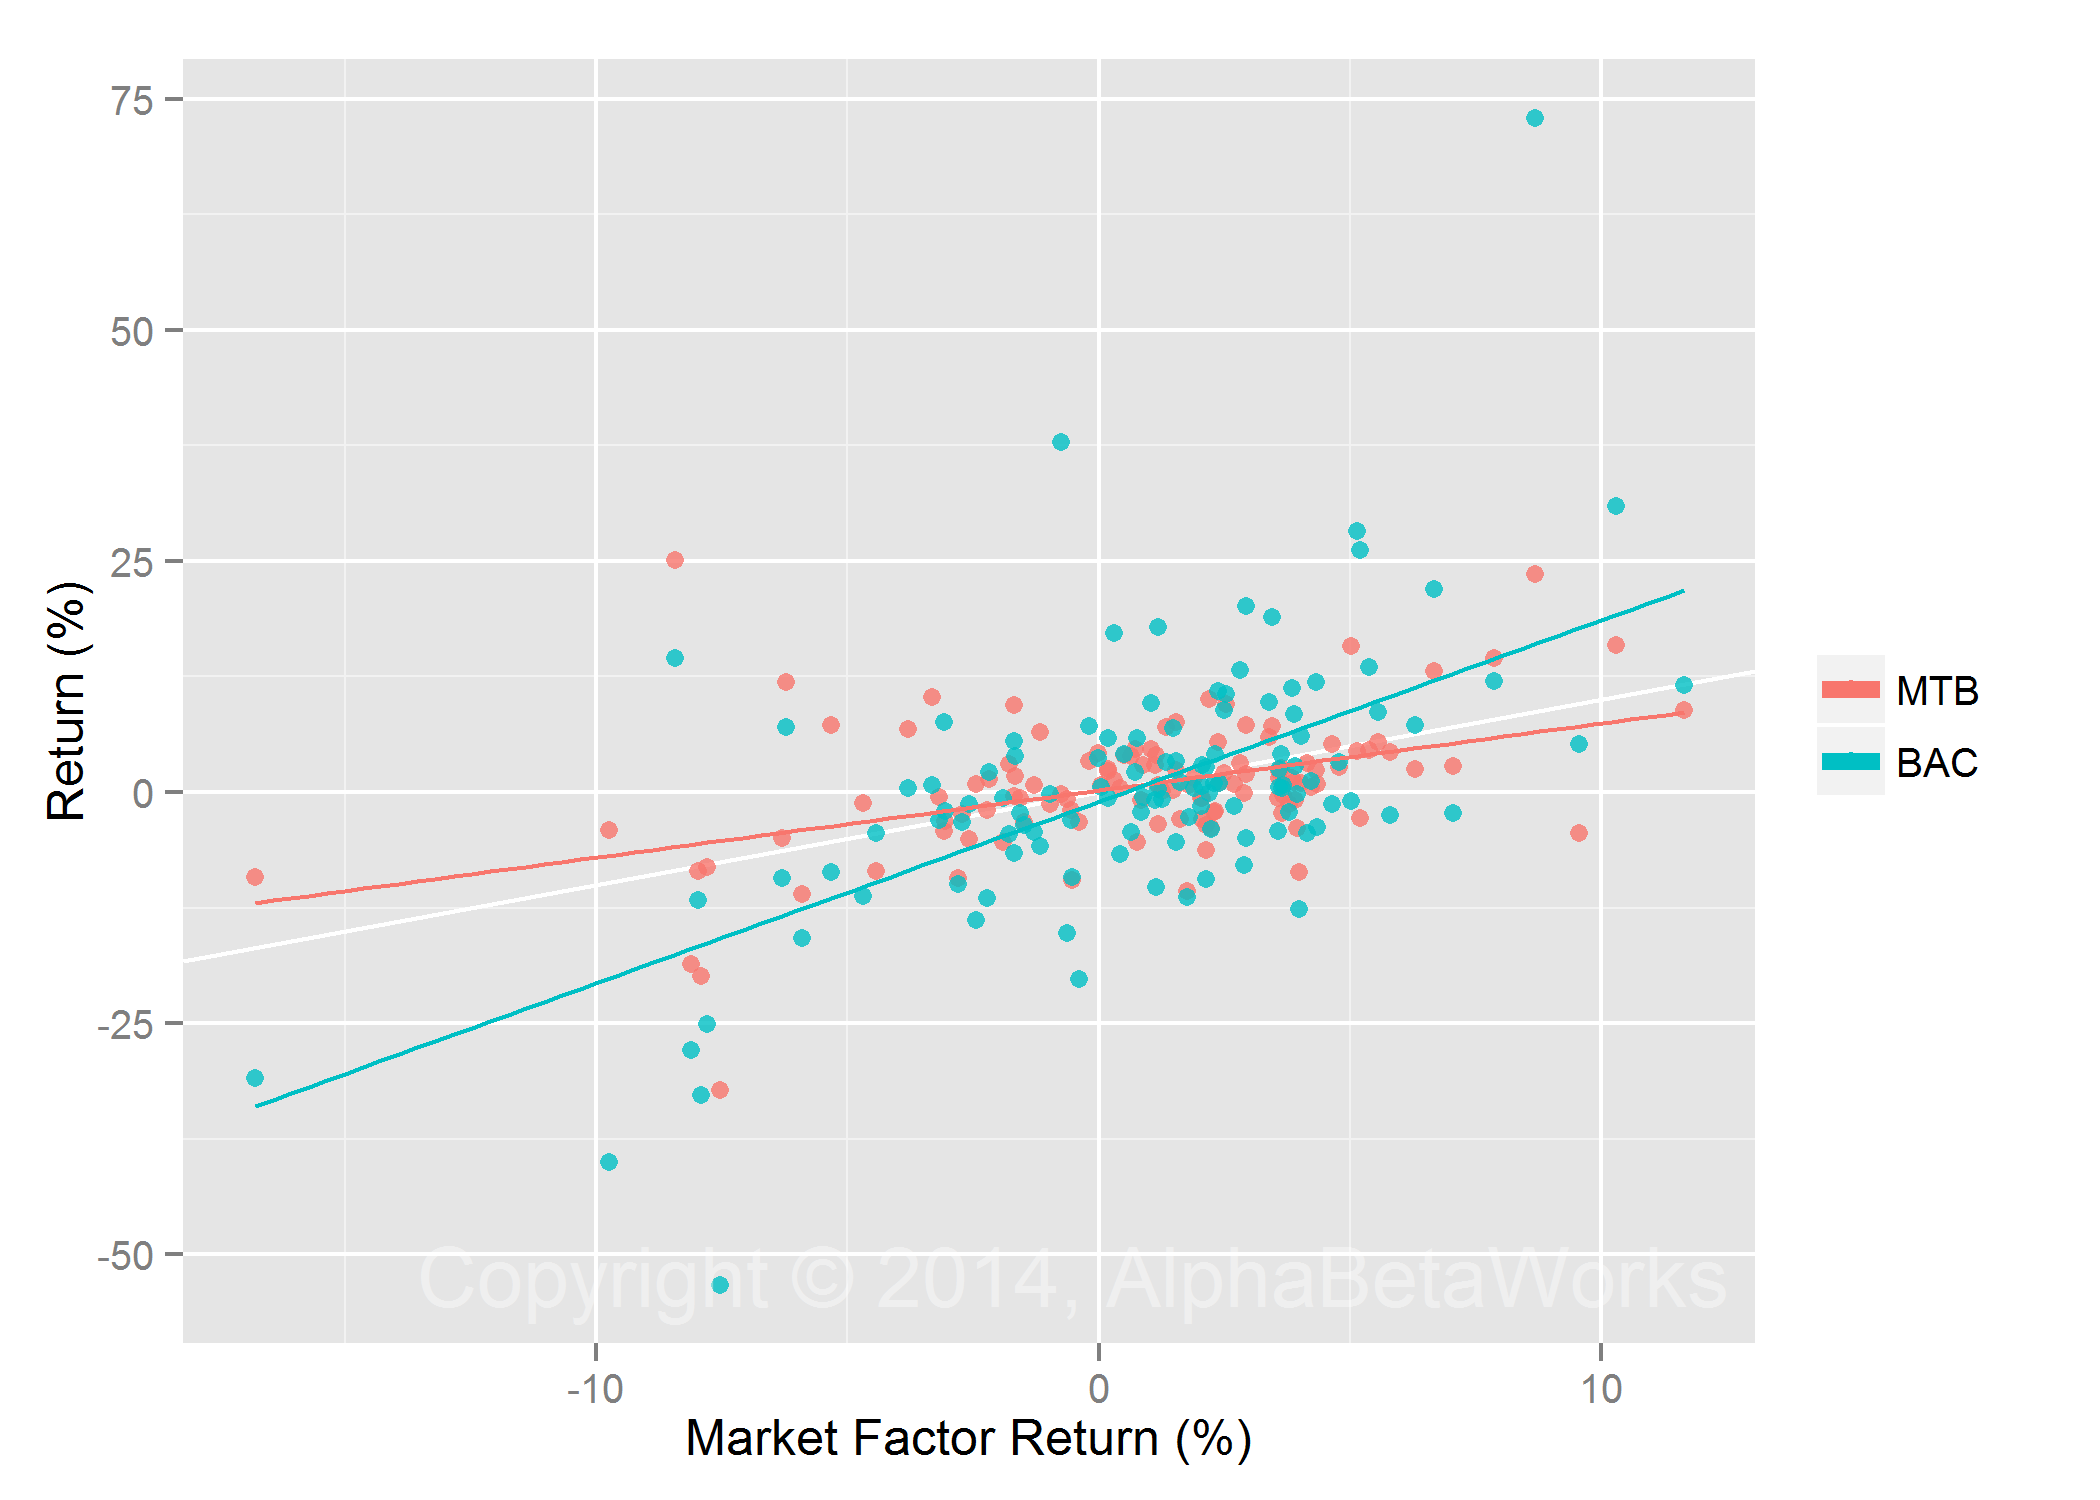
MTB and BAC Returns vs Market Factor Return
If a holdings based risk system suggests that $1 invested in BAC and $1 invested in MTB have similar US Market Risks, then it is flawed. It will fail to correctly measure market risk – the single most important driver of fund risk and return.
Holdings-Based Analysis Test 2 – Sector Risk
The next essential question is whether the higher risk of BAC is solely due to its higher US Market Beta. Intuitively, the higher leverage of BAC should affect its exposure to all risk factors, not just market risk. Therefore, one would also expect BAC’s Finance Sector Factor Exposure to be approximately twice as large. Indeed it is:
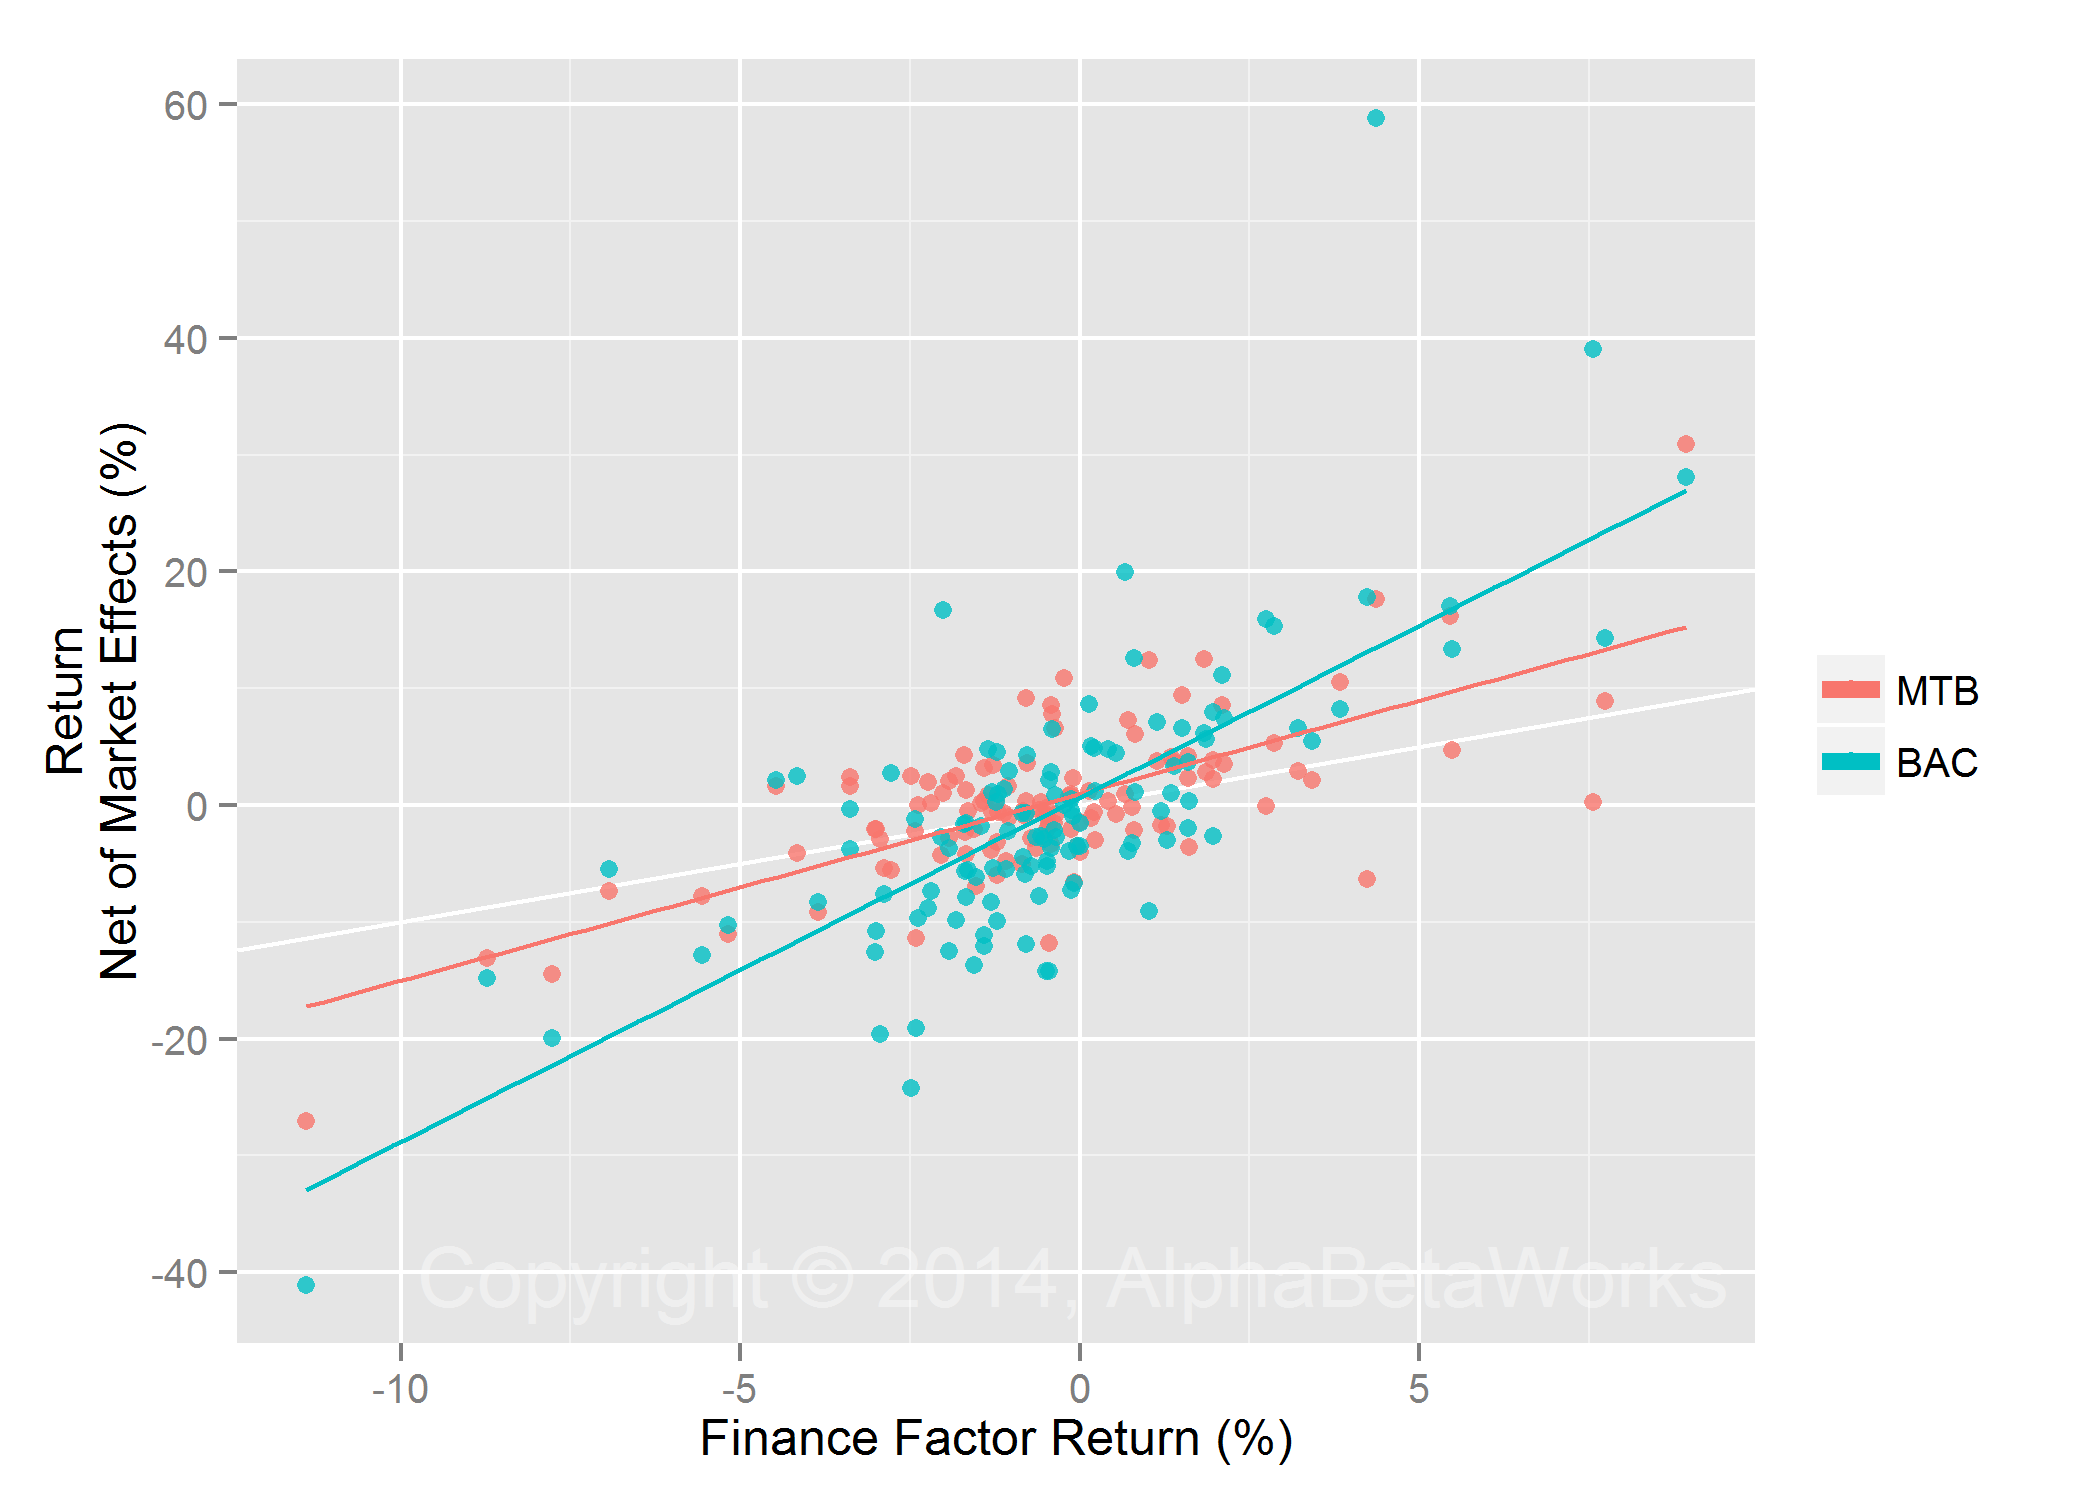
MTB and BAC Returns Net of Market Effects vs Finance Factor Return
If a holdings-based risk system suggests that $1 invested in BAC and $1 invested in MTB have similar Finance Sector Risk, then it is flawed. It will fail to correctly measure sector risk – the second most important driver of fund risk and return.
Holdings-Based Analysis Test 3 – Levered ETFs
It can be time-consuming to test a holdings-based system with individual levered securities. One must:
- Identify two stocks with distinct market betas and correlation
- Verify the difference in market exposures of these two stocks
- Identify two stocks with distinct sector betas and correlation
- Verify the difference in sector exposures of these two stocks
We propose a shortcut that will identify many, but not all, of the holdings-based systems that fail:
- Take a levered and an un-levered ETF or index fund that track the same Index
- Verify the difference in factor exposures of these securities
- Verify that factor exposures are consistent with leverage
For example, consider Direxion Daily Small Cap Bull 3x Shares (TNA) and iShares Russell 3000 ETF (IWV):

Cumulative Returns for a Levered ETF (TNA) and an Un-Levered ETF (IWV)
Any competent risk system should assign TNA approximately 3x the exposures of IWV:
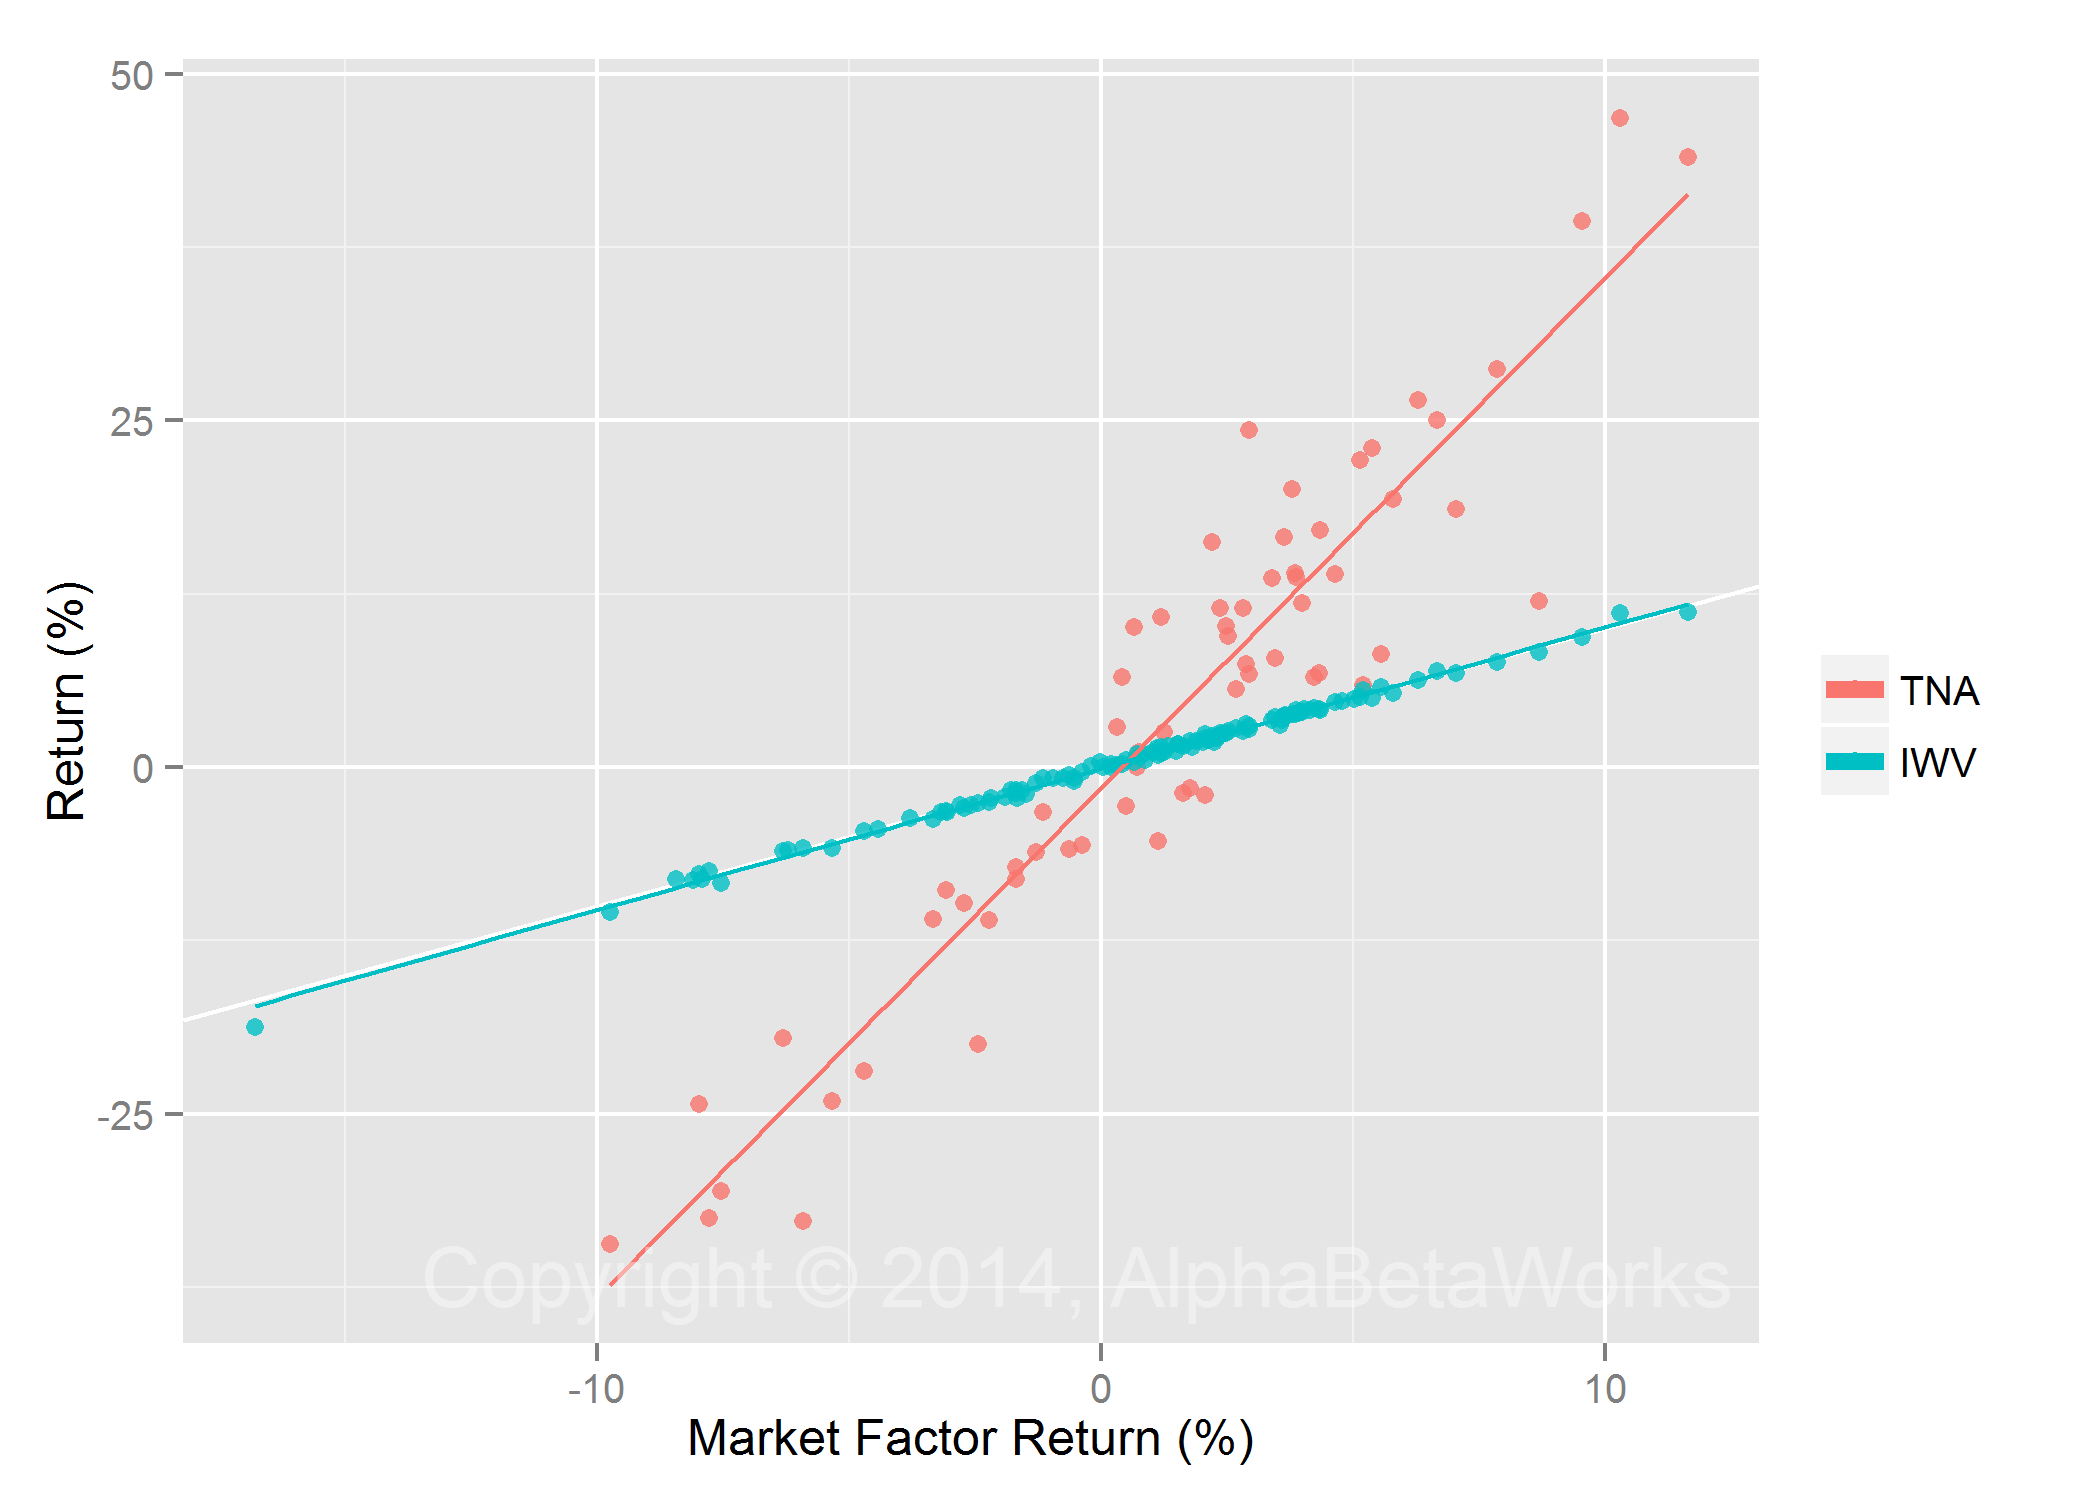
Returns for a Levered ETF (TNA) and an Un-levered ETF (IWV) vs Market Factor Return
A performance attribution system should find that, due to time decay over the long term, the levered fund generates negative returns net of its factor exposures:
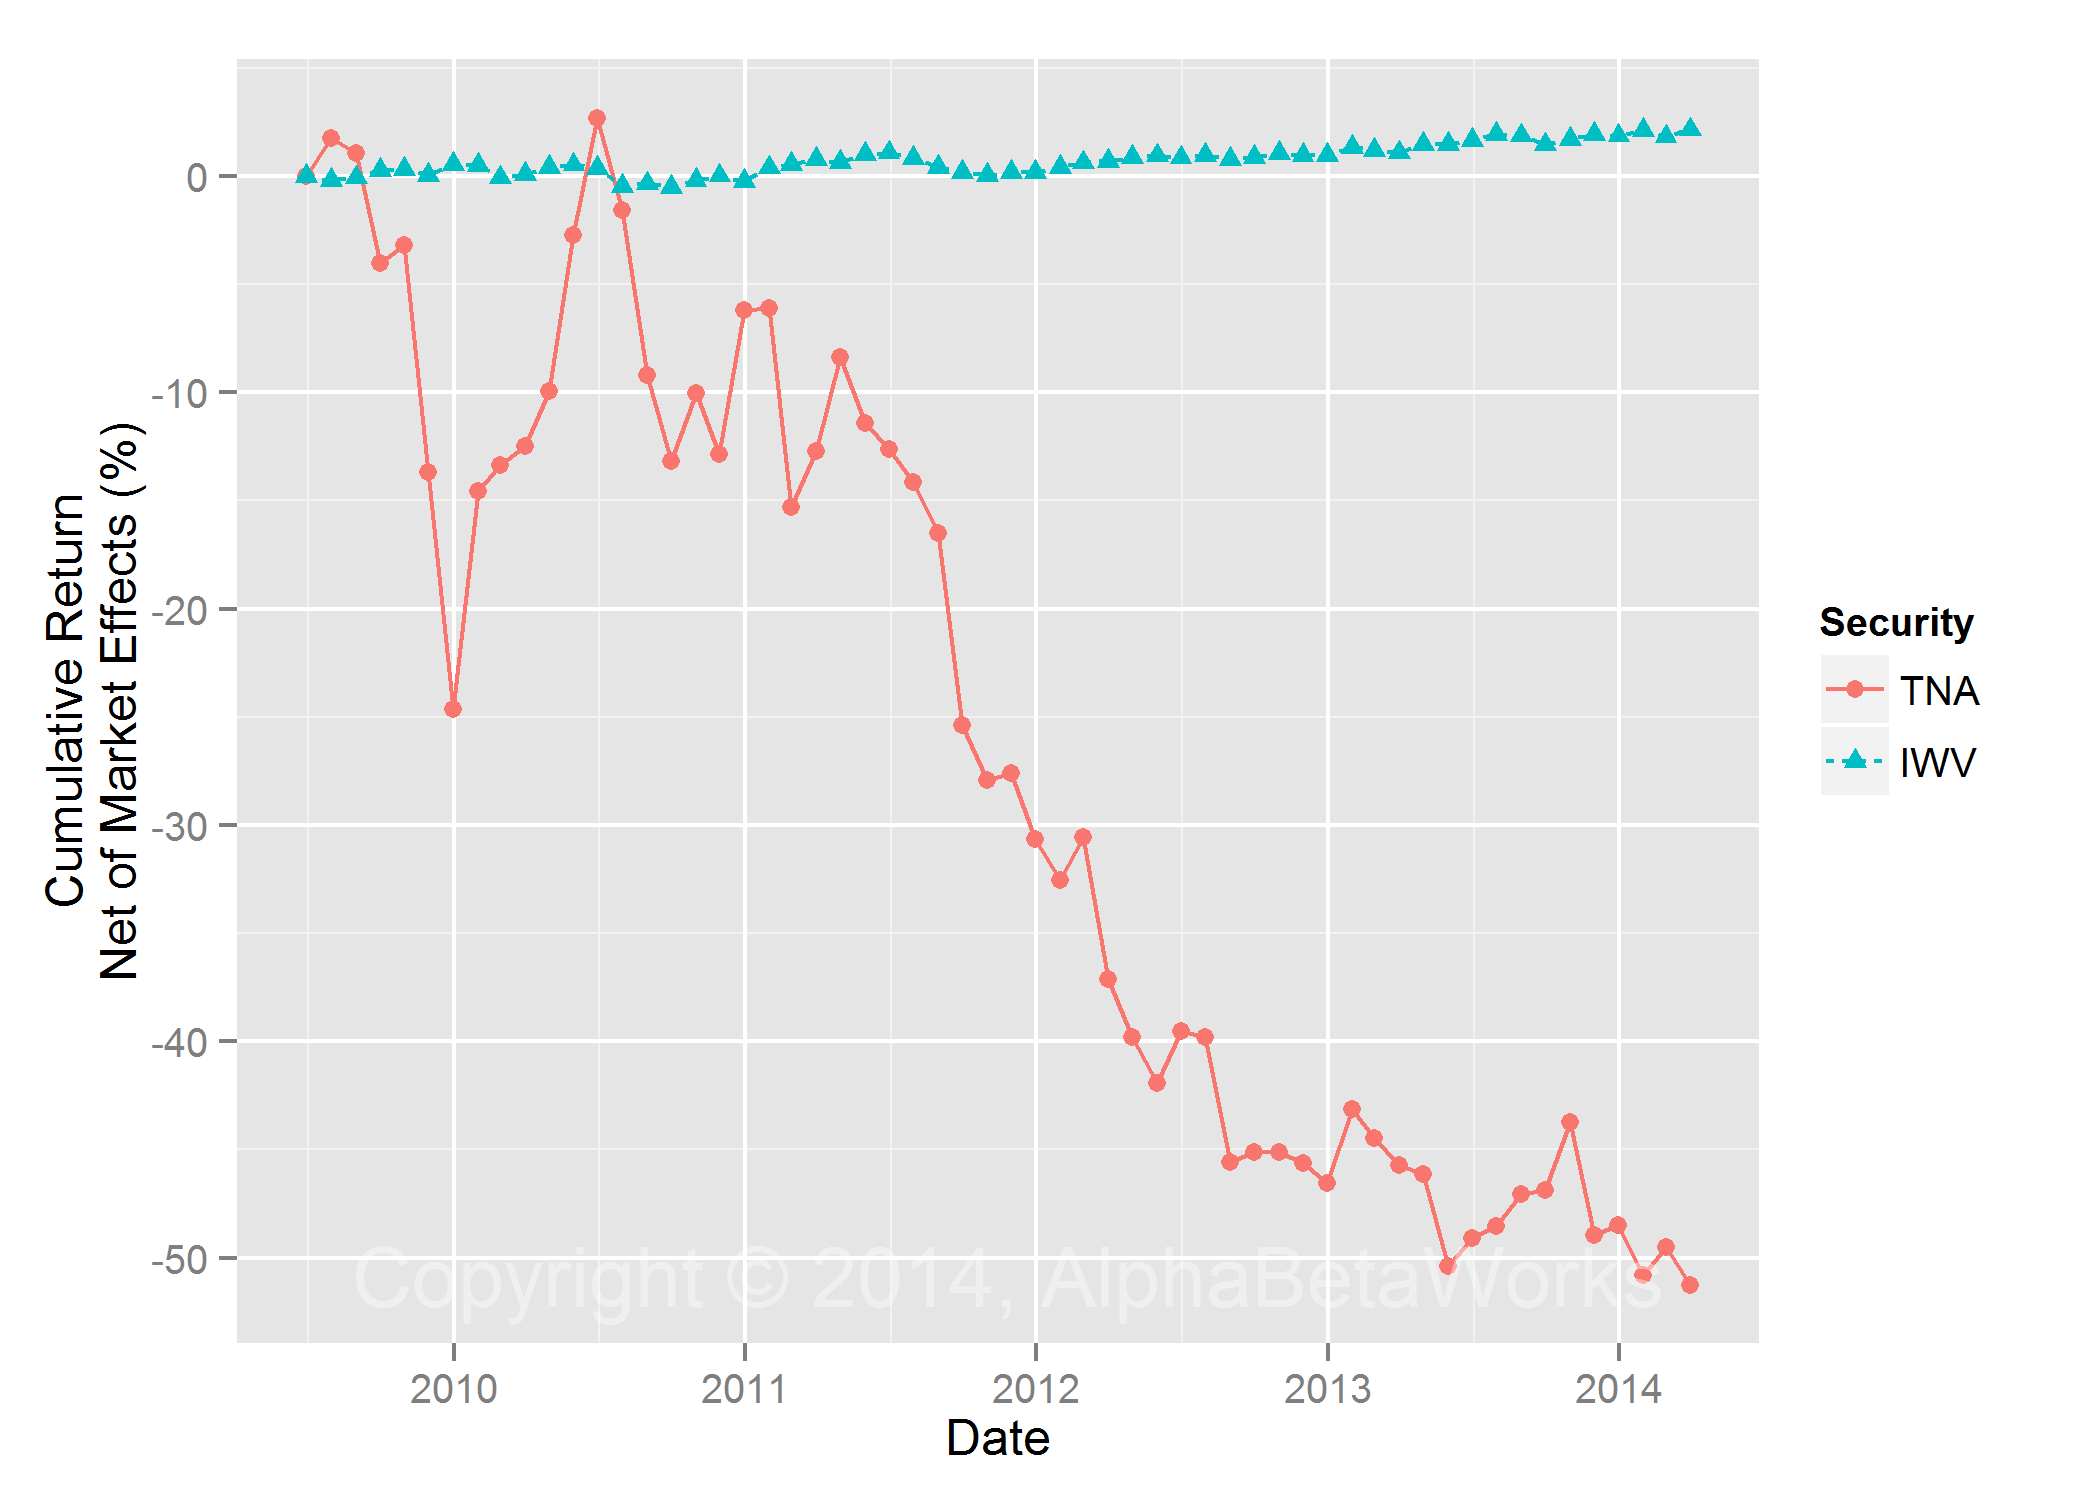
Cumulative Returns Net of Market Effects for a Levered ETF (TNA) and an Un-levered ETF (IWV)
Unfortunately, some of the most highly-priced risk models, holdings-based style analysis tools, and performance attribution systems fail even this simple test.
Conclusions
A system that does not distinguish between low- and high- market and sector exposures (betas) will be fatally flawed. It will:
- Underestimate the risk of high-risk portfolios
- Overestimate the risk of low-risk portfolios
- During bull markets, deem as skilled poor stock pickers passively taking high risk
- During bull markets, deem as unskilled excellent stock pickers passively taking low risk
AlphaBetaWorks Statistical Equity Risk Model and Performance Analytics Platform are resilient against the issues identified above, having been refined on thousands of portfolios and tested over decades of history. Regrettably, some of the most commonly used commercial products exhibit these flaws. Even the highest-priced offerings are not immune. Investment Managers and Capital Allocators that are unaware of these flaws will be doubly-blindsided in periods of market turmoil. Their realized risk may be higher than estimated. Their “best” managers may turn out to be their worst.
Copyright © 2012-2014, AlphaBetaWorks, a division of Alpha Beta Analytics, LLC. All rights reserved.
Content may not be republished without express written consent.


