
Factor analysis is a popular and effective technique that explains and forecasts security returns. The factor models prevalent in academic circles (Fama-French, Carhart) tend to rely heavily on the size and value style factors. Meanwhile, effective industry models often attribute risk to sector and industry factors before style. Which approach is more effective? Though claims that style explains stock returns are common, they usually lack evidence – there is a paucity of research that compares the explanatory power of sectors and style.
This paper provides the missing data and analyzes the explanatory power of sectors and style for U.S. stocks. We find that, after controlling for the market exposure, sectors are slightly more effective than size and approximately four times more effective than value in explaining monthly returns.
Measuring the Explanatory Power of Sectors and Style for U.S. Stock Returns
- We analyze the monthly returns of U.S. stocks over the 15-year interval 4/30/2004-4/30-2019. We start with approximately 6,000 stocks that pass minimum market capitalization and liquidity thresholds – a universe similar to the Russell 3000 Index.
- For each month in the historical interval and each stock in the sample, we estimate the stock’s market beta.
- We calculate (out-of-sample) market residuals (alphas) for a given month using the prior month’s market beta for each stock.
- We restrict the analysis to stocks with at least five years of defined market residuals to have a significant sample. This final sample comprises approximately 3,600 stocks.
- We construct sector, size, and value factors as
follows:
- The sector factors are cap-weighted portfolios of market residuals for the nine sectors equivalent to the top-level GICS sectors.
- The size factor is long the cap-weighted portfolio of stocks in the top 25% and short stocks in the bottom 25%, as ranked by market capitalization.
- The value factor is long the cap-weighted portfolio of stocks in the top 25% and short stocks in the bottom 25%, as ranked by Book/Price.
The results below are insensitive to the specific factor definition and hold across different sector and style portfolios.
- For sector, size, and value factors, we regress stocks’ market residuals on the corresponding factor returns and measure each regression’s R². This measures the theoretical (in-sample) explanatory power of sectors and style.
- We estimate factor exposures by robust regression. We fit models with iterated re-weighted least squares (IRLS). Observations are exponentially weighted with a half-life of approximately 36-months.
A Comparison of the Explanatory Power of Sectors and Style for U.S. Stock Returns
The chart below plots the distributions of R² from the regressions of U.S. stocks’ market residuals against the sector, size, and value factors. The x-axis plots the intervals of regression R², and the y-axis plots the number of stocks in each interval. Since the distributions approximately follow a power law, we use a log y-axis:
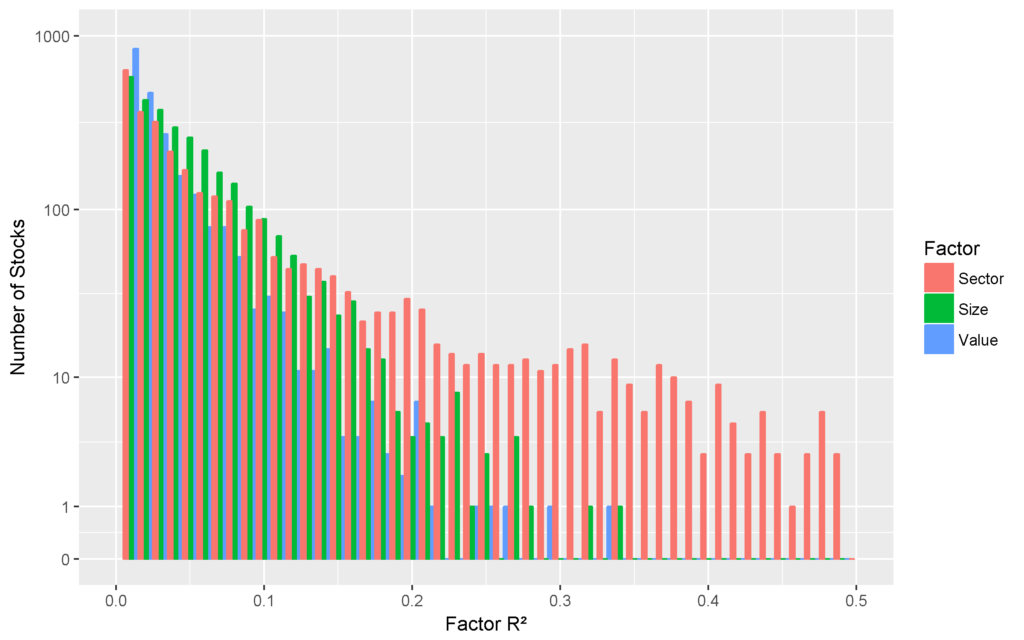
The distributions above illustrate the higher explanatory power of sectors compared to style: Whereas sector factors explain over 25% of the variance in market residuals for hundreds of stocks, style factors do so for only a small handful.
The chart below plots the mean R² values:
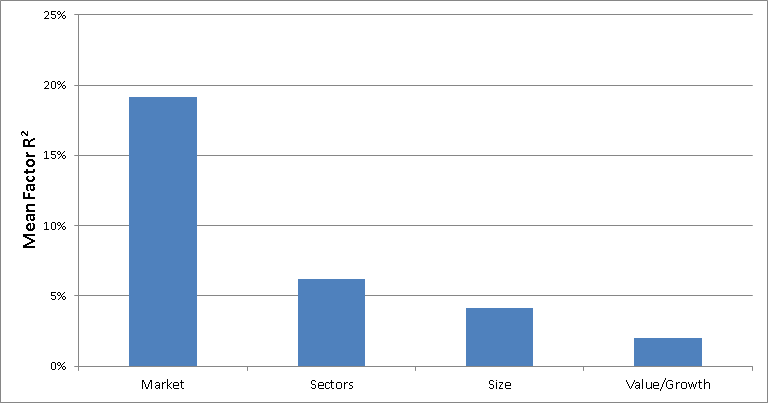
U.S. Stocks: Mean R² for the Regressions of U.S. Stock Returns and Market Residuals on the Various Factors
Reasons for Sectors’ Higher Explanatory Power
This higher explanatory power of sectors is unsurprising, given that commentary on style performance usually relies on sector factors: “Value underperformed because oil price crashed, and oil producer stocks, which are cheap, suffered.” On the other hand, even the most ideologically pure believer in the primacy of style would not make the statement: “Oil price crashed because oil producer stocks are cheap and value has recently underperformed.” Whereas sector factors can generally explain the reasons for style factor returns, style factors cannot explain the reasons for sector factor returns.
Since style factors capture systematic risk less effectively, portfolio construction from style building blocks can lead to significant unintended exposures. Studies of common smart beta strategies do indeed find such risks and significant market timing. On the other hand, sector and industry exposures offer superior control of systematic risk and more effective building blocks for portfolio construction.
In the sections that follow, we share the statistics on the explanatory power of the various factors.
The Explanatory Power of Market for U.S. Stock Returns
The chart below plots the distribution of R² from the regressions of U.S. stocks’ returns against the Market factor. This step of the analysis allows us to control for market risk and to analyze the explanatory power specific to the other factors:
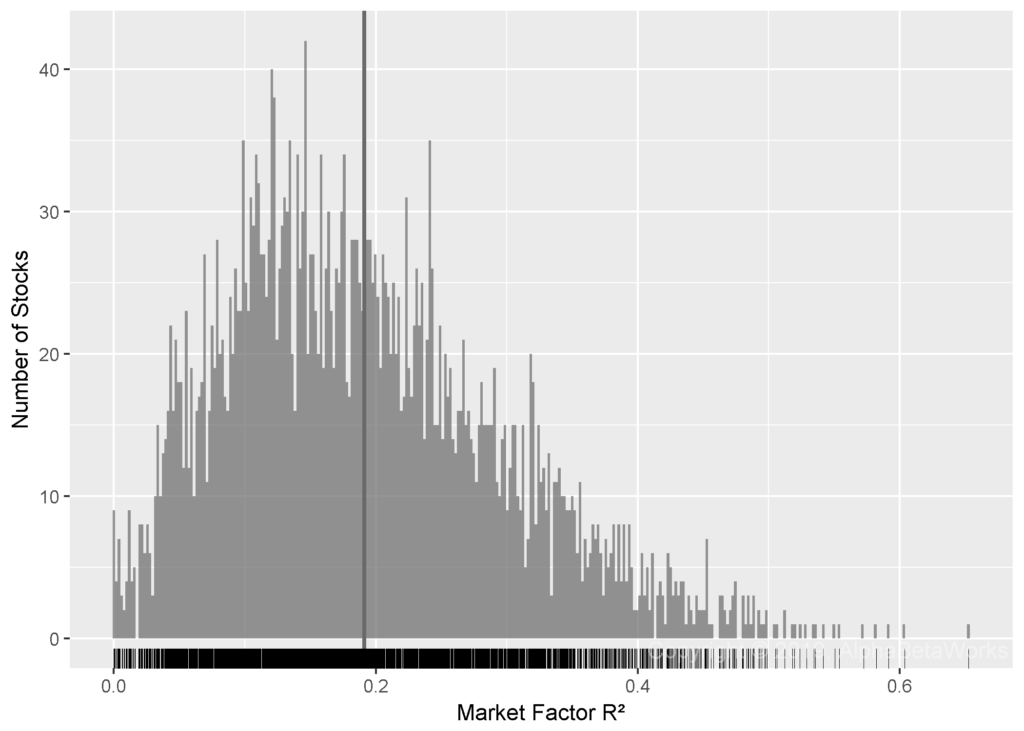
Min.    1st Qu.  Median    Mean    3rd Qu.    Max.
0.0000  0.1117   0.1770    0.1914  0.2563     0.6525
Market explains approximately 20% of the (in-sample) variance of stock returns. The tests below analyze the out-of-sample (investable) market residuals that this step produces.
The Explanatory Power of Sectors for U.S. Stock Returns
The chart below plots the distribution of R² from the regressions of U.S. stocks’ market residuals against sector factors:
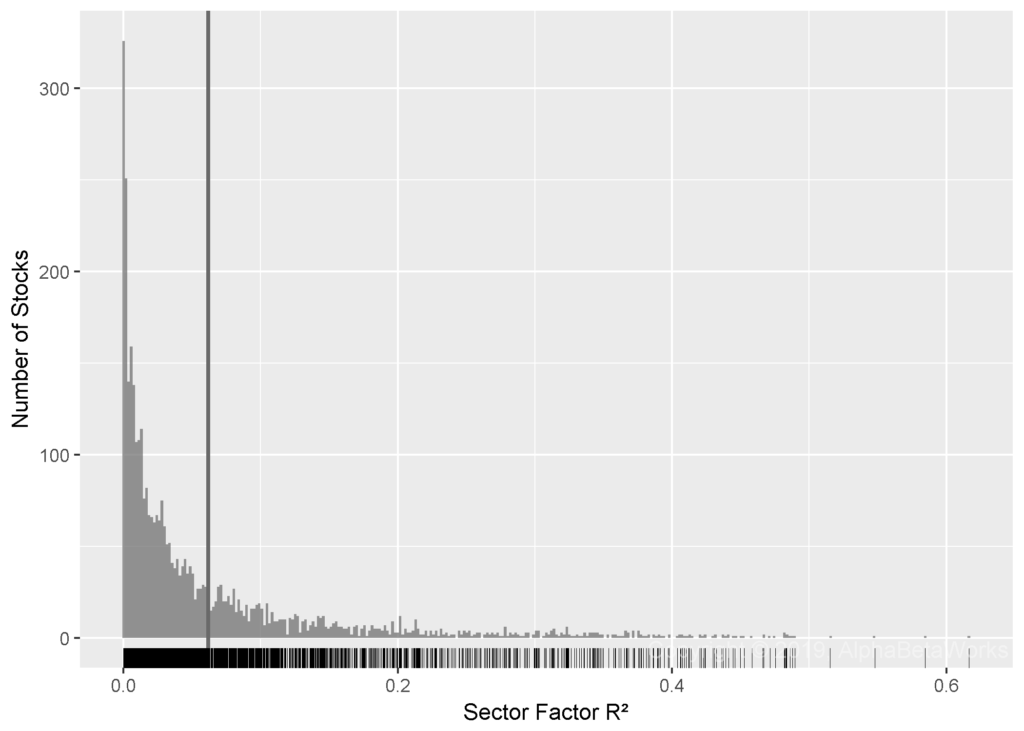
Min.    1st Qu.  Median    Mean    3rd Qu.    Max.
0.0000  0.0070   0.0267    0.0618  0.0767     0.6166
For most stocks, sectors explain 2.7% or more of return variance, after controlling for market risk. The average effectiveness is statistically much higher, since sectors explain a large fraction of return variance for some stocks (e.g., Energy sector for Exxon Mobil).
The Explanatory Power of Size for U.S. Stock Returns
The following chart plots the distribution of R² from the regressions of U.S. stocks’ market residuals against the Size factor:
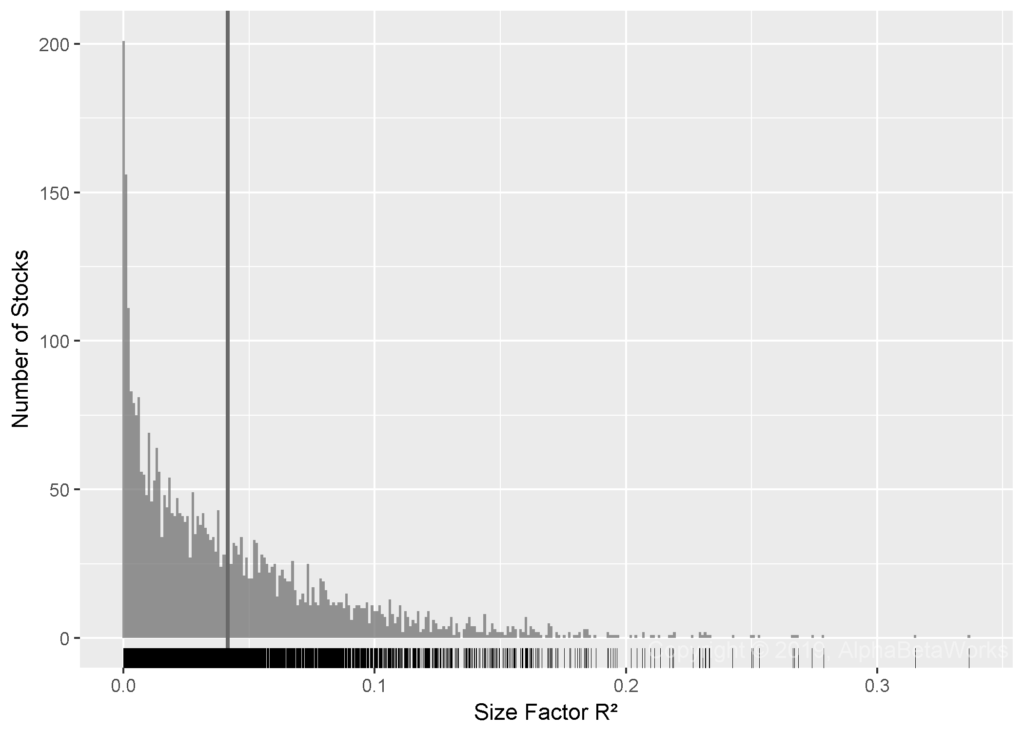
Min.    1st Qu.  Median    Mean    3rd Qu.    Max.
0.0000  0.0089   0.0290    0.0415  0.0599     0.3366
These results support the popularity of the size factor in academic research. For most stocks, the size factor explains 2.9% or more of return variance, after controlling for market risk. Nevertheless, the average explanatory power of sectors is approximately 1.5 times greater.
The Explanatory Power of Value for U.S. Stock Returns
The following chart plots the distribution of R² from the regressions of U.S. stocks’ market residuals against the Value factor:
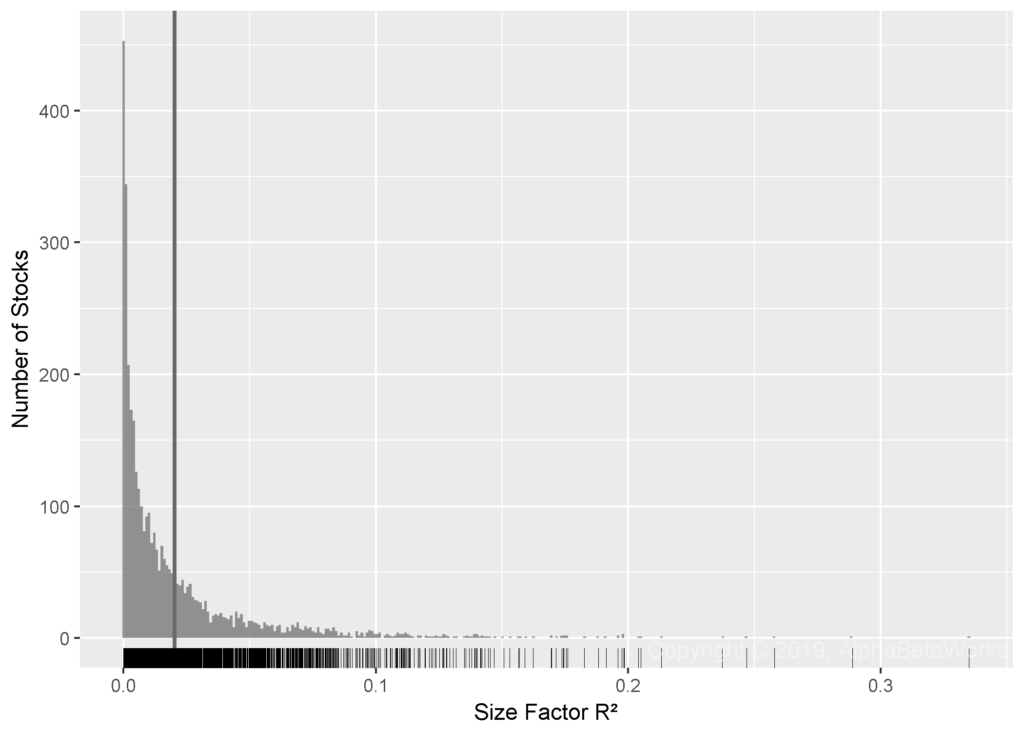
Min.    1st Qu.  Median    Mean    3rd Qu.    Max.
0.0000  0.0020   0.0092    0.0202  0.0251     0.3350
Contrary to its vogue in academic research, the explanatory power of Value is low, even in these in-sample results. The Value factor explains less than 1% of return variance, after controlling for market risk. Even for the 25% of stocks where the value factor has the greatest explanatory power, it only explains about 2.5% of return variance.
Notes on the Quantitative Methodology
This study controls for market risk before analyzing the explanatory power of sector and style factors. This two-step approach is necessary to avoid the multicollinearity problems that plague academic research into style factors. Since small and large companies typically have different market betas, and since cheap and expensive companies also typically have different market betas, the Fama-French and Carhart factors are collinear. Though this multicollinearity does not necessarily undermine the overall model, it does render individual factor betas and associated statistics meaningless.
We measured the in-sample explanatory power of various factors, similarly to typical academic research on the subject. These results are theoretical and do not represent practically attainable investment outcomes – they are the upper bound for out-of-sample explanatory power: This approach calculates factor exposures and residuals using a regression of stock returns on one or more factors. For instance, the regression of AAPL in the 4-factor Carhart model for 2010-2015 produces betas and alphas that are un-investable. To realize this alpha, one would need to know 2014 returns in order to effectively hedge AAPL in 2010. We use a similar approach in this study, and our analysis suffers from the same limitations – the results are in-sample.
Conclusions
- Academic analysis favors factors with less explanatory power than industry’s real-world modeling.
- The explanatory power of sectors is slightly higher than that of size, and approximately four times greater than that of value/growth.
- Portfolio construction and manager allocation with sector, rather than style building blocks, provide greater control over systematic risk.
- Risk models that seek to capture effectively systematic risk should account for sector or industry risk before style risk.
- Sectors’ higher explanatory power holds across different industry classifications and style factor definitions.
The information herein is not represented or warranted to be accurate, correct, complete or timely. Past performance is no guarantee of future results. Copyright © 2012-2019, AlphaBetaWorks, a division of Alpha Beta Analytics, LLC. All rights reserved. Content may not be republished without express written consent.


