
Plagued by overfitting and collinearity, returns-based style analysis frequently fails, confusing noise with portfolio risk.
Returns-based style analysis (RBSA) is a common approach to investment risk analysis, performance attribution, and skill evaluation. Returns-based techniques perform regressions of returns over one or more historical periods to compute portfolio betas (exposures to systematic risk factors) and alphas (residual returns unexplained by systematic risk factors). The simplicity of the returns-based approach has made it popular, but it comes at a cost – RBSA fails for active portfolios. In addition, this approach is plagued by the statistical problems of overfitting and collinearity, frequently confusing noise with systematic portfolio risk.
Returns-Based Style Analysis – Failures for Active Portfolios
In an earlier article we illustrated the flaws of returns-based style analysis when factor exposures vary, as is common for active funds:
- Returns-based analysis typically yields flawed estimates of portfolio risk.
- Returns-based analysis may not even accurately estimate average portfolio risk.
- Errors will be most pronounced for the most active funds:
- Skilled funds may be deemed unskilled.
- Unskilled funds may be deemed skilled.
These are not the only flaws. We now turn to the subtler and equally critical issues – failures in the underlying regression analysis itself. We use a recent Morningstar article as an example.
iShares Core High Dividend ETF (HDV) – Returns-Based Style Analysis
A recent Seeking Alpha article provides an excellent illustration of problems created by overfitting and collinearity. In this article, Morningstar performed a returns-based style analysis of iShares Core High Dividend ETF (HDV).
Morningstar estimated the following factor exposures for HDV using the Carhart model:
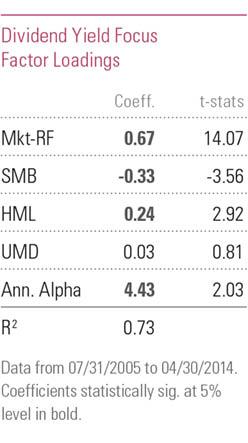
iShares Core High Dividend ETF (HDV) – Estimated Factor Exposures Using the Carhart Model – Source: Morningstar
The Mkt-RF coefficient, or loading, is HDV’s estimated market beta. A beta value of 0.67 means that given a +1% change in the market HDV is expected to move by +0.67%, everything else held constant.
The article then performs RBSA using an enhanced Carhart + Quality Minus Junk (QMJ) model:
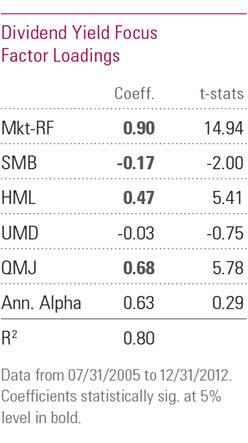
iShares Core High Dividend ETF (HDV) – Estimated Factor Exposures Using the Carhart + Quality Minus Junk (QMJ) Model – Source: Morningstar
With the addition of the QMJ factor, the market beta estimate increased by a third from 0.67 to 0.90. Both estimates cannot be right. Perhaps the simplicity of the Carhart model is to blame and the more complex 5-factor RBSA is more accurate?
iShares Core High Dividend ETF (HDV) – Historical Factor Exposures
Instead of Morningstar’s RBSA approach, we analyzed HDV’s historical holdings using the AlphaBetaWorks’ U.S. Equity Risk Model. For each month, we estimated the U.S. Market exposures (betas) of individual positions and aggregated these into monthly estimates of portfolio beta:
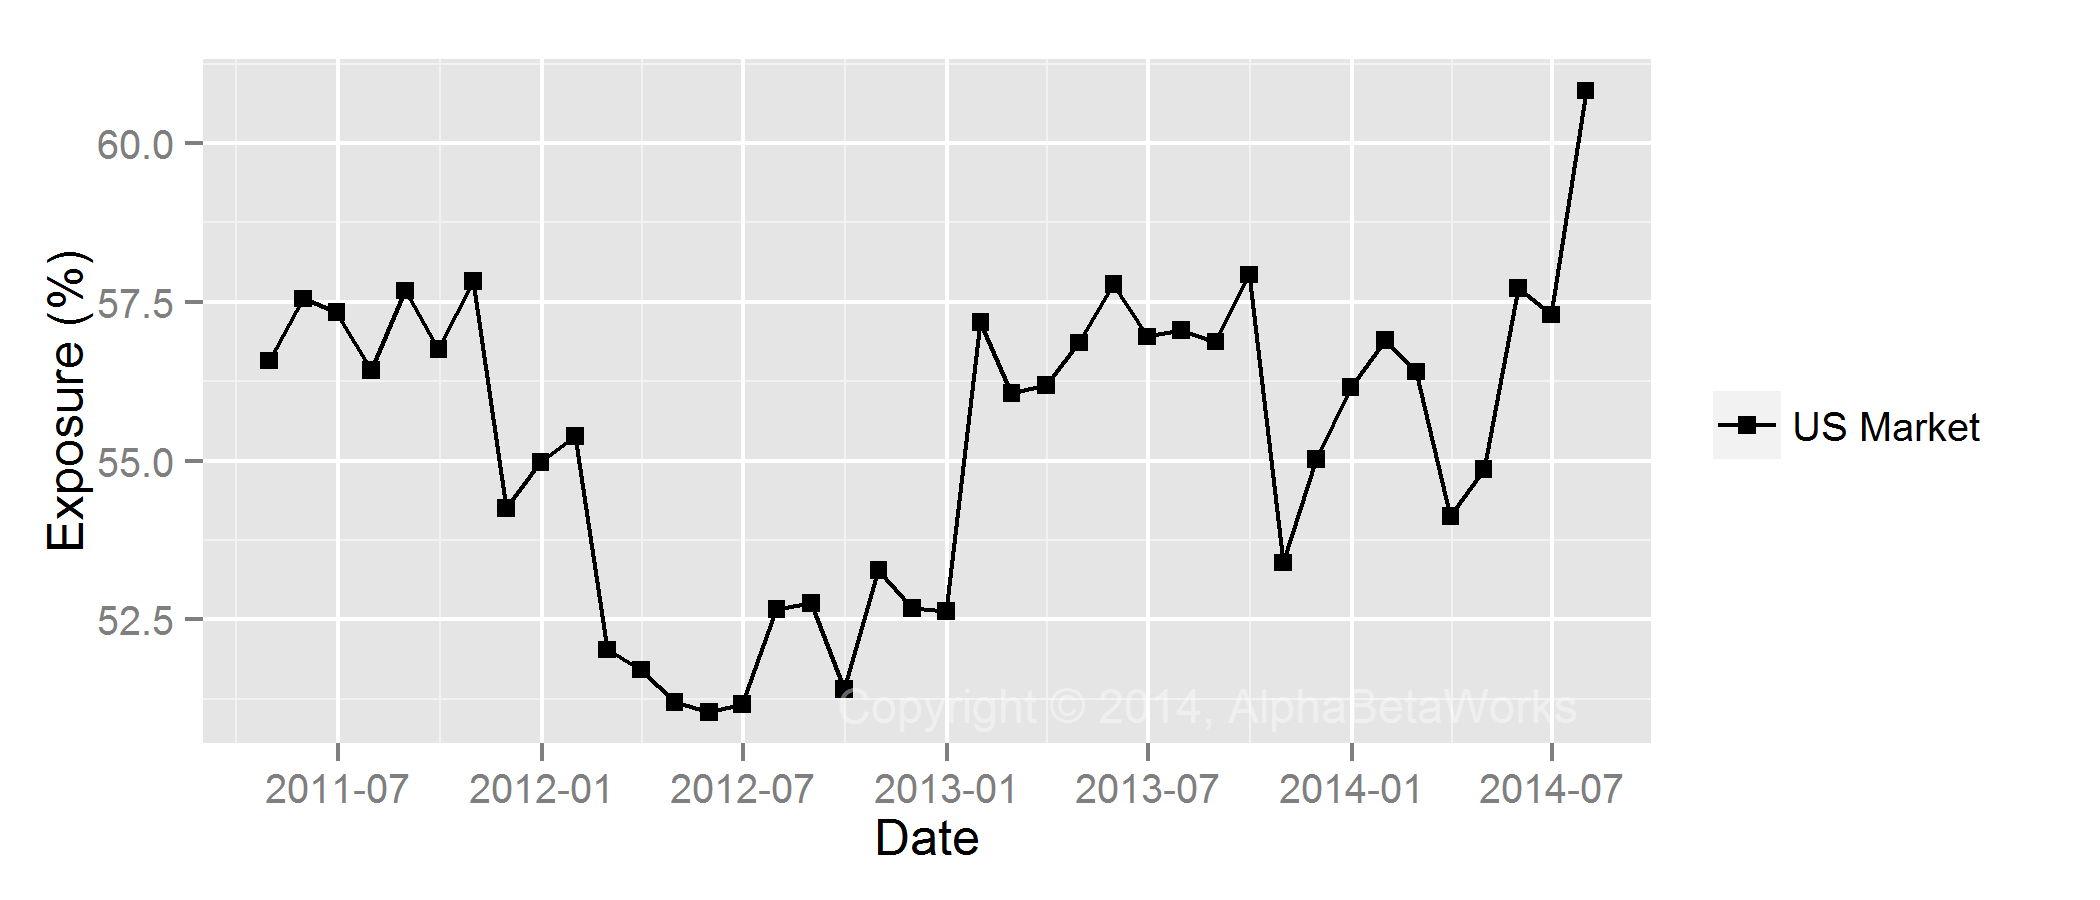
iShares Core High Dividend ETF (HDV) – Historical Market Exposure (Beta)
Over the past 4 years, HDV’s market beta varied in a narrow range between 0.50 and 0.62.
Both of the above returns-based analyses were off, but the simpler Carhart model did best. It turns out the simpler and a less sophisticated returns-based model is less vulnerable to the statistical problems of multicollinearity and overfitting. Notably, the only way to find out that returns-based style analysis failed was to perform the more advanced holdings-based analysis using a multi-factor risk model.
Statistical Problems with Returns-Based Analysis
Multicollinearity
Collinearity (Multicollinearity) occurs when risk factors used in returns-based analysis are highly correlated with each other. For instance, small-cap stocks tend to have higher beta than large-cap stocks, so the performance of small-cap stocks relative to large-cap stocks is correlated to the market.
Erratic changes in the factor exposures for various time periods, or when new risk factors are added, are signs of collinearity. These erratic changes make it difficult to pin down factor exposures and are signs of deeper problems:
A principal danger of such data redundancy is that of overfitting in regression analysis models.
-Wikipedia
Overfitting
Overfitting is a consequence of redundant data or model over-complexity. These are common for returns-based analyses which usually attempt to explain a limited number of return observations with a larger number of correlated variable observations.
An overfitted returns-based model may appear to describe data very well. But the fit is misleading – the exposures may be describing noise and will change dramatically under minor changes to data or factors. A high R squared from returns-based models may be a sign of trouble, rather than a reassurance.
As we have seen with the HDV example above, exposures estimated by RBSA may bear little relationship to portfolio risk. Therefore, all dependent risk and skill data will be flawed.
Conclusions
- When a manager does not vary exposures to the market, sector, and macroeconomic factors, returns-based style analysis (RBSA) using a parsimonious model can be effective.
- When a manager varies bets, RBSA typically yields flawed estimates of portfolio risk.
- Even when exposures do not vary, returns-based style analysis is vulnerable to multicollinearity and overfitting:
- The model may capture noise, rather than the underlying factor exposures.
- Factor exposures may vary erratically among estimates.
- Estimates of portfolio risk will be flawed.
- Skilled funds may be deemed unskilled.
- Unskilled funds may be deemed skilled.
- Holdings-based analysis using a robust multi-factor risk model is superior for quantifying fund risk and performance.


Well said, and it is a reason why I tell people to avoid the approach. Another reason is that statistical tests are inconclusive because the error term is non-normal.