
Rapid asset flows into smart beta strategies have led to concerns about froth and a vigorous debate among systematic portfolio vendors. At the same time, few discussions of smart beta crowding are burdened by data on the aggregate risk of smart beta strategies. This article attempts to remedy this data vacuum. We survey the risk factors and the stocks responsible for U.S. smart beta crowding. In doing so, we identify the exposures that would benefit the most from further asset flows into smart beta portfolios and those that would suffer the most from any outflows:
- The most crowded factor (systematic) exposures are short Size (overweight smaller companies) and short (underweight) Technology Factors.
- The most crowded residual (idiosyncratic, or stock-specific) exposures are short (underweight) FAANG stocks.
- Exposures to dumb factors account for over 80% of smart beta crowding.
Our findings refute many common beliefs about smart beta crowding.
It follows that the vigorous performance of Technology shares and FAANG stocks specifically has been in spite of, rather than due to, the asset flows into smart beta strategies. Instead, the principal beneficiaries of such inflows and the most crowded smart beta bet have been smaller companies. Smart beta strategies tend to overweight smaller companies relative to the passive (capitalization-weighted) Market Portfolio. Consequently, smaller companies are most at risk should the flows into smart beta reverse. Given its importance, allocators and portfolio managers should pay particular attention to this Size Factor crowding.
Identifying Smart Beta Crowding
This article applied AlphaBetaWorks’ pioneering analysis of Hedge Fund Crowding to U.S. smart beta equity ETFs. We aggregated the Q2 2017 positions of over 300 U.S. smart beta equity ETFs with approximately $700 billion in total assets. We combined all portfolios into a single position-weighted portfolio – U.S. Smart Beta Aggregate (USSB Aggregate). We then used the AlphaBetaWorks (ABW) Statistical Equity Risk Model – an effective predictor of future risk – to analyze USSB Aggregate’s risk relative to the iShares Russell 3000 ETF (IWV) benchmark. The benchmark is a close proxy for the passive U.S. Equity Market portfolio.
We find that a small number of active bets are behind the aggregate risk and performance of U.S. smart beta ETFs. Our analysis assumes that the U.S. smart beta ETF universe is a good proxy for the total smart beta strategy universe. In this case, the analysis captures overall U.S. smart beta crowding.
Factor and Residual Components of U.S. Smart Beta Crowding
USSB Aggregate has approximately 1% estimated future volatility (tracking error) relative to the Market. Over 80% of this relative risk is due to factor exposures, or factor crowding. This high share of factor crowding is consistent with our earlier findings that the bulk of absolute and relative risk of most smart beta ETFs is due to traditional, or dumb, factors such as Market and Sectors:
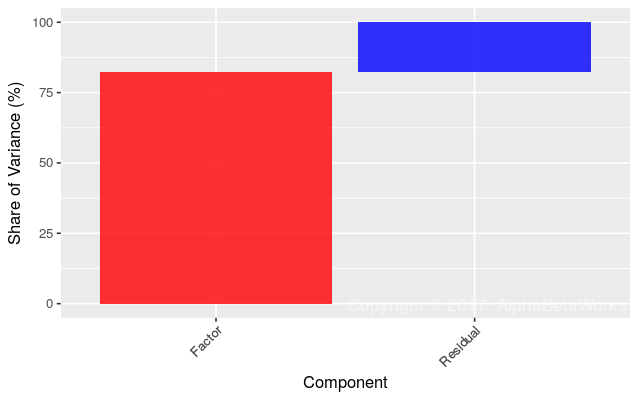
Components of U.S. Smart Beta Crowding in Q2 2017
| Source | Volatility (ann. %) | Share of Variance (%) |
| Factor | 0.84 | 82.45 |
| Residual | 0.39 | 17.55 |
| Total | 0.92 | 100.00 |
Given how close the aggregate smart beta ETF portfolio is to the Market, closet indexing is a concern, especially for diversified smart beta portfolios. The little active risk that remains is primarily due to the two dumb factor exposures discussed below.
U.S. Smart Beta Factor (Systematic) Crowding
The following chart shows the main factor exposures of USSB Aggregate in red relative to U.S. Market’s exposures in gray:

Significant Absolute and Relative Factor Exposures of U.S. Smart Beta Aggregate in Q2 2017
The main active bet of the smart beta universe is short exposure to the Size Factor (overweighting of smaller companies). Thus, smart beta crowding is largely a bet against market-cap weighting and in favor of smaller companies. This crowded bet is the natural consequence of most modified-weighting schemes that de-emphasize larger companies.
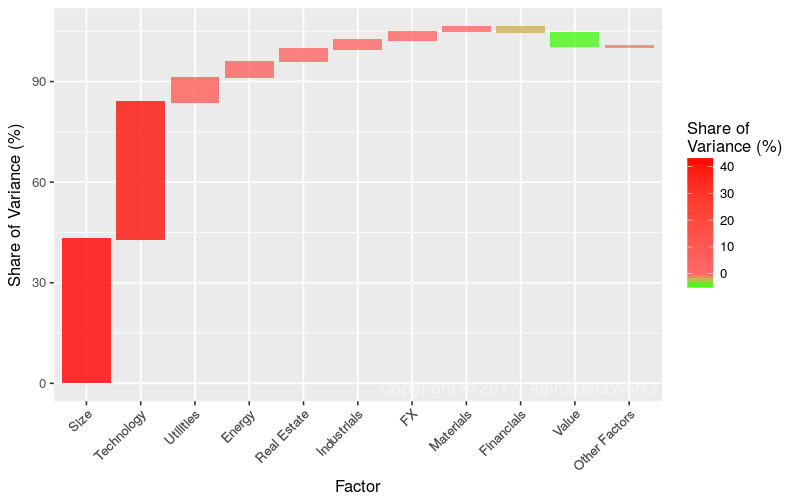
Factors Contributing Most to Relative Factor Variance of U.S. Smart Beta Aggregate in Q2 2017
| Factor | Relative Exposure | Factor Volatility | Share of Relative Factor Variance | Share of Relative Total Variance |
| Size | -5.58 | 9.62 | 42.83 | 35.31 |
| Technology | -6.85 | 6.39 | 40.74 | 33.59 |
| Utilities | 1.88 | 12.72 | 7.44 | 6.14 |
| Energy | 0.84 | 13.06 | 4.73 | 3.90 |
| Real Estate | 0.99 | 12.40 | 3.79 | 3.13 |
| Industrials | 1.22 | 4.72 | 2.67 | 2.20 |
| FX | 2.49 | 6.77 | 2.46 | 2.03 |
| Materials | 0.80 | 7.88 | 1.39 | 1.15 |
| Financials | -1.28 | 7.90 | -1.70 | -1.40 |
| Value | -1.08 | 15.20 | -4.04 | -3.33 |
(Relative exposures and relative variance contribution. All values are in %. Volatility is annualized.)
The short Size Factor smart beta crowding accounts for approximately twice the risk of stock-specific crowding. Consequently, smaller companies stand to lose, and larger companies stand to benefit, on average, from smart beta strategy outflows. The short (underweight) Technology bet is nearly as important.
U.S. Smart Beta Residual (Idiosyncratic) Crowding
The remaining fifth of U.S. smart beta crowding as of 6/30/2017 was due to residual (idiosyncratic, stock-specific) risk:
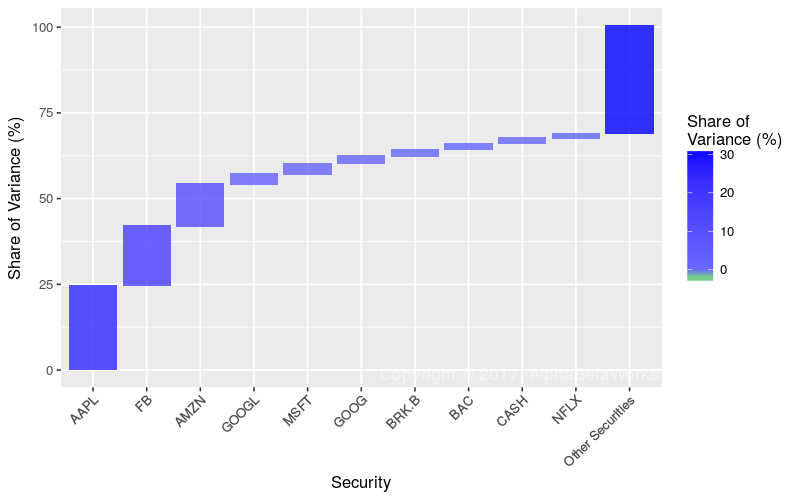
Stocks Contributing Most to Relative Residual Variance of U.S. Smart Beta Aggregate in Q2 2017
| Symbol | Name | Relative Exposure | Residual Volatility | Share of Relative Residual Variance | Share of Relative Total Variance |
| AAPL | Apple Inc. | -1.43 | 13.37 | 24.43 | 4.29 |
| FB | Facebook, Inc. A | -0.67 | 24.17 | 17.39 | 3.05 |
| AMZN | Amazon.com, Inc. | -0.74 | 18.23 | 12.17 | 2.13 |
| GOOGL | Alphabet Inc. A | -0.52 | 12.83 | 3.04 | 0.53 |
| MSFT | Microsoft Corporation | -0.56 | 11.78 | 2.96 | 0.52 |
| GOOG | Alphabet Inc. C | -0.54 | 10.72 | 2.25 | 0.39 |
| BRK.B | Berkshire Hathaway B | -0.69 | 7.55 | 1.82 | 0.32 |
| BAC | Bank of America Corporation | -0.46 | 11.08 | 1.77 | 0.31 |
| CASH | Meta Financial Group | 0.22 | 22.74 | 1.68 | 0.29 |
| NFLX | Netflix, Inc. | -0.11 | 40.32 | 1.23 | 0.21 |
(Relative exposures and relative variance contribution. All values are in %. Volatility is annualized.)
The main source of residual U.S. smart beta crowding is short (underweight) exposure to AAPL, FB, AMZN, and GOOGL – the principal members of the FAANG club. The Strong performance of these stocks has been despite, rather than due to, flows into smart beta strategies. On a relative basis, FAANGs have suffered from smart beta asset inflows and, all else equal should outperform in the case of outflows from smart beta strategies.
Summary
- Factor (systematic) exposures that capture risks shared by many stocks, rather than individual stocks, are responsible for over 80% of U.S. smart beta crowding.
- The most crowded smart beta bet is short Size Factor exposure (overweighting of smaller companies). Thus, smaller companies stand to lose from smart beta strategy outflows.
- The most crowded residual smart beta bet is short exposure to (underweighting of) FAANG stocks. Therefore, FAANG stocks should be relative beneficiaries of any smart beta outflows.


Thanks, this is interesting, though Smart Beta investors are only a few percent of the total market. The opposite side of the trade here are growthy mutual fund asset managers and private asset owners (Bezos, Buffett, Brin, etc.).
Yes, smart beta ETFs are indeed a small fraction of the U.S. Equity Market: ~$0.7Tn/~$25Tn=3%. However, smart beta ETFs are just the tip of the smart beta strategy AUM iceberg. For example, RAFI claims $184Bn in assets managed “using investment strategies developed by Research Affiliates”, yet has only ~$10Bn in its ETFs. Adjusting to this firm alone rises smart beta assets to ~4%.
Though RAFI is an extreme example, our experience with other portfolio vendors confirms that ETFs capture a small fraction of assets tracking a given smart beta strategy. The whole is certainly over 5% and likely well over 10% of the Market.
Very interesting article. Runs counter to Fama French , Dimensionsal Funds approach in current market.
Thank you for the feedback. Can you provide some additional detail on the conflicts you found with Fama French?
Our research should be mostly orthogonal, rather than contrary, to Fama French family of models and analysis based on them — these models are rarely used in the leading commercial risk solutions due to various shortcomings.