Whereas hedge fund crowding primarily consists of systematic factor bets, most analysis of hedge fund crowding focuses solely on popular positions. Moreover, such analysis usually assumes that hedge fund crowding in individual stocks is a bullish indicator. This article illustrates the flaws of these common assumptions, identifies the principal sources of hedge fund crowding, and discusses the opportunities that this crowding presents:
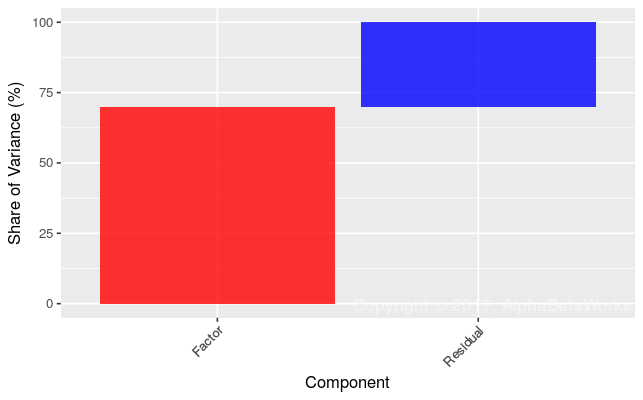
- Factor (systematic) exposures, rather than individual stocks, account for 70% of the crowding.
- Residual (idiosyncratic, or stock-specific) bets account for just 30% of hedge fund crowding.
- Simplistic analysis of crowding in individual stocks overlooks the majority of crowding risk.
- Crowded hedge fund factor bets have been experiencing steep losses since 2015 and have been attractive shorts.
- Crowded hedge fund stock-specific bets have been attractive longs following the 2014-2015 liquidations and the subsequent recovery, but the trend appears to have ended.
Identifying Hedge Fund Crowding
The analysis of hedge fund crowding in this article follows the approach of our earlier studies: We started with a decade of hedge fund Form 13F filings. Form 13F discloses positions of firms with long U.S. assets over $100 million. We only considered funds with a sufficiently low turnover to be analyzable from filings, and our database is free of survivorship bias. This sample included approximately 1,000 firms. We combined all portfolios into a single position-weighted portfolio – HF Aggregate. We then used the AlphaBetaWorks (ABW) Statistical Equity Risk Model – an effective predictor of future risk – to analyze HF Aggregate’s risk relative to the U.S. Market (represented by the iShares Russell 3000 ETF (IWV) benchmark), identify the crowded exposures, and analyze their performance trends.
Factor and Residual Components of Hedge Fund Crowding
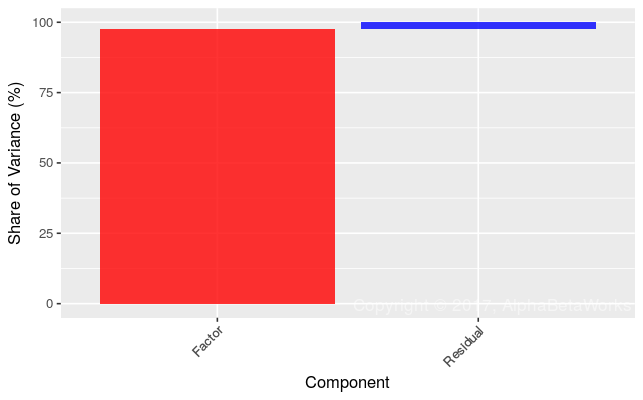
Virtually all of HF Aggregate’s absolute risk is systematic. Thus, the aggregate long U.S. equity holdings of hedge funds will very nearly track a passive factor portfolio with similar risk:
| Source | Volatility (ann. %) | Share of Variance (%) |
| Factor | 11.80 | 97.78 |
| Residual | 1.78 | 2.22 |
| Total | 11.93 | 100.00 |
HF Aggregate has 2.8% estimated future volatility (tracking error) relative to the Market. Approximately 70% of this relative risk is due to factor crowding:
| Source | Volatility (ann. %) | Share of Variance (%) |
| Factor | 2.37 | 69.90 |
| Residual | 1.55 | 30.10 |
| Total | 2.83 | 100.00 |
Consequently, simplistic analysis of hedge fund crowding that focuses on the popular holdings and position overlap is fatally flawed. It will capture less than a third of the crowding risk that is stock-specific and will overlook the bulk that is systematic.
Stock Picking and Market Timing Returns from Crowding
Crowded factor and residual bets go through cycles of outperformance and underperformance, depending on capital flows. These trends can provide attractive investment opportunities: short during liquidation, and long during expansion.
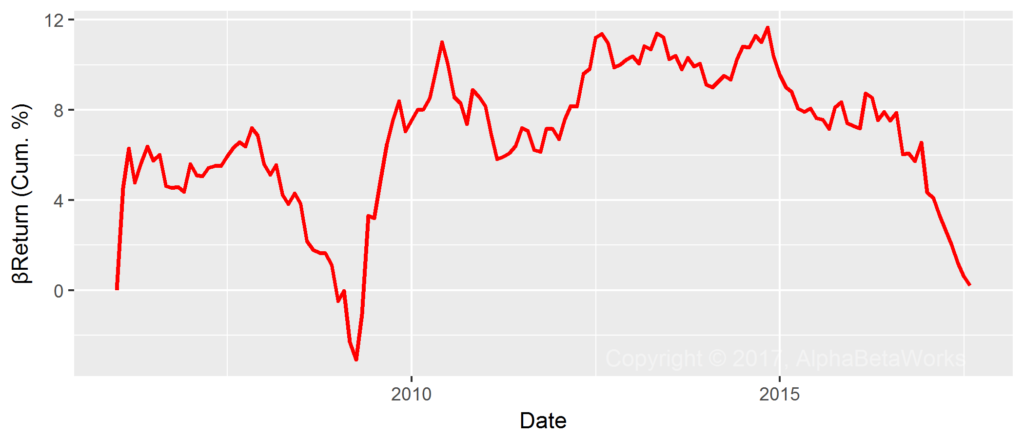
The following chart shows HF Aggregate’s cumulative βReturn (risk-adjusted returns from factor timing). Crowded hedge fund factor bets have experienced steep and accelerating losses since 2015. We identified these factors in earlier research as attractive short candidates, and the downtrend has persisted:
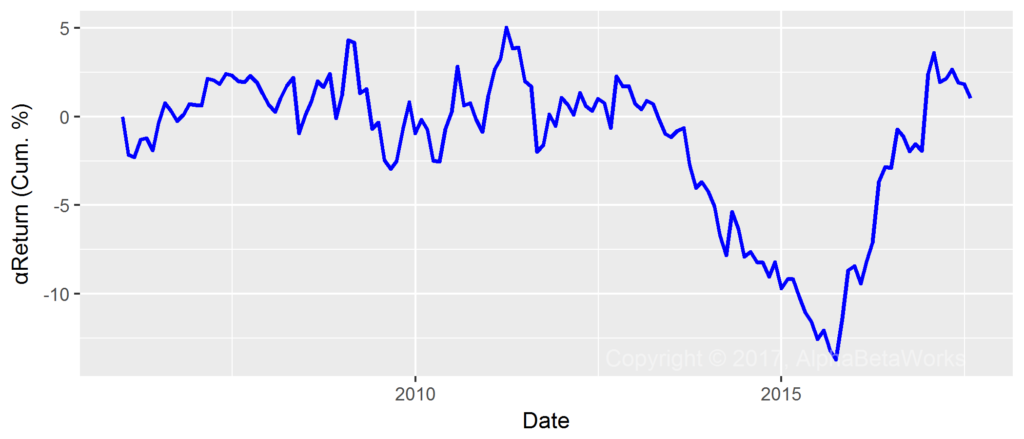
The following chart shows HF Aggregate’s cumulative αReturn (risk-adjusted returns from security selection). Following the unprecedented losses on crowded residual bets during 2011-2015, we advised long exposures to these beaten-down stocks in late-2015. The subsequent recovery has been spectacular but now appears over. Thus, the crowded hedge fund residual bets no longer seem to offer clear long or short opportunities:
The rest of this article considers the crowded factor and residual bets responsible for the above trends.
Hedge Fund Factor (Systematic) Crowding
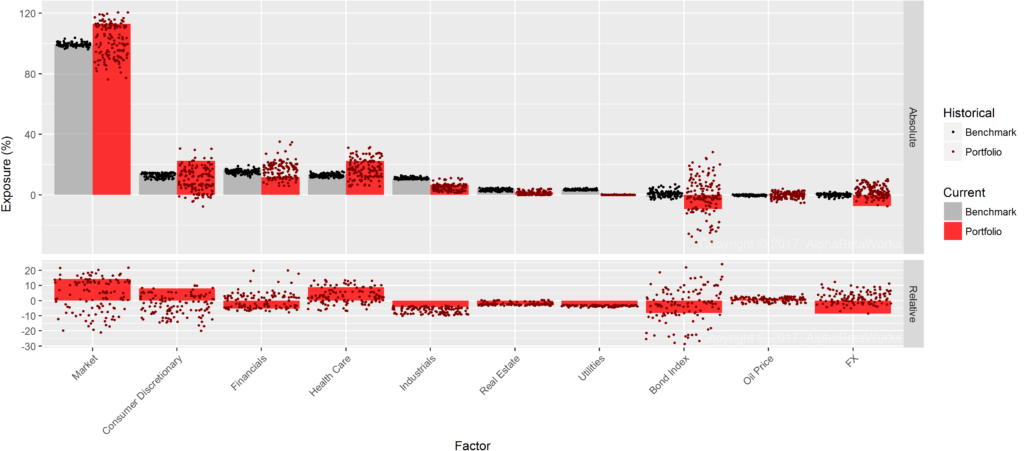
The following chart shows the main sources of hedge fund factor crowding as of 6/30/2017 in red relative to U.S. Market’s exposures in gray:
The dominant hedge fund long equity bet is Market (high Beta). Thus, the most crowded bet is high overall market risk, rather than a specific stock. Like a leveraged ETF, HF Aggregate outperforms when the Market is up and underperforms when it is down.
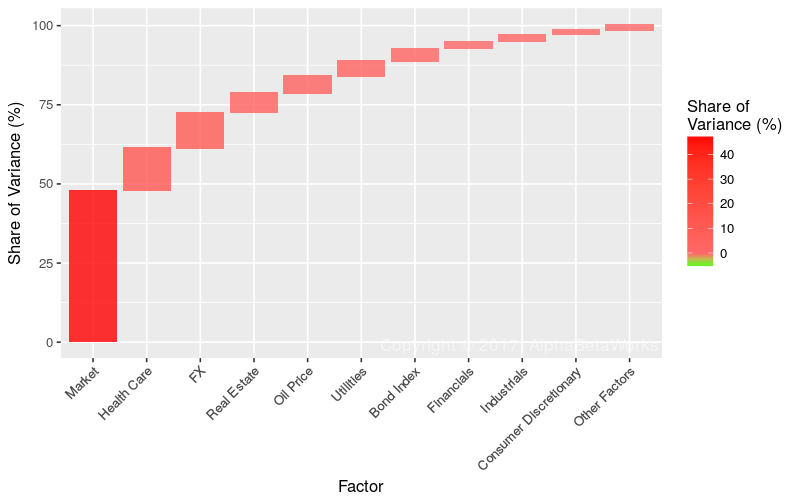
| Factor | Relative Exposure | Factor Volatility | Share of Relative Factor Variance | Share of Relative Total Variance |
| Market | 14.05 | 9.80 | 47.63 | 33.29 |
| Health Care | 8.72 | 7.75 | 13.41 | 9.37 |
| FX | -8.49 | 6.77 | 11.35 | 7.93 |
| Real Estate | -2.54 | 12.40 | 6.11 | 4.27 |
| Oil Price | 1.11 | 29.50 | 5.30 | 3.71 |
| Utilities | -3.17 | 12.72 | 4.89 | 3.42 |
| Bond Index | -8.12 | 3.41 | 3.86 | 2.70 |
| Financials | -5.29 | 7.90 | 2.23 | 1.56 |
| Industrials | -4.15 | 4.72 | 2.17 | 1.51 |
| Consumer Discretionary | 8.11 | 4.31 | 1.51 | 1.06 |
(Relative exposures and relative variance contribution. All values are in %. Volatility is annualized.)
In fact, crowding in the simple Market Factor alone accounts for more risk than all the stock-specific crowding combined.
Despite recent losses, HF Aggregate’s Health Care Factor exposure remains near the recent record levels.
Hedge Fund Residual (Idiosyncratic) Crowding
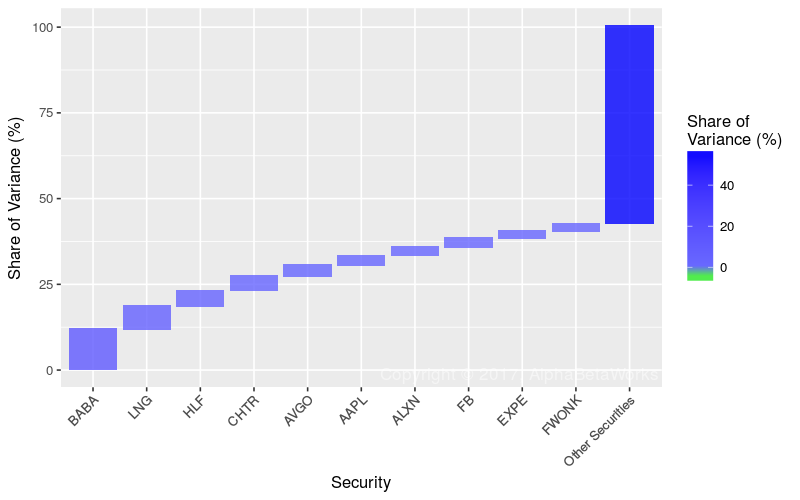
The remaining 30% of hedge fund crowding as of 6/30/2017 was due to residual (idiosyncratic, stock-specific) risk:
| Symbol | Name | Relative Exposure | Residual Volatility | Share of Relative Residual Variance | Share of Relative Total Variance |
| BABA | Alibaba Group Holding ADR | 2.23 | 23.93 | 11.82 | 3.56 |
| LNG | Cheniere Energy, Inc. | 1.44 | 27.51 | 6.54 | 1.97 |
| HLF | Herbalife Ltd. | 0.92 | 36.18 | 4.59 | 1.38 |
| CHTR | Charter Communications, Inc. | 1.66 | 19.10 | 4.15 | 1.25 |
| AVGO | Broadcom Limited | 1.32 | 21.20 | 3.24 | 0.98 |
| AAPL | Apple Inc. | -1.96 | 13.37 | 2.84 | 0.86 |
| ALXN | Alexion Pharmaceuticals, Inc. | 0.85 | 29.14 | 2.52 | 0.76 |
| FB | Facebook, Inc. Class A | 1.01 | 24.17 | 2.47 | 0.74 |
| EXPE | Expedia, Inc. | 1.08 | 21.31 | 2.21 | 0.66 |
| FWONK | Liberty Media Corporation Formula One | 0.91 | 24.90 | 2.11 | 0.64 |
(Relative exposures and relative variance contribution. All values are in %. Volatility is annualized.)
Following the 2011-2015 losses and the subsequent gains, these crowded bets do not offer clear long or short opportunities. Moreover, residual crowding accounts for a small fraction of the industry’s risk. While systematic hedge fund crowding continues to dominate, investors and allocators should focus on managing the crowded factor exposures. Without a firm grasp of factor crowding, investors and fund followers may blindly follow losing bets.
Summary
- Factor (systematic) exposures that capture risks shared by many stocks, rather than individual stocks, are responsible for the majority of hedge fund crowding.
- The main sources of Q2 2017 hedge fund crowding were long U.S. Market (high Beta), long Health Care, and short USD (preference for exporters over importers).
- The crowded factor bets have been in a multi-year bearish trend.
- The crowded residual bets have recovered from steep losses and no longer offer clear opportunities.
- Without a robust analysis of the factor and residual components of crowding, a hedge fund investor, follower, or allocator may be missing the bulk of crowding risk and investing in a generic passive factor portfolio.
The information herein is not represented or warranted to be accurate, correct, complete or timely.
Past performance is no guarantee of future results.
Copyright © 2012-2017, AlphaBetaWorks, a division of Alpha Beta Analytics, LLC. All rights reserved.
Content may not be republished without express written consent.

