And Not Missing Out
Maybe your fund took extra risk to keep up with its benchmark. Maybe your fund should have made more – much more – given the risks it took. By the time market volatility reveals underlying exposures, it may be too late to avoid severe losses. There is a better way: Investors can continuously monitor a fund’s risk, the returns it should be generating, and the value it creates. This value should matter most to investors and allocators. Regrettably, most fund analysis tools and services pay no attention to it.
To illustrate, we analyze two funds: one that did much worse than it should have, and one that did better.
PRSCX – Negative Active Returns
The T. Rowe Price Science & Technology Fund (PRSCX) manages approximately $3 billion. This fund generally tracks its benchmark and it gets 3 star rating from a popular service. Notwithstanding this, PRSCX has produced persistently negative active returns. Given its historical risk, PRSCX should have made investors far more money: Over the past ten years, an investor would have made 50-80% more owning a passive portfolio with PRSCX’s risk profile.
While we seem to bolster arguments for passive investing, reality is more complex: Active returns (both positive and negative) persist over time. Thus, upgrading from PRSCX to a fund with persistently positive active returns is a superior move. We will provide one candidate.
PRSCX – Historical Risk
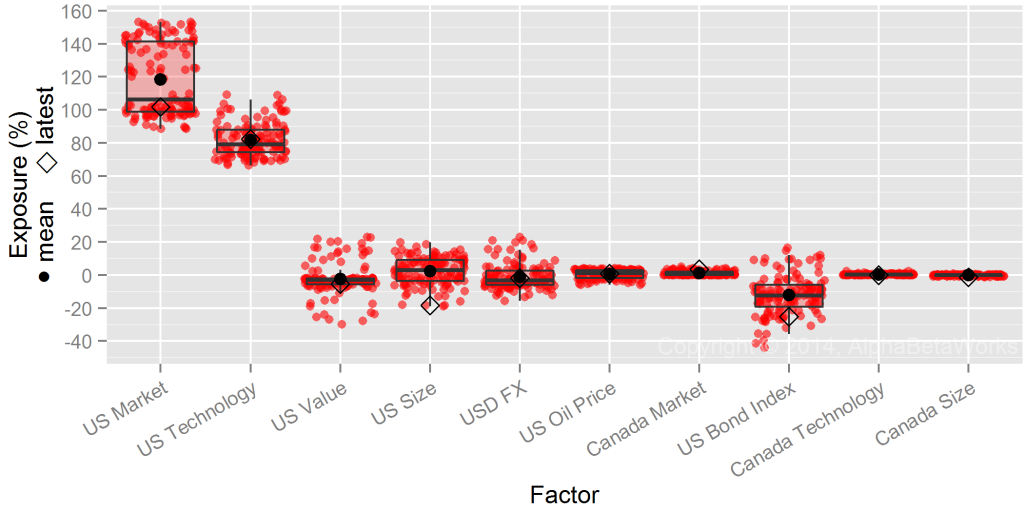
The chart below shows PRSCX’s historical risk (exposures to significant risk factors). The red dots indicate monthly exposures (as a percentage of assets) over the past 10 years; the black diamonds indicate latest exposures:
PRSCX varied its exposures over time. U.S. Market is the most important exposure, reaching 200% (market beta of 2) at times. As expected for a technology fund, its U.S. Technology exposure has been near 100%. Also note PRSCX’s occasional short bond exposure. Many equity funds carry large hidden bond bets due to the risk profile of their equity holdings. Most investors and portfolio managers are not aware of these bets. Yet for these funds, bond risk is a key driver of portfolio returns and volatility.
PRSCX – Historical Active Returns
The above exposures define a passive replicating portfolio matching PRSCX’s risk. The fund manager’s job is to outperform this passive alternative by generating active returns.
To isolate active returns, we quantify passive factor exposures, estimate the passive return, and then calculate the remaining active return – αβReturn. We further break down αβReturn into risk-adjusted return from security selection, or stock picking (αReturn), and market timing (βReturn):
| Component | 2004 | 2005 | 2006 | 2007 | 2008 | 2009 | 2010 | 2011 | 2012 | 2013 | 2014 |
| Total | 1.6 | 2.46 | 7.1 | 11.88 | -43.8 | 67.83 | 21.25 | -4.51 | 6.25 | 43.7 | 9.39 |
| Passive | -0.69 | 1.4 | 5.45 | 19.26 | -46.13 | 77.52 | 23.21 | -3.42 | 20.36 | 51.54 | 13.61 |
| αβReturn | 0.98 | -0.69 | -2.2 | -7.45 | 2.71 | -11.61 | -2.22 | -8.24 | -13.76 | -14.14 | -5.84 |
| αReturn | -1.95 | -3.29 | -6.45 | -2.79 | 7.92 | 0.78 | 4.17 | -12.31 | -11.47 | -4.54 | 1.11 |
| βReturn | 2.94 | 2.6 | 4.25 | -4.66 | -5.2 | -12.39 | -6.39 | 4.07 | -2.29 | -9.6 | -6.95 |
| Undefined | 1.3 | 1.75 | 3.85 | 0.07 | -0.38 | 1.92 | 0.26 | 7.15 | -0.35 | 6.3 | 1.61 |
Note that we are unable to account for trades behind some of the returns – the “Undefined” component. It may be due to private securities or intra-period trading; it may be passive or active. Yet, even if we assume that all undefined returns above are active, PRSCX still delivered persistently negative αβReturn over the past ten years. Furthermore, the compounding of negative αβReturn leaves investors missing out on 50-80% in gains.
FSCSX – An Upgrade Option with Similar Historical Risk
While a passive portfolio would have been superior to PRSCX, it is not the best upgrade. Allocators and investors can do better owning a fund with consistently positive αβReturns, since αβReturns persist. One candidate is Fidelity Select Software & Computer Services Portfolio (FSCSX):

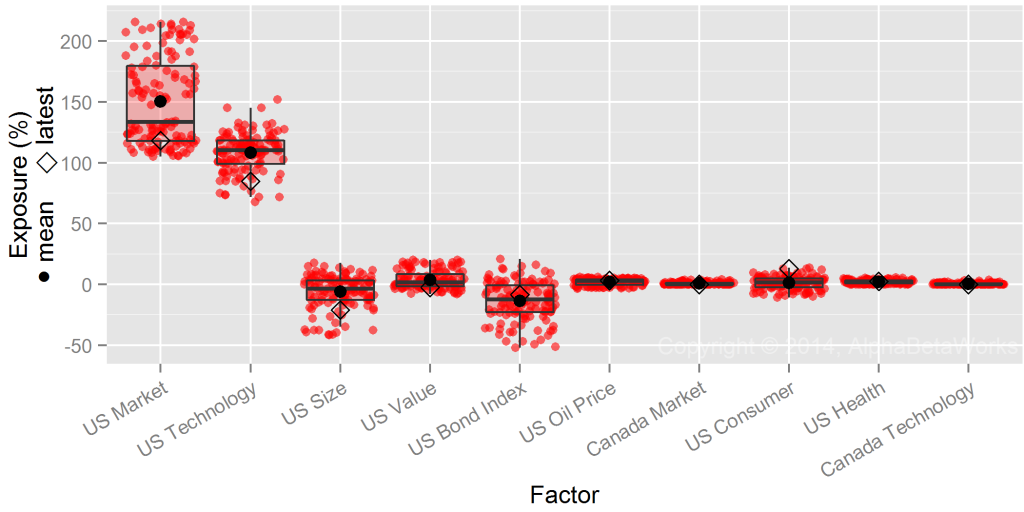
Fidelity Select Software & Computer Services Portfolio (FSCSX) – Exposure to Significant Risk Factors
Currently, FSCSX and PRCSX have similar exposures. AlphaBetaWorks’ risk analytics estimate the current annualized tracking error between the two funds at a 5.29% (about the same volatility as bonds, and less than one half of market volatility).
FSCSX – Historical Active Returns
FSCSX’s 3-year trailing average annual return of 23% is slightly ahead of PRSCX’s 20%. But most importantly, given its lower historical risk, FSCSX has delivered positive αβReturns versus PRSCX’s significantly negative ones. The chart below shows FSCSX’s ten-year performance. The purple area is the positive αβReturn. The gray area is FSCSX’s passive return:
FSCSX is superior to a passive portfolio with similar risk and to PRSCX. Mind you, this is not a sales pitch for FSCSX but merely a consequence of its positive αβReturn and αβReturn persistence.
Few fund investors and allocators possess the tools to quantify active returns. Yet, this knowledge is an essential competitive advantage, leading to improved client returns, client retention, and asset growth. Unfortunately, many are content to pick funds based on past nominal returns and to suffer the consequences: picking yesterday’s winners tends to pick tomorrow’s losers. AlphaBetaWorks spares clients from the data processing headaches, financial modeling, and statistical analysis of thousands of portfolios, delivering predictive risk and skill analytics on thousands of funds.
Conclusions
- Analyzing a fund’s performance relative to a benchmark ignores the most important question: What should you have made given its risk?
- Some mutual funds produce persistently negative active returns; others produce persistently positive active returns.
- Upgrading from a fund with persistently negative active return (αβReturn) to a replicating passive portfolio tends to improve performance.
- Upgrading from a passive portfolio to a fund with persistently positive αβReturn also tends to improve performance.
- Tools that accurately estimate fund risk and active returns provide enduring competitive advantages for investors and professional allocators, leading to improved client returns, client retention, and asset growth.


