Are you Paying Active Fees for Passive Management?
Closet indexing may be practiced by 20% to 50% of “active” medium and lower turnover US mutual funds. To make this case, we improve on traditional holdings- and returns-based closet indexing metrics. Simply by testing for closet indexing, investors can save billions in management fees each year.
Closet Indexing
A 2009 study introduced the concept of Active Share to measure the degree to which a fund is actively managed, showing that active stock pickers outperform closet indexers. Another notable active management metric is R² with respect to a multifactor model. Both metrics have their drawbacks: Active Share relies on vulnerable holdings-based analysis. For example, suppose a manager holds a position in a benchmark ETF; this position will increase Active Share without making the fund more active. R² relies on returns-based analysis, which does not distinguish between passive factor exposures and market timing, among other limitations. Hence, both metrics are susceptible to manipulation and may not properly identify passive funds.
A Robust Approach
The AlphaBetaWorks approach relies on risk and attribution capabilities free of the above issues. We surveyed ten years of historical holdings of approximately 1,700 non-index medium and lower turnover mutual funds with at least 5 years of position history. This group manages over $3.4 trillion in assets. We used our proprietary Statistical Equity Risk Model on historical holdings to estimate fund risk at the end of each month. We then attributed the following month’s returns to factor (market), and residual (security-specific) sources. We compared the variance of residual and factor returns of the group to NASDX, a NASDAQ 100 ETF. We selected this ETF as a passive reference strategy that is more concentrated than broad market benchmarks but less concentrated than granular sector indices. Using an S&P 100 ETF yields similar conclusions.
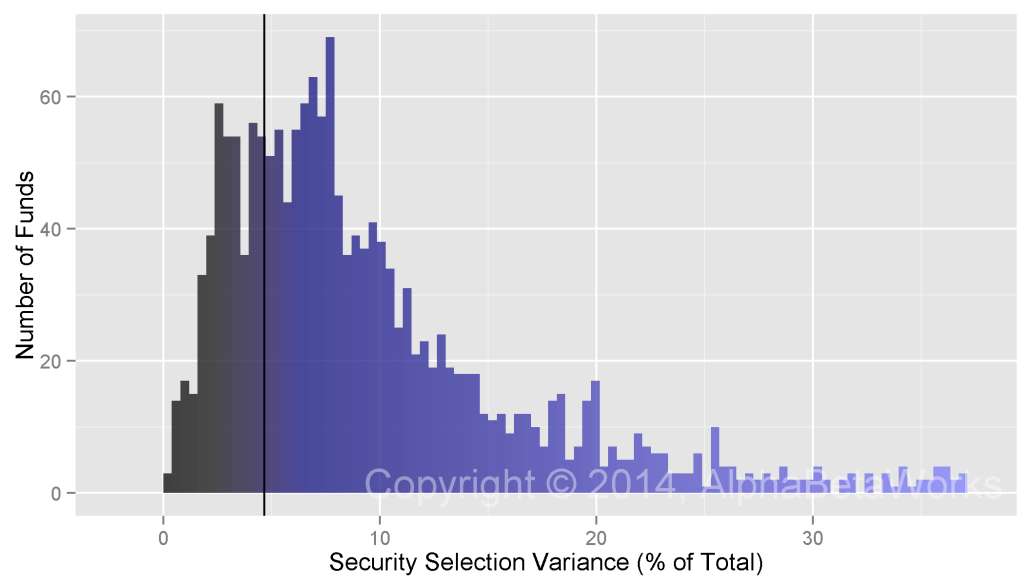
For NASDX, factor exposures at the end of a given month explain approximately 95% of return variance in the following month. The remaining 5% residual variance is due to security selection.
How active are funds in our group compared to this 100-position ETF? A quarter (425 funds) had a lower share of residual variance – they were less active stock pickers:
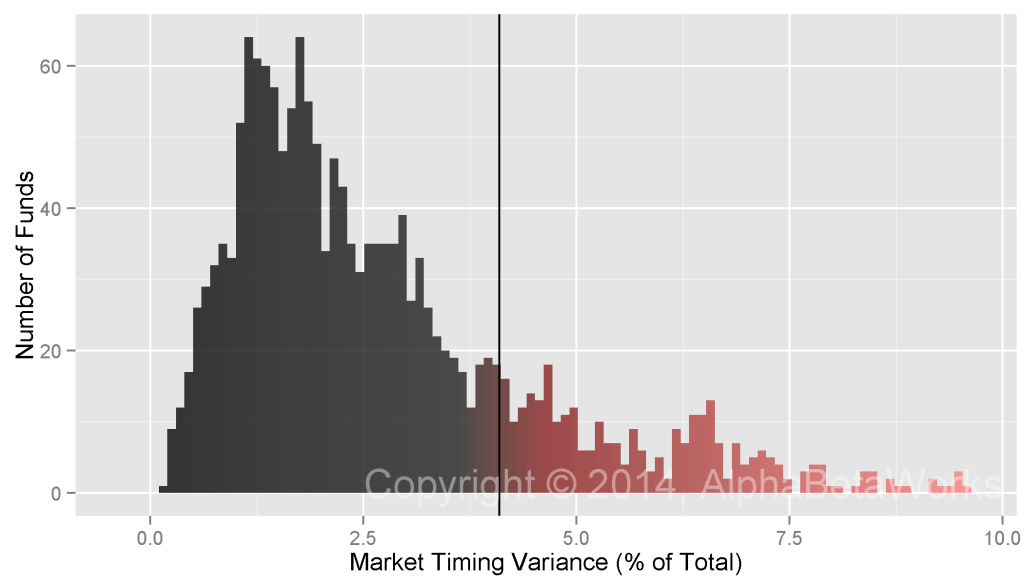
Security selection is not the only source of active performance. The variation in factor exposures, or factor (market) timing, is another. The NASDAX’s historical factor exposures were not constant over the last 10 years. This factor exposure variation is responsible for 4.1% of monthly return variance. Eighty percent (1,354 funds) had been less active market timers:
Active returns consist of both security selection and market timing. In the case of NASDX, 93.3% of its 10-year monthly return variance can be explained by passive factor bets, while 6.7% is active. We call the latter figure the Active Share of Variance.
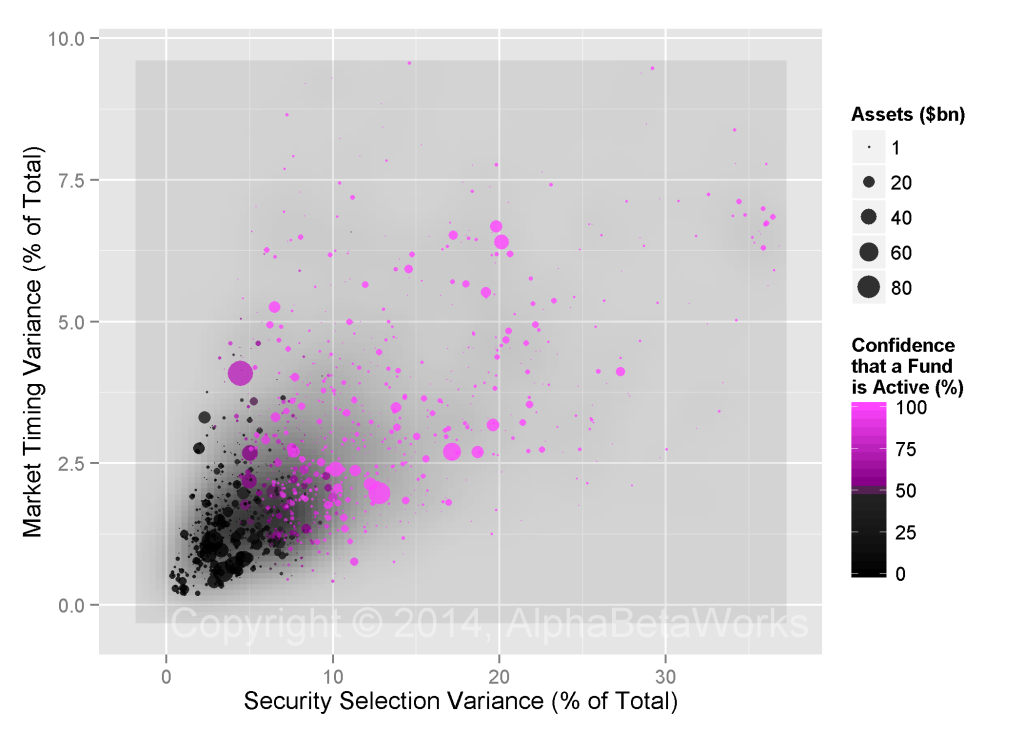
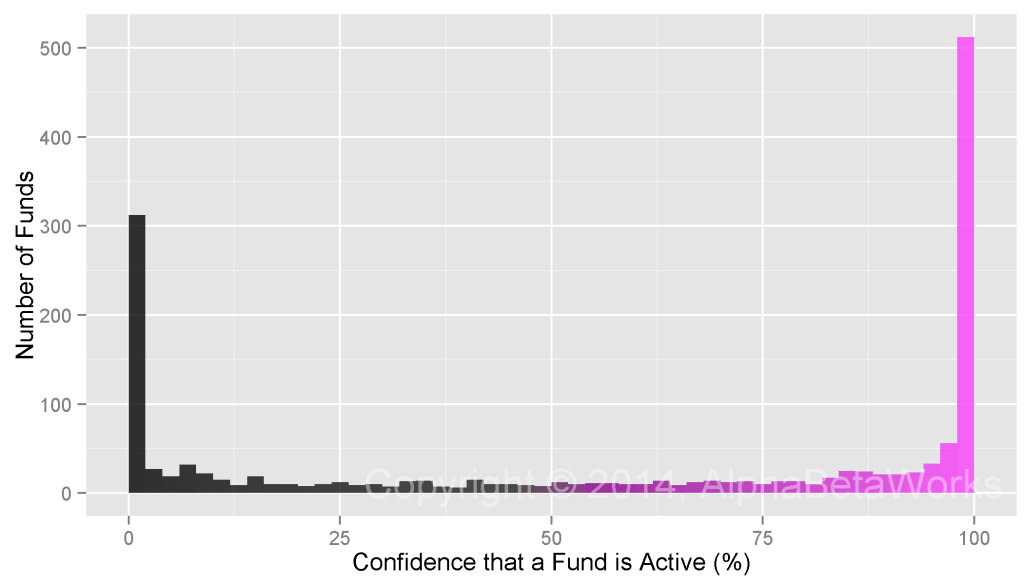
Using the F test to evaluate whether historical Active Share of Variance of a given fund exceeded that of NASDX, we produced a confidence level that a fund has been more active than the ETF. The following chart illustrates the confidence that each fund in our group has been active and shows Historical Active Shares of Variance due to security selection and market timing:
At the 95% confidence level, fewer than half of the funds (737) have been more active than the ETF; more than a fifth (350) have been less active. The test is inconclusive for the remaining 36% (602 funds), suggesting that investors can’t be certain that over half the “active” mutual funds surveyed are in fact active:
Conclusions
- Over half (56%) of active US mutual funds surveyed are not significantly more active than a 100-position NASDX ETF.
- Less than half (44%) of the funds are significantly more active that the ETF.
- More than a fifth (21%) of the funds are significantly less active than the ETF.
- Investors must be sure that they are not being charged active fees for passive management.
- By identifying closet indexers within this group alone, investors could save between $4 and $15 billion in annual management fees.
This work improves on traditional holdings-based and returns-based analyses of fund activity. Admittedly, we use a subjective benchmark for activity – a specific passive ETF. In later notes we will use the AlphaBetaWorks Performance Analytics Platform to evaluate activity levels using objective metrics.
Copyright © 2012-2014, AlphaBetaWorks, a division of Alpha Beta Analytics, LLC. All rights reserved.
Content may not be republished without express written consent.


