Tag Archives: mean reversion

Performance Persistence within International Style Boxes

We earlier discussed how nominal returns and related investment performance metrics revert: Since portfolio performance primarily comes from systematic (factor) exposures, such simplistic metrics merely promote the high-risk portfolios during the bullish regimes and the low-risk portfolios during the bearish regimes. As regimes change, the leaders flip. We also showed that, when security selection returns are distilled with a robust factor model, performance persists within all U.S. equity Style Boxes. Prompted by reader interest, we now investigate performance persistence within International Style Boxes.

Measuring the Persistence of International Portfolio Returns

As in our earlier work on return persistence, we examine all Form 13F filings for the past 10 years. This survivorship-free portfolio database covers all institutions that exercised investment discretion over at least $100 million and yields approximately 3,600 international portfolios with sufficiently long histories, low turnover, and broad positions to be suitable for the study.

We split the 10 years of history into two random 5-year samples and compared performance metrics of each portfolio over these two periods. The correlation between metrics over the sample periods measures the metrics’ persistence.

International Portfolios’ Performance Persistence

The Reversion of International Portfolios’ Nominal Returns

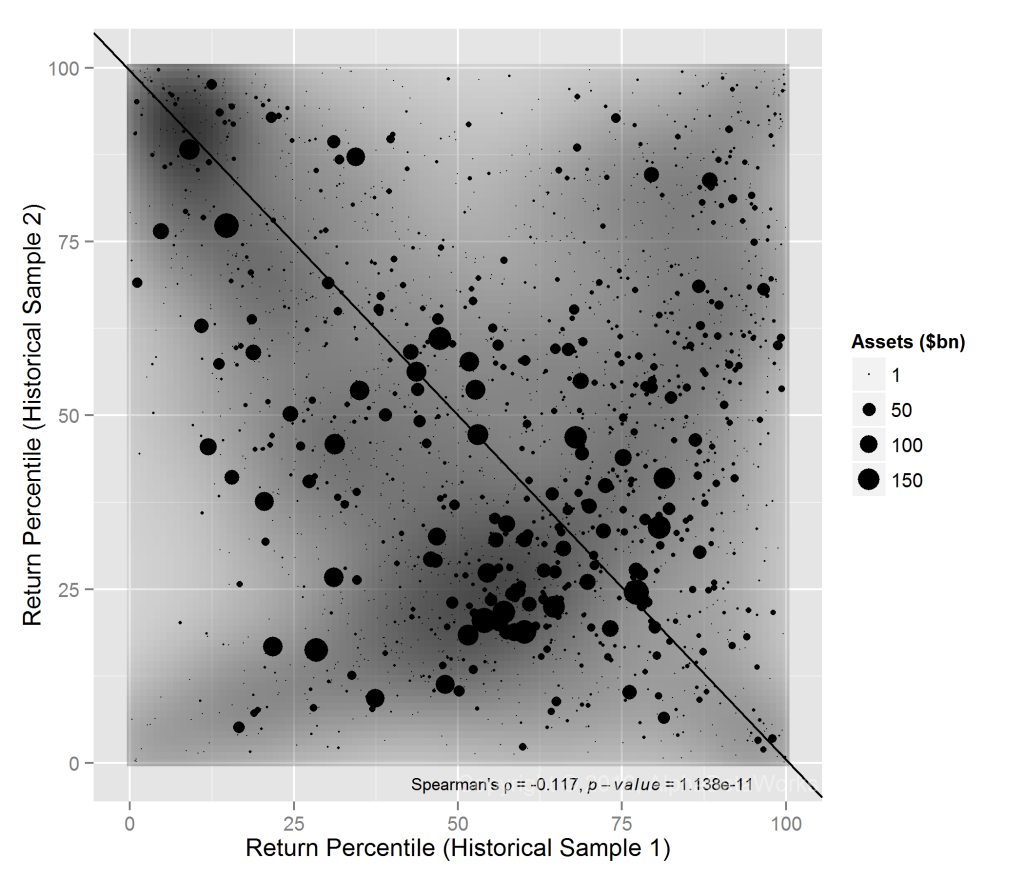
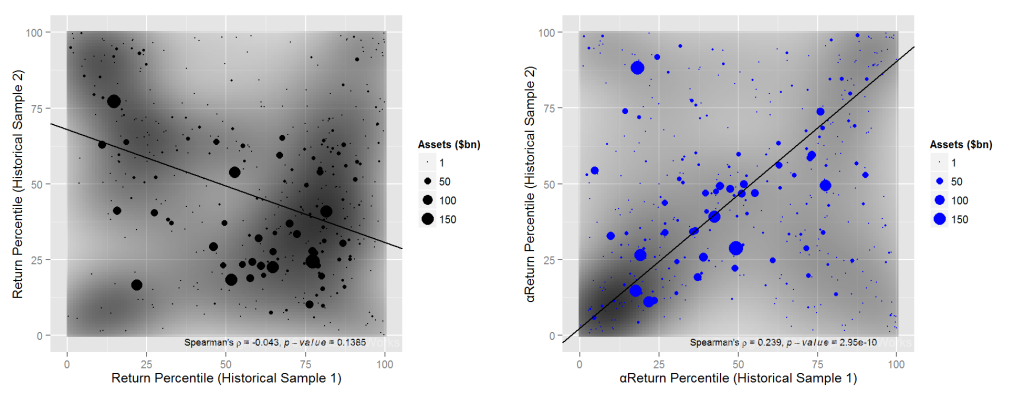
The following chart plots the rankings of each portfolio’s nominal returns during the two sample periods. The x-axis plots return percentile, or ranking, in the first sample period. The y-axis plots return percentile, or ranking, in the second sample period. The best-performing international portfolios of the first period have x-values near 100; the best-performing portfolios of the second period have y-values near 100:
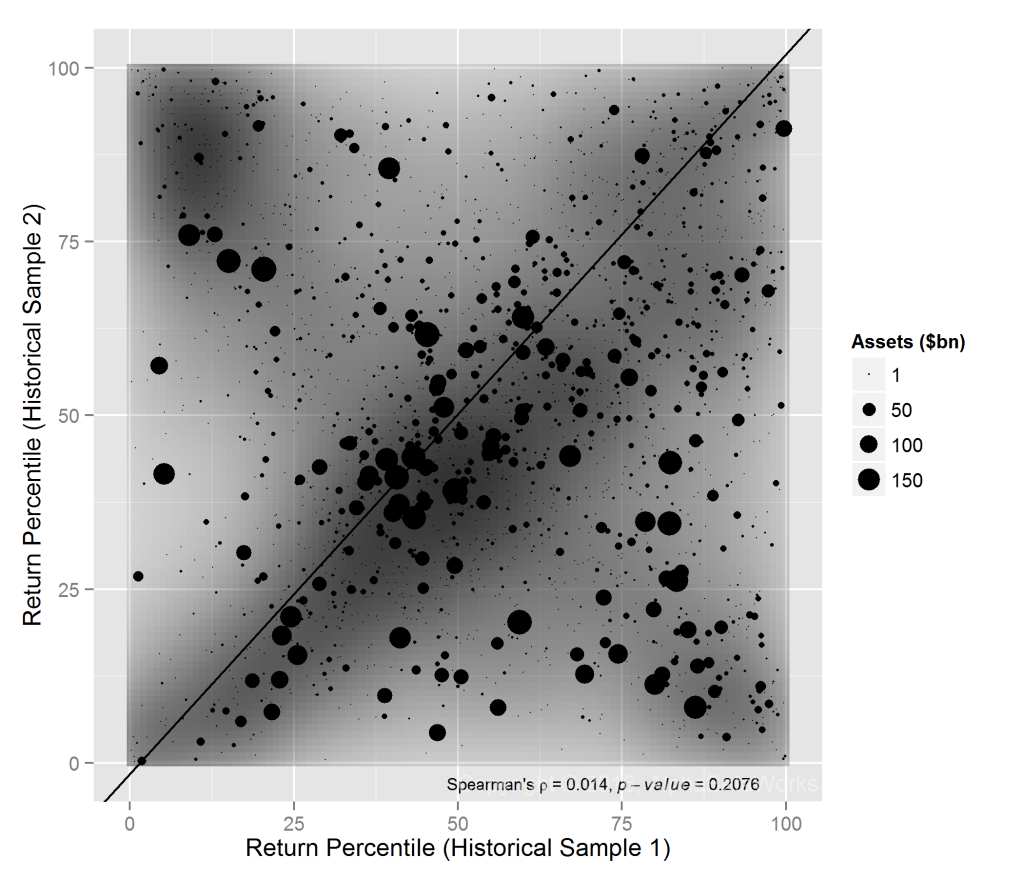
Chart of the random relationship between nominal returns for two historical samples for all international equity 13F portfolios

13F Portfolios, International Positions: Correlation between the rankings of nominal returns for two historical samples

Whereas past performance of U.S. equity portfolios was a (negative) predictor of future results, there is no significant correlation between the two for international portfolios – best- and worst-performers tend to become average.

The Persistence of International Portfolios’ Security Selection Returns

Due to the domineering effects of Market and other systematic factors, top-performing managers during the bullish regimes are those that take the most risk, and top-performing managers during the bearish regimes are those that take the least risk. Since Market returns are approximately random, nominal returns do not persist. To eliminate this noise, the AlphaBetaWorks Performance Analytics Platform calculates each portfolio’s return from security selection net of factor effects. αReturn is the return a manager would have generated if all factor returns had been flat.

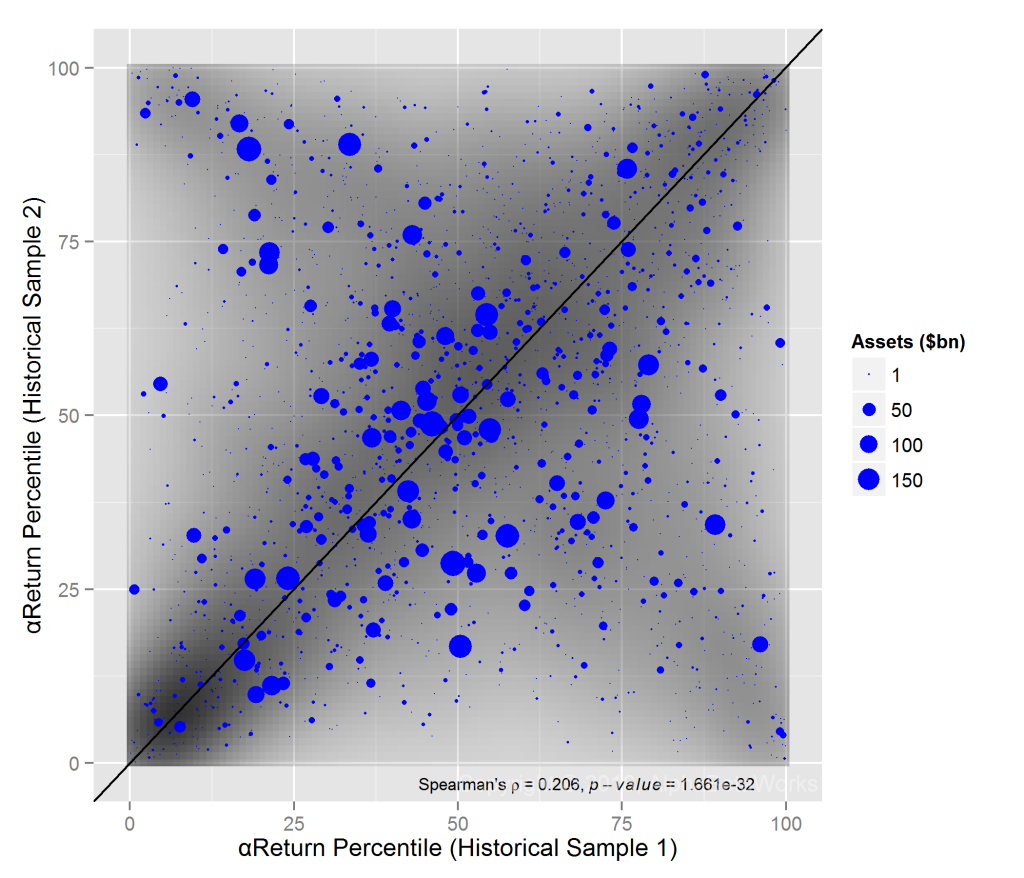
International portfolios with above-average αReturns in one period are likely to maintain them in the other. In the following chart, this relationship is represented by the concentration of portfolios in the bottom left (laggards that remained laggards) and top right (leaders that remained leaders):
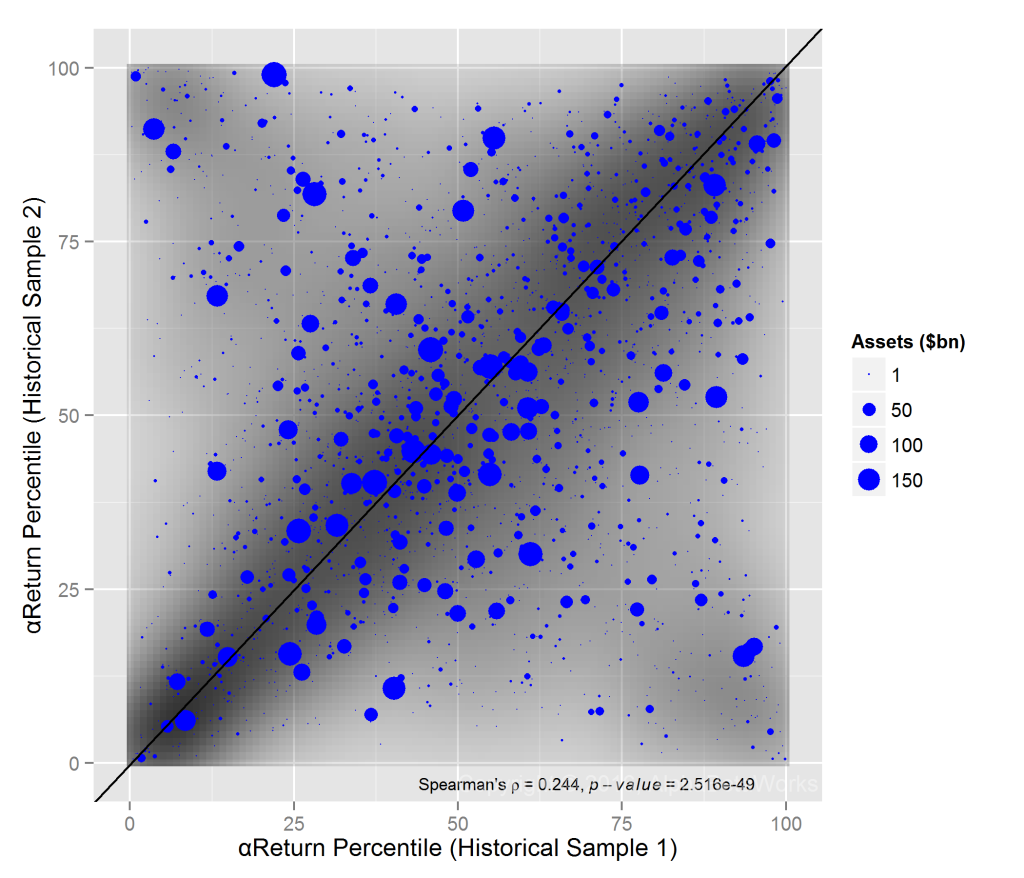
Chart of the positive correlation between risk-adjusted returns from security selection (αReturns) for two historical samples for all international equity 13F portfolios

13F Portfolios, International Positions: Correlation between the rankings of αReturns for two historical samples

This test of persistence across two arbitrary 5-year samples is strict. Persistence of security selection skill is even higher over shorter periods.

Performance Persistence within International Style Boxes

Measures of investment style such as Size (portfolio market capitalization) and Value/Growth (portfolio valuation) are common approaches to grouping portfolios. Readers frequently ask whether the reversion of nominal returns and related metrics can be explained by Style Box membership. Perhaps we merely observed reversion in leadership that is eliminated by controlling for Style?

To test this, we compared performance persistence within each of the four popular Style Boxes.

International Large-Cap Value Portfolios’ Performance Persistence

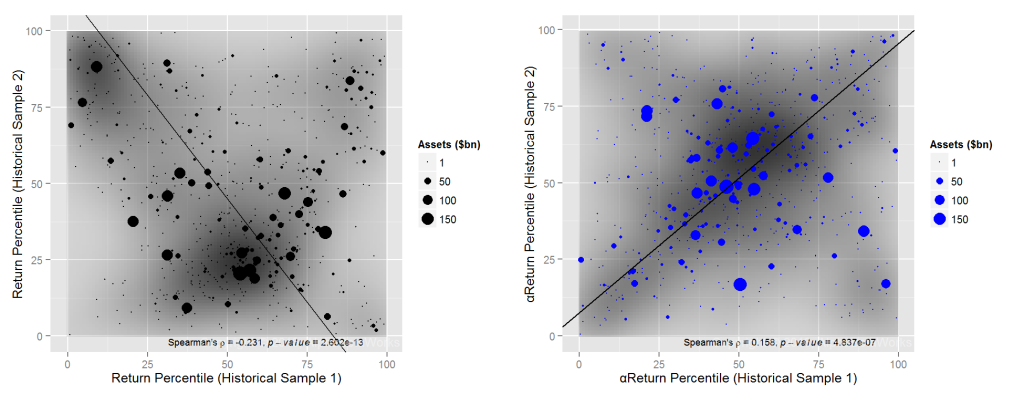
The International Large-cap Value Style Box shows the highest persistence of long-term stock picking results, yet the relationship between nominal returns within it is still nearly random. Powerful performance analytics provide the biggest edge for this International Style Box:
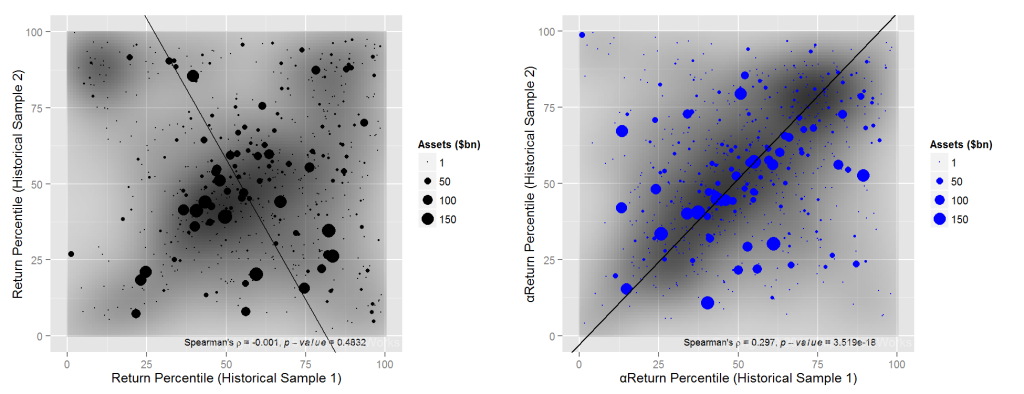
Chart of the random relationship between nominal returns and positive correlation between risk-adjusted returns from security selection (αReturns) for two historical samples for equity 13F portfolios in the Large-Cap Value International Style Box

Large-Cap Value 13F Portfolios, International Positions: Correlation between the rankings of nominal returns αReturns for two historical samples

International equity portfolios differ from U.S. equity portfolios, where security selection persistence was highest for the Small-cap Value Style Box.

International Large-Cap Growth Portfolios’ Performance Persistence

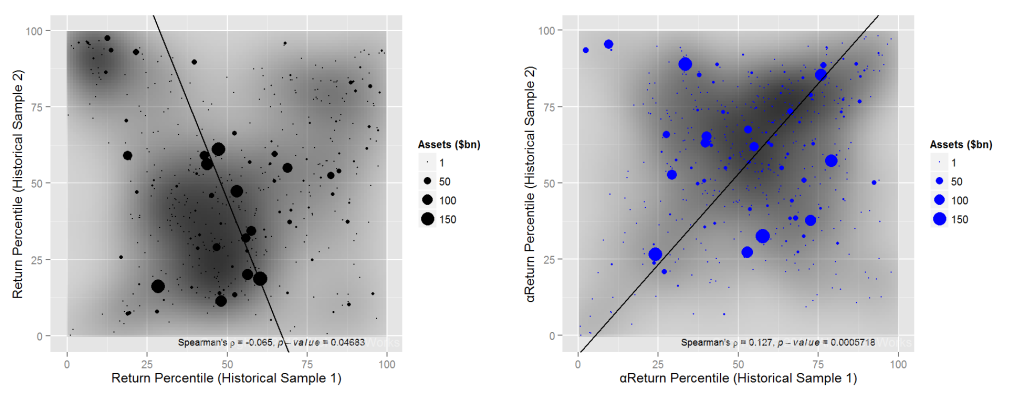
International portfolios in the Large-cap Growth Style Box also show a nearly random relationship between the two periods’ returns. However, their αReturns persist strongly. Whereas large-cap growth stock picking is treacherous for U.S. equity portfolios, it is more rewarding internationally:
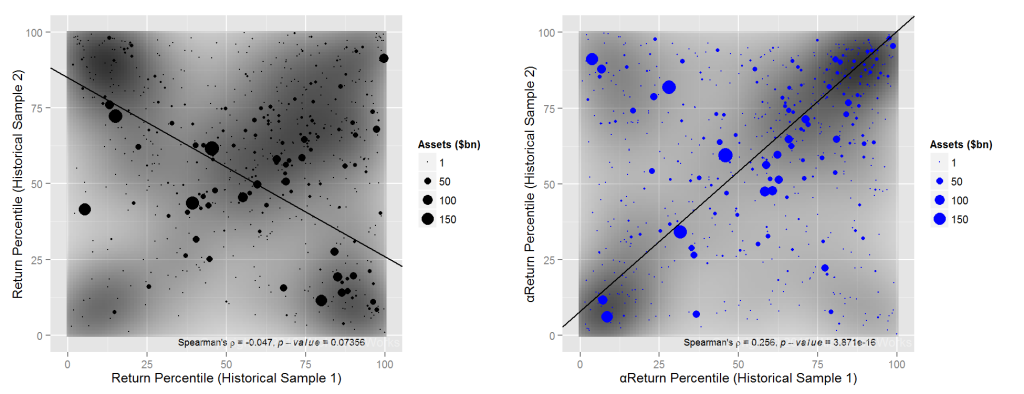
Chart of the random relationship between nominal returns and positive correlation between risk-adjusted returns from security selection (αReturns) for two historical samples for equity 13F portfolios in the Large-Cap Growth International Style Box

Large-Cap Growth 13F Portfolios, International Positions: Correlation between the rankings of nominal returns αReturns for two historical samples

International Small-Cap Value Portfolios’ Performance Persistence

International portfolios in the Small-cap Value Style Box have the least persistent αReturns, in contrast to the U.S. portfolios:
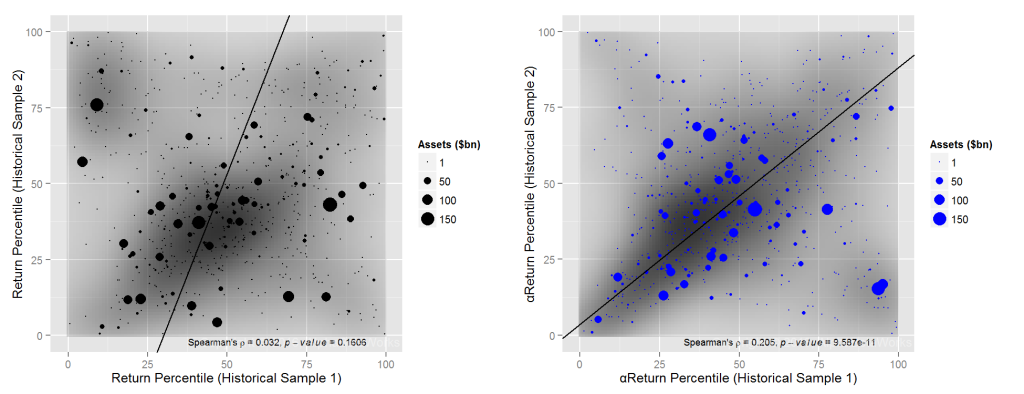
Chart of the random relationship between nominal returns and positive correlation between risk-adjusted returns from security selection (αReturns) for two historical samples for equity 13F portfolios in the Small-Cap Value International Style Box

Small-Cap Value 13F Portfolios, International Positions: Correlation between the rankings of nominal returns αReturns for two historical samples

International Small-Cap Growth Portfolios’ Performance Persistence

αReturns within the International Small-cap Growth Style Box persist almost as strongly as within the International Large-cap Style Boxes:
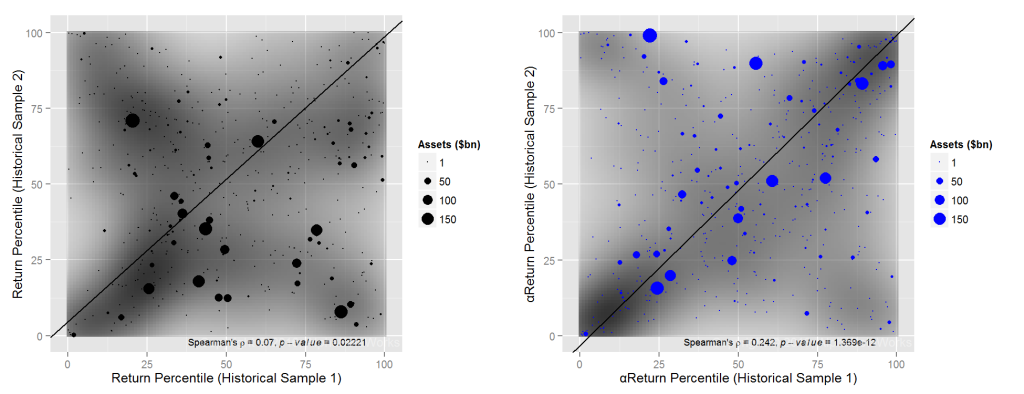
Chart of the random relationship between nominal returns and positive correlation between risk-adjusted returns from security selection (αReturns) for two historical samples for equity 13F portfolios in the Small-Cap Growth International Style Box

Small-Cap Growth 13F Portfolios, International Positions: Correlation between the rankings of nominal returns αReturns for two historical samples

Summary

  • Whereas nominal returns and related simplistic metrics of investment skill revert, security selection performance – once properly distilled with a capable factor model – persists.
  • The randomness and reversion of nominal returns and the persistence of security selection skill hold across all International Style Boxes.
  • Security selection performance persists most strongly for International Large-cap portfolios.
The information herein is not represented or warranted to be accurate, correct, complete or timely.
Past performance is no guarantee of future results.
Copyright © 2012-2016, AlphaBetaWorks, a division of Alpha Beta Analytics, LLC. All rights reserved.
Content may not be republished without express written consent.

Performance Persistence within Style Boxes

Common approaches to manager selection do a lousy job since nominal returns and similar simplistic metrics of investment performance revert: Most portfolio performance comes from systematic (factor) exposures, and such metrics merely identify the highest-risk portfolios during the bullish regimes and the lowest-risk portfolios during the bearish regimes. As regimes change, so do the leaders. In the past we demonstrated the reversion of mutual funds’ nominal returns, the reversion of hedge funds’ nominal returns, and the failures of popular statistics (Sharpe Ratio, Win/Loss Ratio, etc.) based on nominal returns. This article extends the study of performance persistence to the broadest universe of U.S. institutional portfolios and to the popular Size and Value/Growth style boxes within this universe.

Our earlier work also showed that, when security selection returns are properly calculated with a robust factor model, skill persists – portfolios of the top stock pickers of the past outperform market and peers in the future. We will now validate these findings across all major style boxes and note the particular effectiveness of predictive skill analytics for small-cap manager selection.

Measuring Persistence of Returns

We surveyed portfolios of over 5,000 institutions that have filed Form 13F in the past 10 years. This is the broadest and most representative survivorship-free portfolio database for all institutions that exercised investment discretion over at least $100 million. The collection includes hedge funds, mutual fund companies, and investment advisors. Approximately 3,000 institutions had sufficiently long histories, low turnover, and broad portfolios to be suitable for this study of performance persistence.

We split the 10 years of history into two random 5-year subsets and compared performance of each portfolio over these two periods. If performance persists over time, there will be a positive correlation between returns in one period and returns in the other.

Performance Persistence for all Institutional Portfolios

The Reversion of Nominal Returns

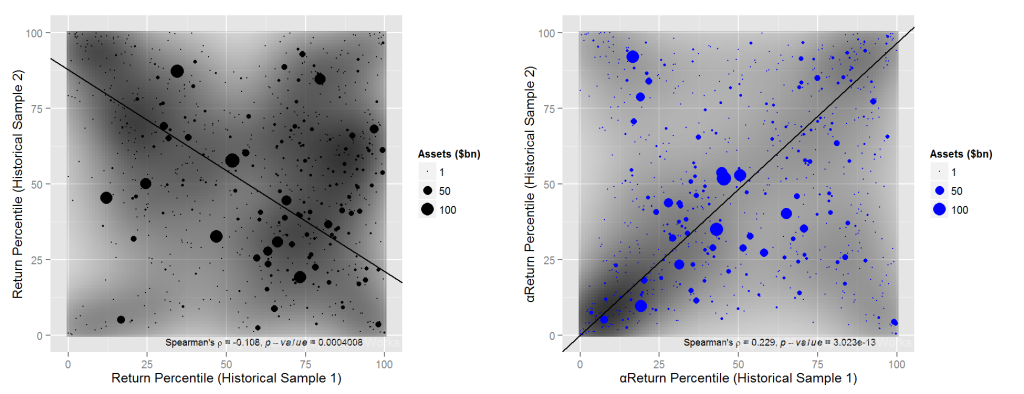
The chart below plots the ranking of nominal returns for each portfolio during the two periods. Each point corresponds to a single institution. The x-axis plots return percentile, or ranking, in the first historical sample. The y-axis plots return percentile, or ranking, in the second historical sample. For illustration, the best-performing filers of the first period have x-values near 100; the best-performing filers of the second period have y-values near 100:

Performance persistence for nominal returns: Chart of the negative correlation of nominal returns over two historical samples for all U.S. equity 13F portfolios

13F Equity Portfolios: Correlation between the rankings of nominal returns for two historical samples

Contrary to a popular slogan, past performance actually is an indication of future results: Managers with above-average nominal returns in one historical sample are likely to have below-average nominal returns in the other. In the above chart, this negative relationship between (reversion of) historical returns is visible as groupings in the bottom right (leaders that became laggards) and top left (laggards that became leaders).

The Persistence of Security Selection Returns

Nominal performance reverts because it is dominated by Market and other systematic factors. Top-performing managers during the bullish regimes are those who take the most risk; top-performing managers during the bearish regimes are those who take the least risk. As regimes change, leadership flips. To eliminate these disruptive factor effects, the AlphaBetaWorks Performance Analytics Platform calculates each portfolio’s return from security selection net of factor effects. αReturn is the return a manager would have generated if all factor returns had been flat.

Managers with above-average αReturns in one period are likely to maintain them in the other. In the following chart, this positive relationship between historical αReturns is visible as grouping in the bottom left (laggards that remained laggards) and top right (leaders that remained leaders):

Performance persistence for security selection skill: Chart of the positive correlation of risk-adjusted returns from security selection (αReturns) over two historical samples for all U.S. equity 13F portfolios

13F Equity Portfolios: Correlation between the rankings of αReturns for two historical samples

A test of performance persistence across two arbitrary 5-year samples of a 10-year span is especially strict. For most funds covered by the Platform, persistence of security selection skill is far higher over shorter periods. It is highest for approximately 3 years and begins to fade rapidly after 4 years. The chart above also illustrates that low stock picking returns persist and do so more strongly than high stock picking returns – the bottom left cluster of consistently weak stock pickers is the most dense.

Performance Persistence within Each Style Box

Measures of investment style such as Size (average portfolio market capitalization) and Value/Growth are a popular approach to grouping portfolios and analyzing risk. Though not the dominant drivers of portfolio risk and performance, they are often believed to be. Consequently, clients frequently ask whether the reversion of nominal returns and related metrics can be explained by Style Box membership and cycles of style leadership. To test this, we compared performance persistence within each of the four popular style boxes. It turns out style does not explain nominal return reversion and αReturns persist within each style box.

Large-Cap Value Portfolio Return Persistence

Portfolios in the Large-cap Value Style Box show especially high nominal return reversion (-0.23 Spearman’s rank correlation coefficient between samples). This is probably attributable to the high exposures of these portfolios to the cyclical industries that suffer from the most pronounced booms and busts:

Performance persistence for Large-Cap Value 13F Portfolios: Chart of the negative correlation of nominal returns and positive correlation of risk-adjusted returns from security selection (αReturns) over two historical samples for U.S. equity 13F portfolios in the Large-Cap Value Style Box

Large-Cap Value 13F Portfolios: Correlation between the rankings of nominal returns and αReturns for two historical samples

Large-Cap Growth Portfolio Return Persistence

Portfolios in the Large-cap Growth Style Box are the closest to random and show the lowest persistence of αReturns. Large-cap Growth stock picking is exceptionally treacherous over the long term. While it is possible to select skilled managers in this area, it is challenging even with the most powerful skill analytics:

Performance persistence for Large-Cap Growth 13F Portfolios: Chart of the negative correlation of nominal returns and positive correlation of risk-adjusted returns from security selection (αReturns) over two historical samples for U.S. equity 13F portfolios in the Large-Cap Growth Style Box

Large-Cap Growth 13F Portfolios: Correlation between the rankings of nominal returns and αReturns for two historical samples

Small-Cap Value Portfolio Return Persistence

Portfolios in the Small-cap Value Style Box show nearly random nominal returns. They also have the most persistent αReturns. Small-cap Value stock picking records are thus most consistent over the long term. This is the area where allocators and investors armed with powerful skill analytics should perform well, especially by staying away from the unskilled managers:

Performance persistence for Small-Cap Value 13F Portfolios: Chart of the negative correlation of nominal returns and positive correlation of risk-adjusted returns from security selection (αReturns) over two historical samples for U.S. equity 13F portfolios in the Small-Cap Value Style Box

Small-Cap Value 13F Portfolios: Correlation between the rankings of nominal returns and αReturns for two historical samples

Small-Cap Growth Portfolio Return Persistence

Portfolios in the Small-cap Growth Style Box have the second most persistent αReturns. This is also an area where allocators and investors armed with powerful skill analytics will have a strong edge:

Performance persistence for Small-Cap Growth 13F Portfolios: Chart of the negative correlation of nominal returns and positive correlation of risk-adjusted returns from security selection (αReturns) over two historical samples for U.S. equity 13F portfolios in the Small-Cap Growth Style Box

Small-Cap Growth 13F Portfolios: Correlation between the rankings of nominal returns and αReturns for two historical samples

Summary

  • Nominal returns and related simplistic metrics of investment skill revert: as market regimes change, the top performers tend to become the bottom performers.
  • Security selection returns, when properly calculated with a robust factor model, persist and yield portfolios that outperform.
  • Both skill and lack of skill persist, and the lack of skill persists most strongly; while it is important that investors correctly identify the talented managers, it is even more important to divest from their opposites.
  • The reversion of nominal returns and the persistence of security selection skill hold across all style boxes, but security selection skill is most persistent for small-cap portfolios.
The information herein is not represented or warranted to be accurate, correct, complete or timely.
Past performance is no guarantee of future results.
Copyright © 2012-2016, AlphaBetaWorks, a division of Alpha Beta Analytics, LLC. All rights reserved.
Content may not be republished without express written consent.
U.S. Patents Pending.

The Impact of Fund Mean Reversion

Real-world restrictions on hedge fund investing wreak havoc on common allocation strategies

Common return measures fail to predict future hedge fund performance. More important, under typical allocation and withdrawal constraints, these failures due to mean reversion become more severe:

  • Portfolios based on top nominal returns and win/loss ratios tend to under-perform.
  • Portfolios based on top Sharpe ratios don’t outperform.
  • Portfolios based on predictive skill analytics and robust factor models continue to consistently outperform.

To illustrate, we follow the approach of our earlier pieces on hedge funds: Our dataset spans the long portfolios of all U.S. hedge funds active over the past 15 years that are tractable using 13F filings. Top- and bottom-performing portfolios are selected based on 36 months of performance history.

But here we impose realistic allocation constraints: a 6-month delay between holdings reporting and fund investment, plus a bi-annual window for investments into, or withdrawals from, hedge funds. For example, an allocator who wishes to invest in a fund using 12/31/2013 data can only do so on 6/30/2014 and cannot redeem until 12/31/2014. These practical liquidity restrictions deepen the impact of hedge fund mean reversion.

Hedge Fund Selection Using Nominal Returns

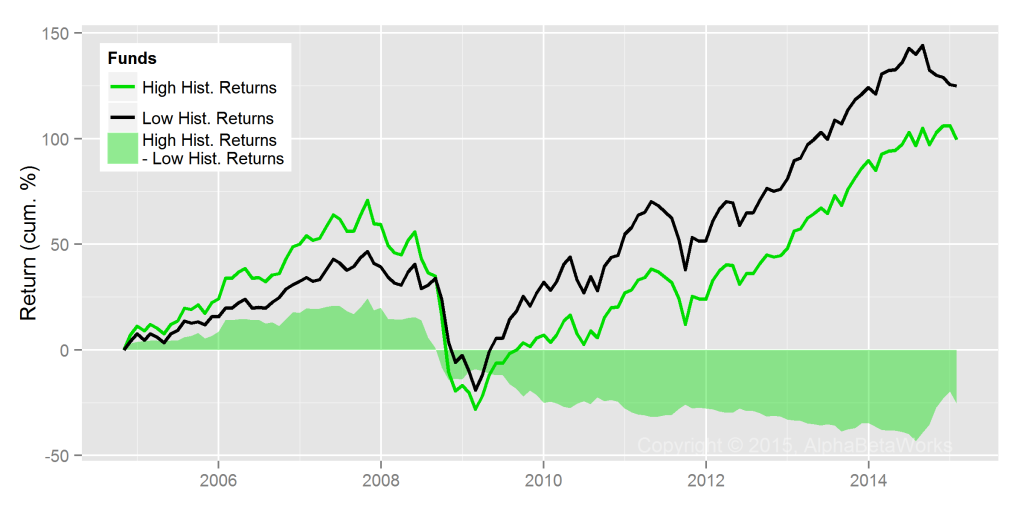
The following chart tracks two simulated funds of hedge funds. One contains the top-performing 5% and the other the bottom-performing 5% of hedge fund U.S. equity long books. We use a 36-month trailing performance look-back; investments are made with a six-month delay (as above):

Chart of the cumulative returns of hedge fund portfolios constructed from funds with the highest 5% and the lowest 5% 36-month trailing returns

Performance of Portfolios of Hedge Funds Based on High and Low Historical Returns

Cumulative Return (%)

Annual Return (%)

High Historical Returns

99.54

6.74

Low Historical Returns

125.12

7.92

High – Low Returns

-25.57

-1.18

The chart reveals several regimes of hedge fund mean reversion: In a monotonically increasing market, such as 2005-2007, relative nominal performance persists; funds with the highest systematic risk outperform. When the regime changes, however, they under-perform. At the end of 2008, the top nominal performers are those taking the lowest systematic risk. In 2009, as the regime changes again, these funds under-perform.

Hedge Fund Selection Using Sharpe Ratios

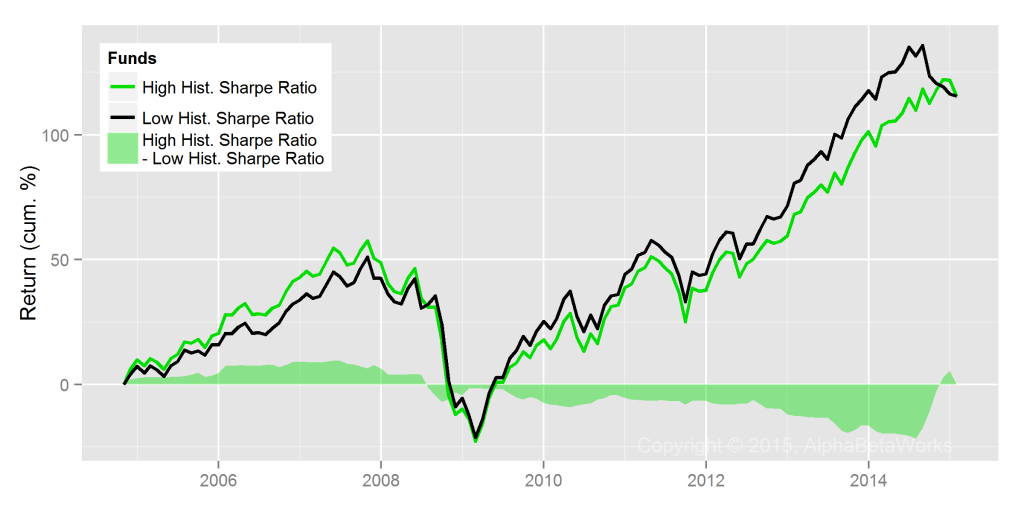
The following chart tracks portfolios of funds with the top 5% and bottom 5% Sharpe ratios:

Chart of the cumulative returns of hedge fund portfolios constructed from funds with the highest 5% and the lowest 5% 36-month trailing Sharpe ratios

Performance of Portfolios of Hedge Funds Based on High and Low Historical Sharpe Ratios

Cumulative Return (%)

Annual Return (%)

High Historical Sharpe Ratios

115.31

7.48

Low Historical Sharpe Ratios

115.52

7.49

High – Low Sharpe Ratios

-0.20

-0.01

Since Sharpe ratio simply re-processes nominal returns, and only partially adjusts for systematic risk, it also fails when market regimes change. However, it is less costly. While Sharpe ratio may not be predictive under practical constraints of hedge fund investing, at least (unlike nominal returns) it does little damage.

Hedge Fund Selection Using Win/Loss Ratios

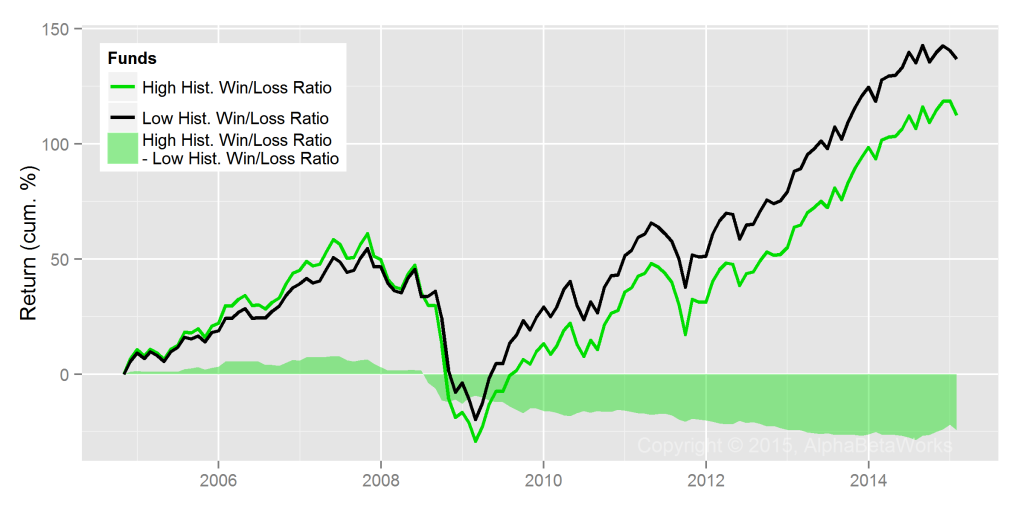
The following chart tracks portfolios of funds with the top 5% and the bottom 5% win/loss ratios, related to the batting average. These are examples of popular non-parametric approaches to skill evaluation:

Chart of the cumulative returns of hedge fund portfolios constructed from funds with the highest 5% and the lowest 5% 36-month trailing win/loss ratios

Performance of Portfolios of Hedge Funds Based on High and Low Historical Win/Loss Ratios

Cumulative Return (%)

Annual Return (%)

High Historical Win/Loss Ratios

112.41

7.35

Low Historical Win/Loss Ratios

136.86

8.41

High – Low Win/Loss Ratios

-24.45

-1.06

The win/loss ratio suffers from the same challenges as nominal returns: Win/loss ratio favors funds with the highest systematic risk in the bullish regimes and funds with the lowest systematic risk in the bearish regimes. As with nominal returns, this can be predictive while market trends continue. When trends change, the losses are especially severe under liquidity constraints.

Hedge Fund Selection Using αReturns

Systematic (factor) returns that make up the bulk of portfolio volatility are the primary source of mean reversion. Proper risk adjustment with a robust risk model controls for factor returns; it addresses mean reversion and identifies residual returns due to security selection.

AlphaBetaWorks’ measure of residual security selection performance is αReturn – outperformance relative to a replicating factor portfolio. αReturn is also the return a portfolio would have generated if markets had been flat.

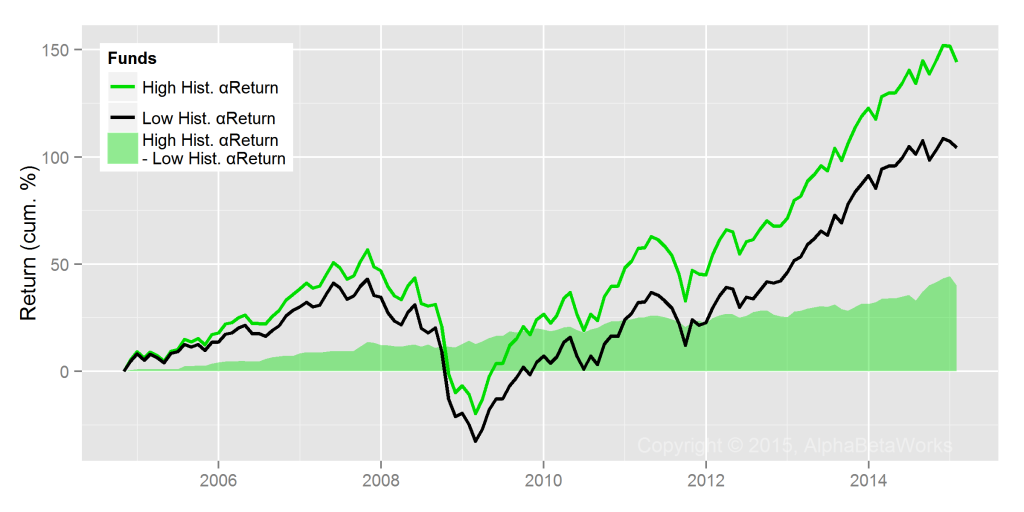
The following chart tracks portfolios of funds with the top 5% and the bottom 5% αReturns. These portfolios have matching factor exposures:

Chart of the cumulative returns of hedge fund portfolios constructed from funds with the highest 5% and the lowest 5% 36-month trailing returns from security selection (αReturns)

Performance of Portfolios of Hedge Funds Based on High and Low Historical αReturns

Cumulative Return (%)

Annual Return (%)

High Historical αReturns

144.33

8.72

Low Historical αReturns

104.25

6.97

High – Low αReturns

40.08

1.75

Even with the same 6-month investment delay and bi-annual liquidity constraints, long portfolios of the top stock pickers outperformed long portfolios of the bottom stock pickers by 40% cumulatively over the past 10 years.

This outperformance has been consistent. Indeed, top stock pickers (high αReturn funds) have continued to do well in recent years. Security selection results of the industry’s top talent are strong. Widespread discussions of the difficulty of generating excess returns in 2014 reflect the sorry state of commonly used risk and skill analytics.

Conclusions

  • Due to hedge fund mean reversion, yesterday’s nominal winners tend to become tomorrow’s nominal losers.
  • Under typical hedge fund liquidity constraints, mean reversion is aggravated. Funds of top performing hedge funds under-perform.
  • Re-processing nominal returns does not eliminate mean reversion:
    • Funds with top and bottom Sharpe ratios perform similarly;
    • Funds with top win/loss ratios underperform funds with bottom win/loss ratios.
  • Risk-adjusted returns from security selection (stock picking) persist. Robust skill analytics, such as αReturn, identify strong future stock pickers.
The information herein is not represented or warranted to be accurate, correct, complete or timely.
Past performance is no guarantee of future results.
Copyright © 2012-2015, 
AlphaBetaWorks, a division of Alpha Beta Analytics, LLC. All rights reserved.
Content may not be republished without express written consent.

Hedge Fund Mean Reversion

Our earlier articles explored hedge fund survivor (survivorship) bias and large fund survivor bias. These artifacts can nearly double nominal returns and overstate security selection (stock picking) performance by 80%. Due to these biases, future performance of the largest funds disappoints. The survivors and the largest funds have excellent past nominal performance, yet it is not predictive of their future returns due to hedge fund mean reversion, a special case of reversion toward the mean. Here we explore this phenomenon and its mitigation.

We follow the approach of our earlier pieces that analyzed hedge funds’ long U.S. equity portfolios (HF Aggregate). This dataset spans the long portfolios of all U.S. hedge funds active over the past 15 years that are tractable using 13F filings.

Mean Reversion of Nominal Hedge Fund Returns

To illustrate the mean reversion of nominal hedge fund returns, we have assembled hedge fund portfolios with the highest and lowest trailing 36-month performance and track these groups over the subsequent 36 months. This covers the past 15 years and considers approximately 100 such group pairs.

If strong historical performance is predictive, we should see future (ex-post, realized) outperformance of the best historical performers relative to the worst. This would support the wisdom of chasing the largest funds or the top-performing gurus.

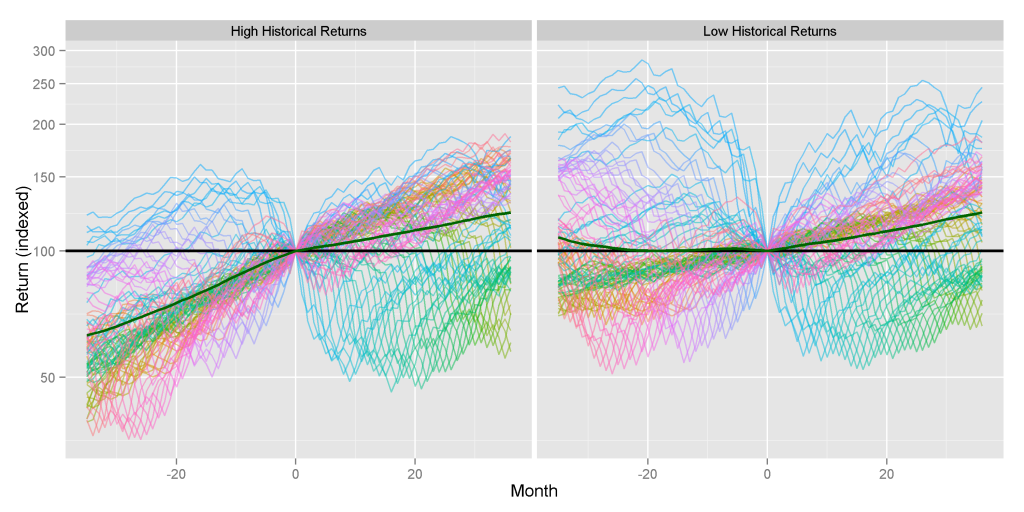
The following chart tracks past and future performance of each group. The average subsequent performance of the historically best- and worst-performing long U.S. equity hedge fund portfolios is practically identical and similar to the market return. There is some difference in the distributions, however: highest performers’ subsequent returns are skewed to the downside; lowest performers’ subsequent returns are skewed to the upside:

Chart of the past and future performance of hedge fund groups with high and low historical 36-month returns, assembled monthly over the past 15 years.

Hedge Fund Performance Persistence: High and Low Historical Returns

Prior 36 Months Return (%)

Subsequent 36 Months Return (%)

High Historical Returns

52.84

28.17

Low Historical Returns

-11.43

28.33

Thus, nominal historical returns are not predictive of future performance. We will try a few simple metrics of risk-adjusted performance next to see if they prove more effective.

Sharpe Ratio and Mean Reversion of Returns

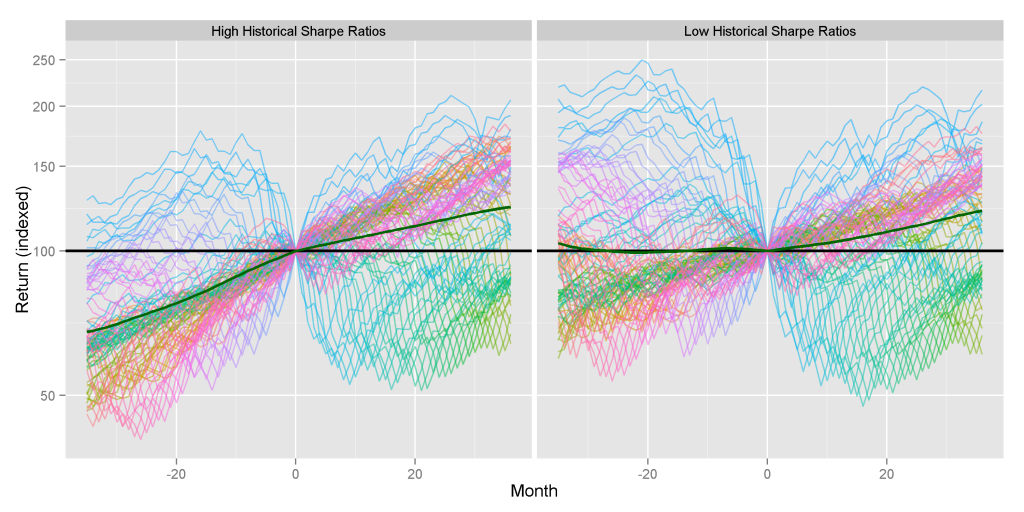
Sharpe ratio is a popular measure of risk-adjusted performance that attempts to account for risk using return volatility. The following chart tracks past and future performance of portfolios with the highest and lowest historical Sharpe ratios. The average future performance of the best- and worst-performing portfolios begins to diverge, though we have not tested this difference for statistical significance:

Chart of the past and future performance of hedge fund groups with high and low historical 36-month Sharpe ratios, assembled monthly over the past 15 years.

Hedge Fund Performance Persistence: High and Low Historical Sharpe Ratios

Prior 36 Months Return (%)

Subsequent 36 Months Return (%)

High Historical Sharpe Ratios

43.65

28.38

Low Historical Sharpe Ratios

-8.34

25.66

Note that portfolios with the highest historical Sharpe ratios perform similarly to the best and worst nominal performers in the first chart. However, portfolios with the lowest historical Sharpe ratios underperform by 2.5%. Sharpe ratio does not appear to predict high future performance, yet it may help guard against poor results.

Win/Loss Ratio and Mean Reversion of Returns

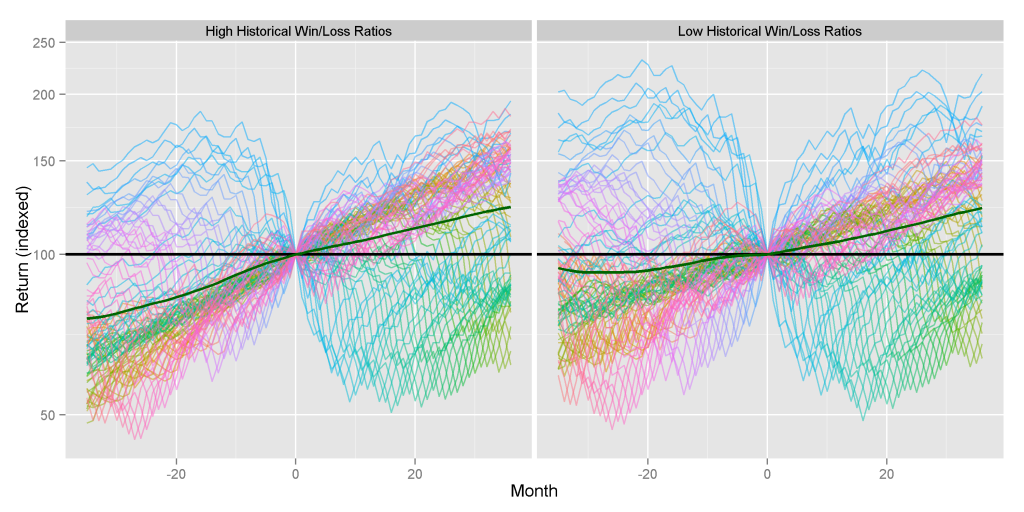
Sharpe ratio and similar parametric approaches make strong assumptions, including normality of returns. We try a potentially more robust non-parametric measure of performance free of these assumptions – the win/loss ratio, closely related to the batting average. The following chart tracks past and future performance of portfolios with the highest and lowest historical win/loss ratios. The relative future performance of the two groups is similar:

Chart of the past and future performance of hedge fund groups with high and low historical 36-month win/loss ratios, assembled monthly over the past 15 years.

Hedge Fund Performance Persistence: High and Low Historical Win/Loss Ratios

Prior 36 Months Return (%)

Subsequent 36 Months Return (%)

High Historical Win/Loss Ratios

26.93

27.59

Low Historical Win/Loss Ratios

1.70

26.53

Win/loss ratio does not appear to improve on the predictive ability of Sharpe ratio. In fact, both groups slightly underperform the low performers from the first chart above.

Persistence of Hedge Fund Security Selection Returns

Nominal returns and simple metrics that rely on nominal returns both suffer from mean reversion, since systematic (factor) returns responsible for the bulk of portfolio volatility are themselves mean reverting. Proper risk adjustment with a robust risk model that eliminates systematic risk factors and purifies residuals addresses this problem.

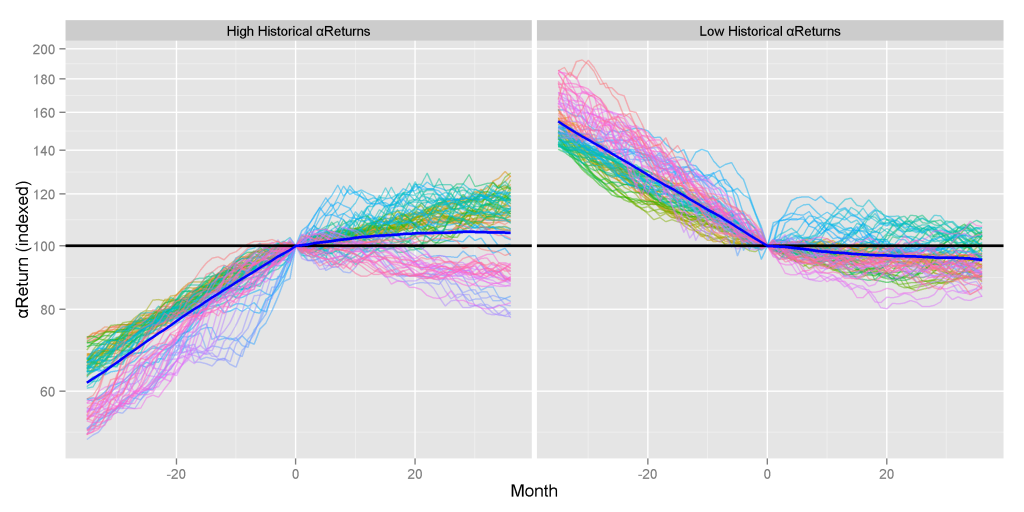
AlphaBetaWorks’ measure of this residual security selection performance is αReturn – outperformance relative to a replicating factor portfolio. αReturn is also the return a portfolio would have generated if markets had been flat. The following chart tracks past and future security selection performance of portfolios with the highest and lowest historical αReturns. The future security selection performance of the best and worst stock pickers diverges by over 10%:

Charts of the past and future security selection (residual, αReturn) performance of hedge fund groups with high and low historical 36-month security selection (residua) returns, assembled monthly over the past 15 years.

Hedge Fund Security Selection Performance Persistence: High and Low Historical αReturns

Prior 36 Months αReturn (%)

Subsequent 36 Months αReturn (%)

High Historical αReturns

60.90

5.65

Low Historical αReturns

-35.66

-4.58

Security Selection and Persistent Nominal Outperformance

Strong security selection performance and strong αReturns can always be turned into nominal outperformance. In fact, a portfolio with positive αReturns can be hedged to outperform any broad benchmark. Nominal outperformance is convenient and easy to understand. These are the returns that investors “can eat.”

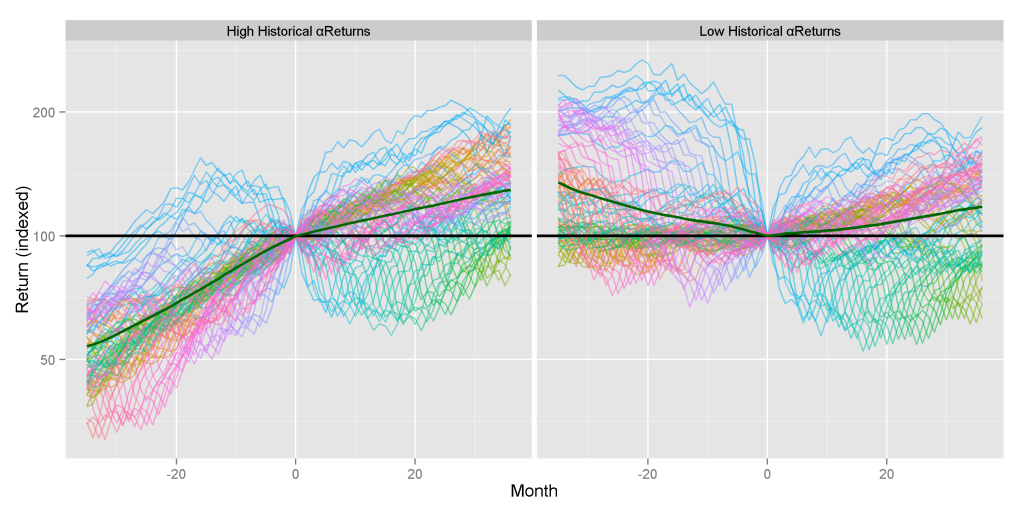
The following chart tracks past and future nominal performance of portfolios with the highest and lowest historical αReturns, hedged to match U.S. Equity Market’s risk (factor exposures). Hedging preserved security selection returns and compounded them with market performance: future performance of the two groups diverges by over 11%:

Charts of the past and future performance of hedge fund groups with high and low historical 36-month security selection (residua) returns, assembled monthly over the past 15 years and hedged to match U.S. Market.

Hedge Fund Performance Persistence: High and Low Historical αReturns

Prior 36 Months Return (%)

Subsequent 36 Months Return (%)

High Historical αReturns

81.70

32.50

Low Historical αReturns

-28.93

21.41

Note that, similarly to Sharpe ratio, αReturn is most effective in identifying future under-performers.

Thus, with predictive analytics and a robust model, investors can not only identify persistently strong stock pickets but also construct portfolios with predictably strong nominal performance.

Conclusions

  • Due to hedge fund mean reversion, future performance of the best and worst nominal performers of the past is similar.
  • Re-processing nominal returns does not eliminate mean reversion. However, Sharpe ratio begins to identify future under-performers.
  • Risk-adjusted returns from security selection (stock picking) persist. A robust risk model can isolate these returns and identify strong future stock pickers.
  • Hedging can turn persistent security selection returns into outperformance relative to any benchmark:
    • A hedged portfolio of the best stock pickers persistently outperforms.
    • A hedged portfolio of the worst stock pickers persistently underperforms.
The information herein is not represented or warranted to be accurate, correct, complete or timely.
Past performance is no guarantee of future results.
Copyright © 2012-2015, 
AlphaBetaWorks, a division of Alpha Beta Analytics, LLC. All rights reserved.
Content may not be republished without express written consent.