Category Archives: Risk

Sector Performance – First Half 2014

Separating the Signal from the Noise

Market noise obscures the true relationships among individual sectors and true industry-specific performance. By stripping away market and broad macroeconomic effects, we can derive the returns of pure sector factors. Without proper analysis of these factors, accurate risk management, performance attribution, and manager skill evaluation are impossible. Investors oblivious to trends in pure sector returns may be blindsided by secular trends.

Pure Sector Performance

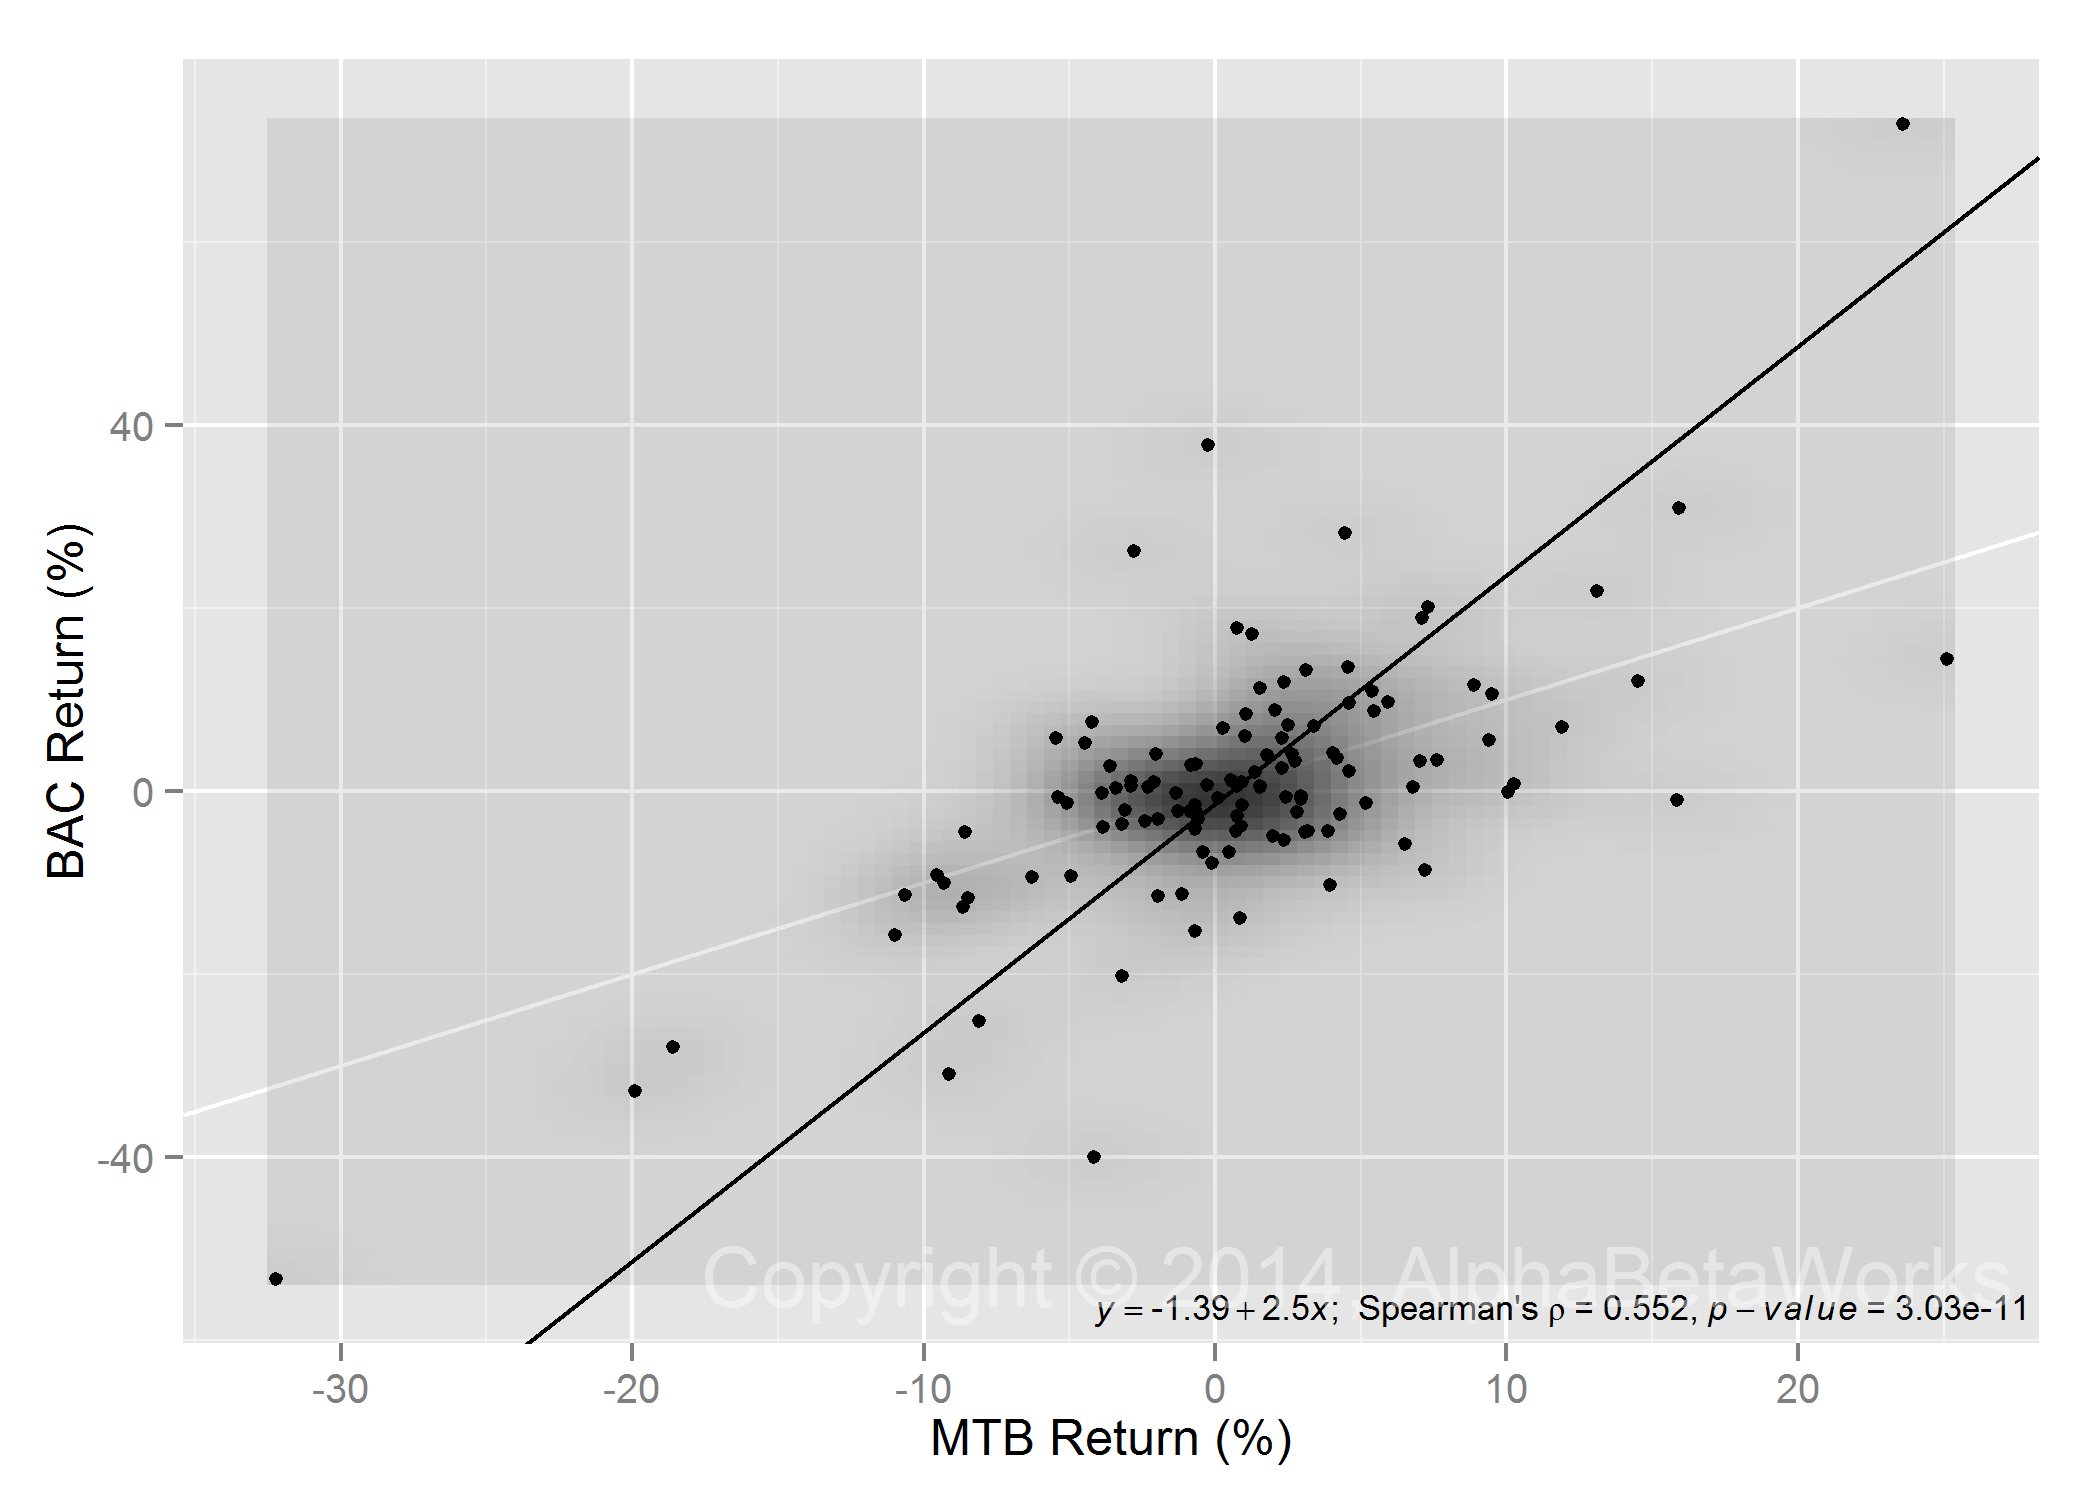
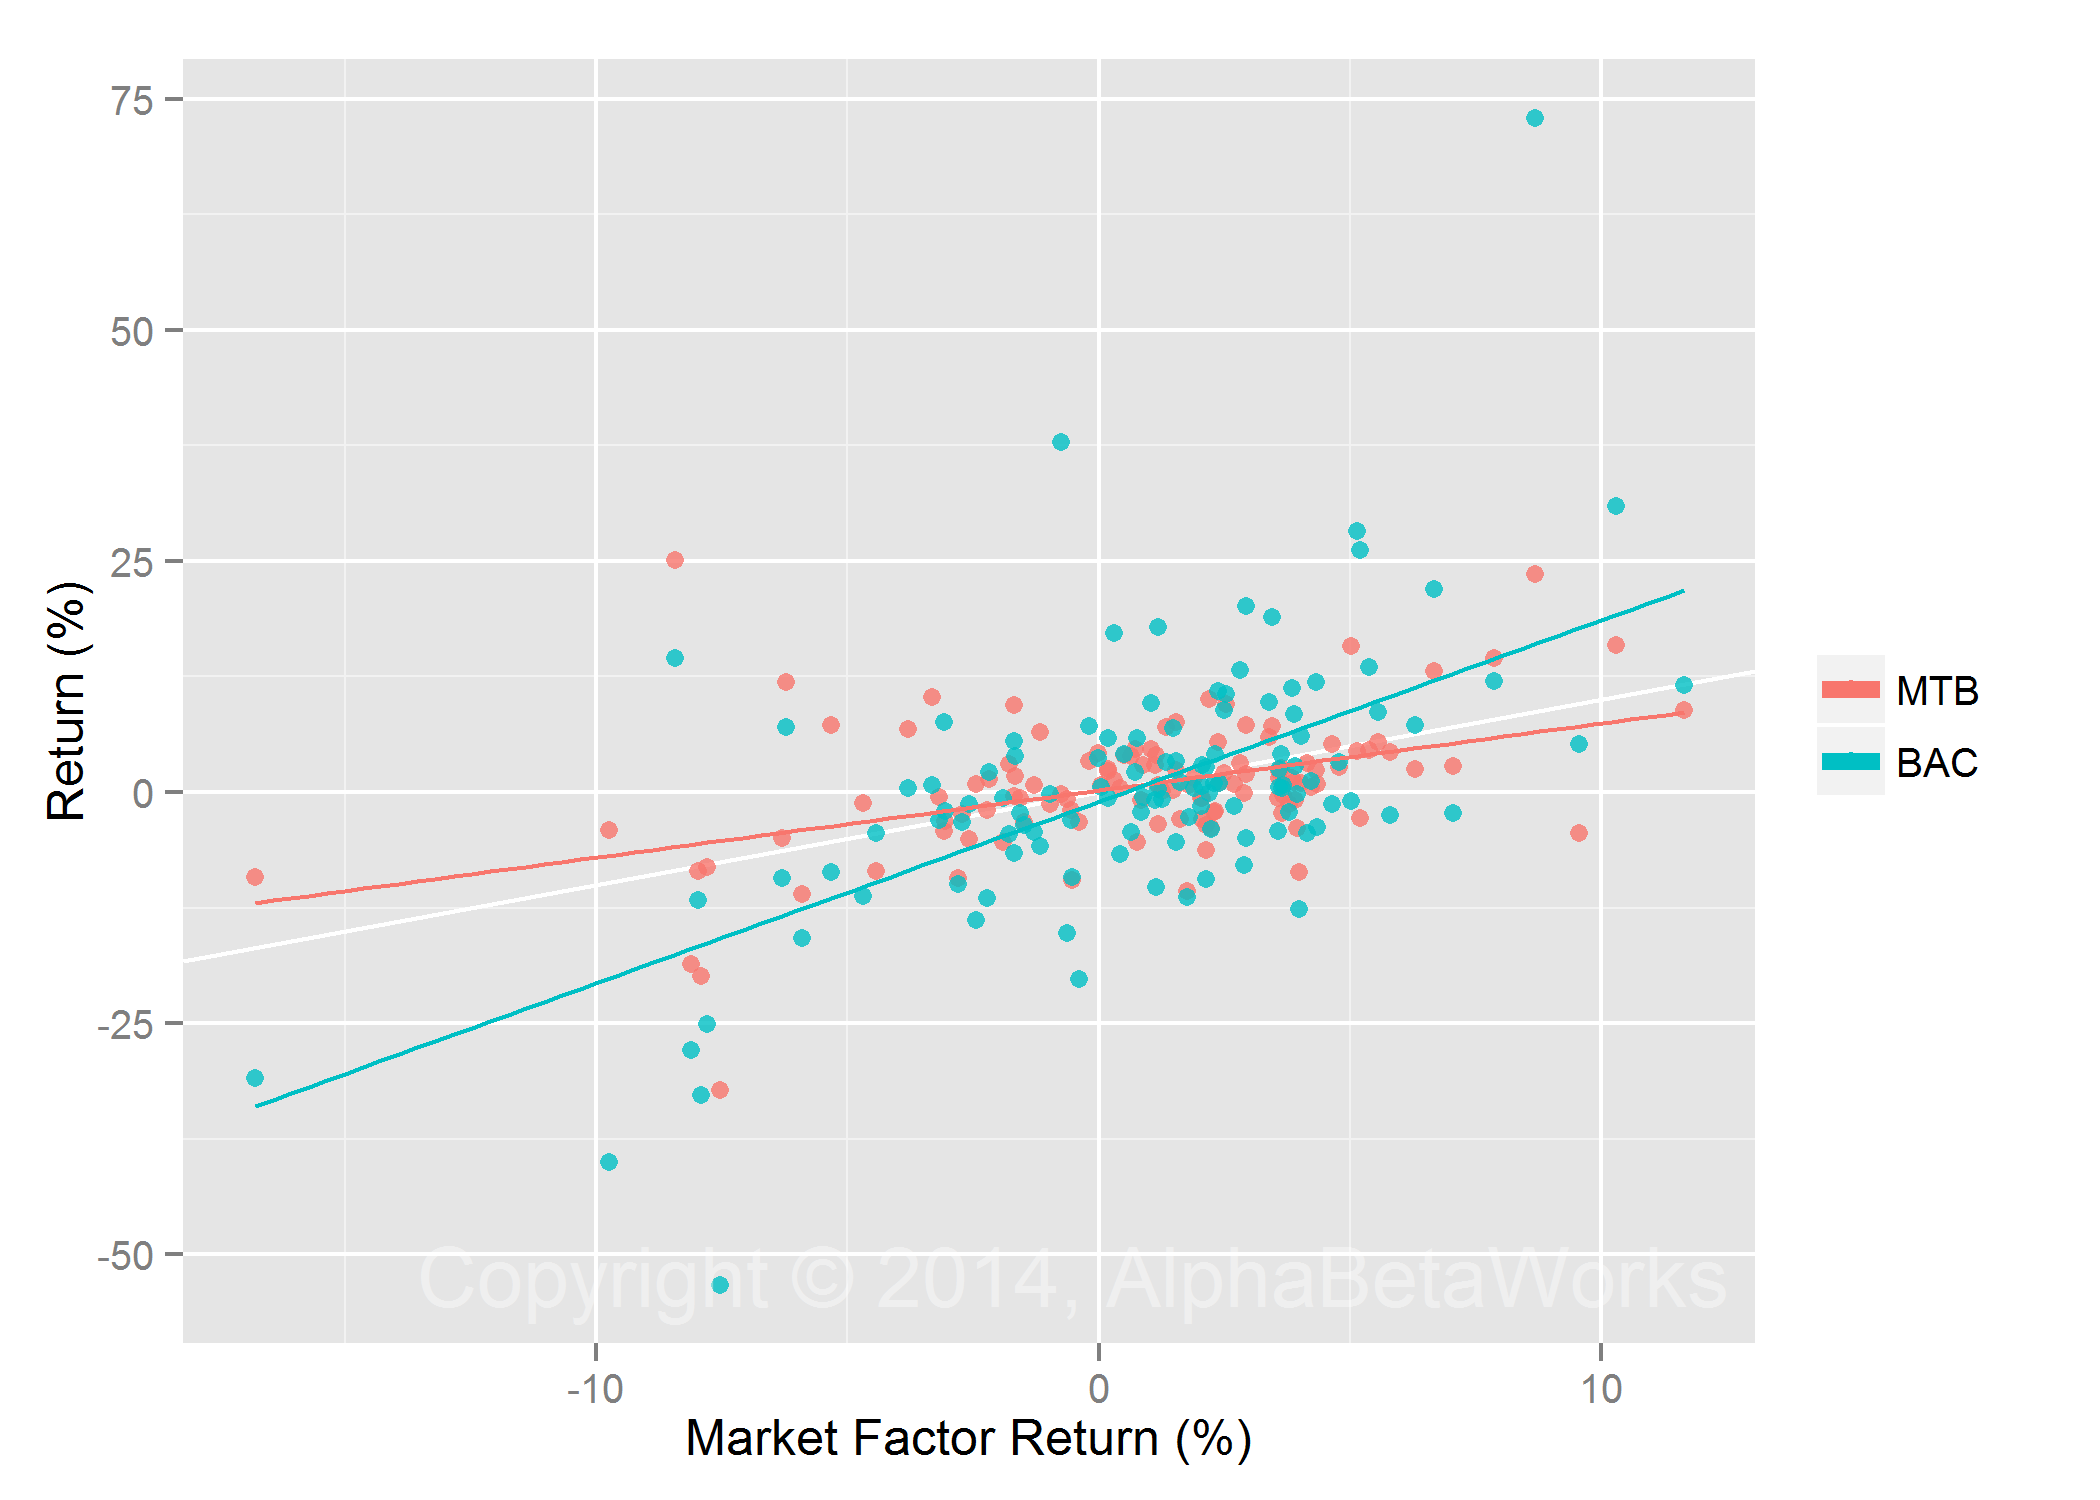
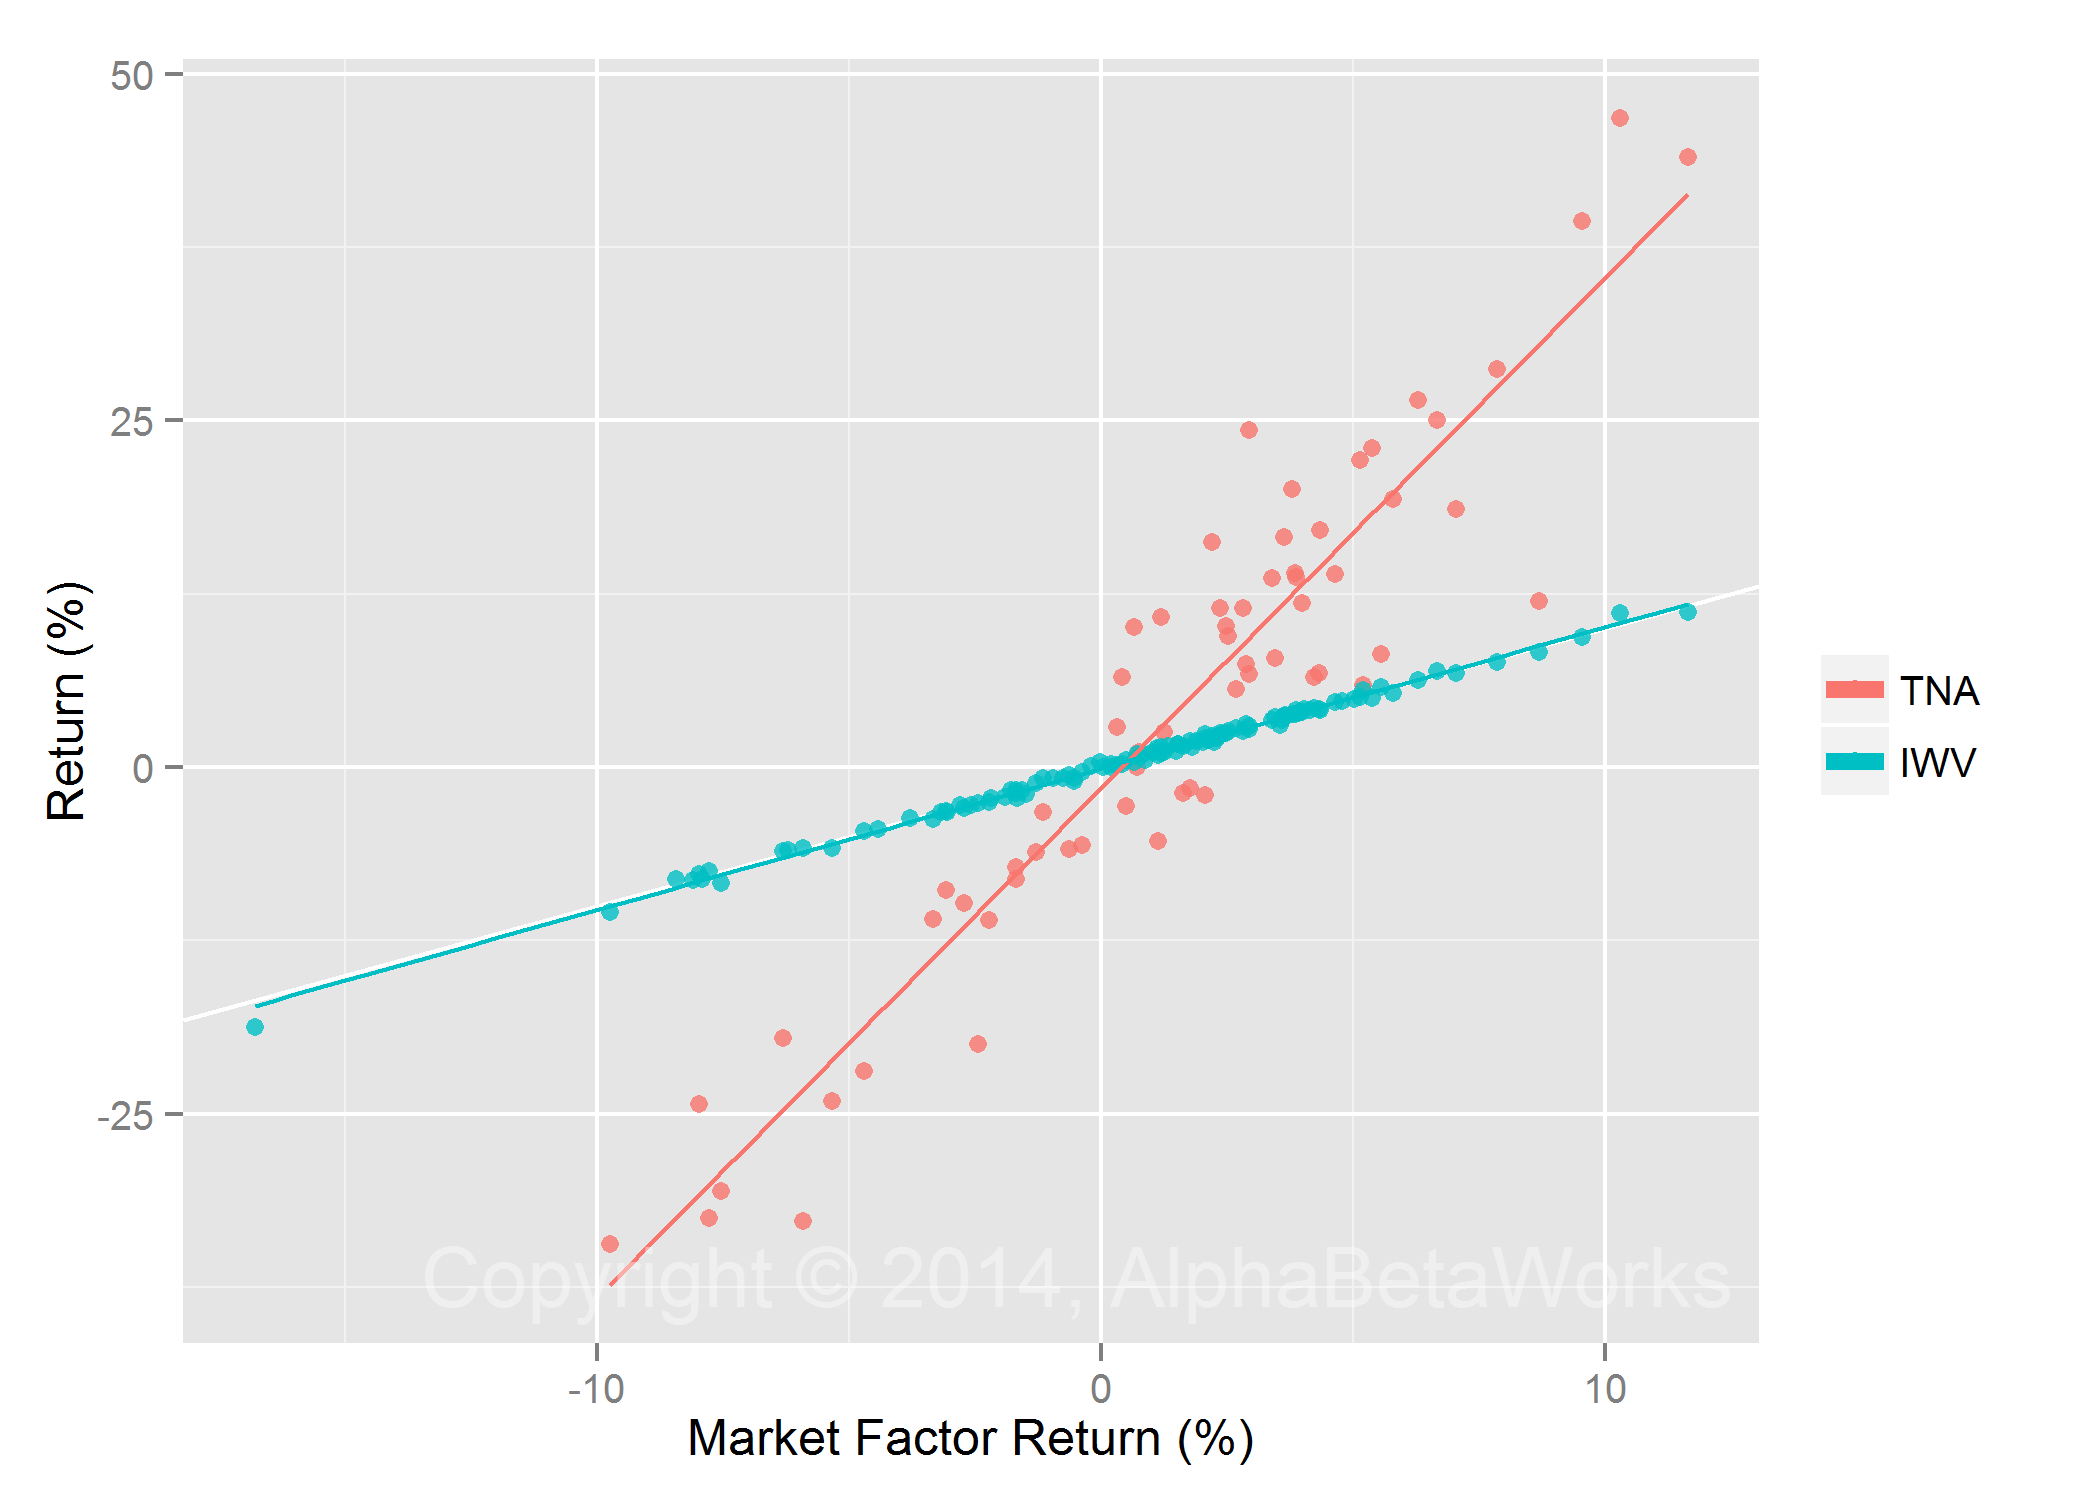
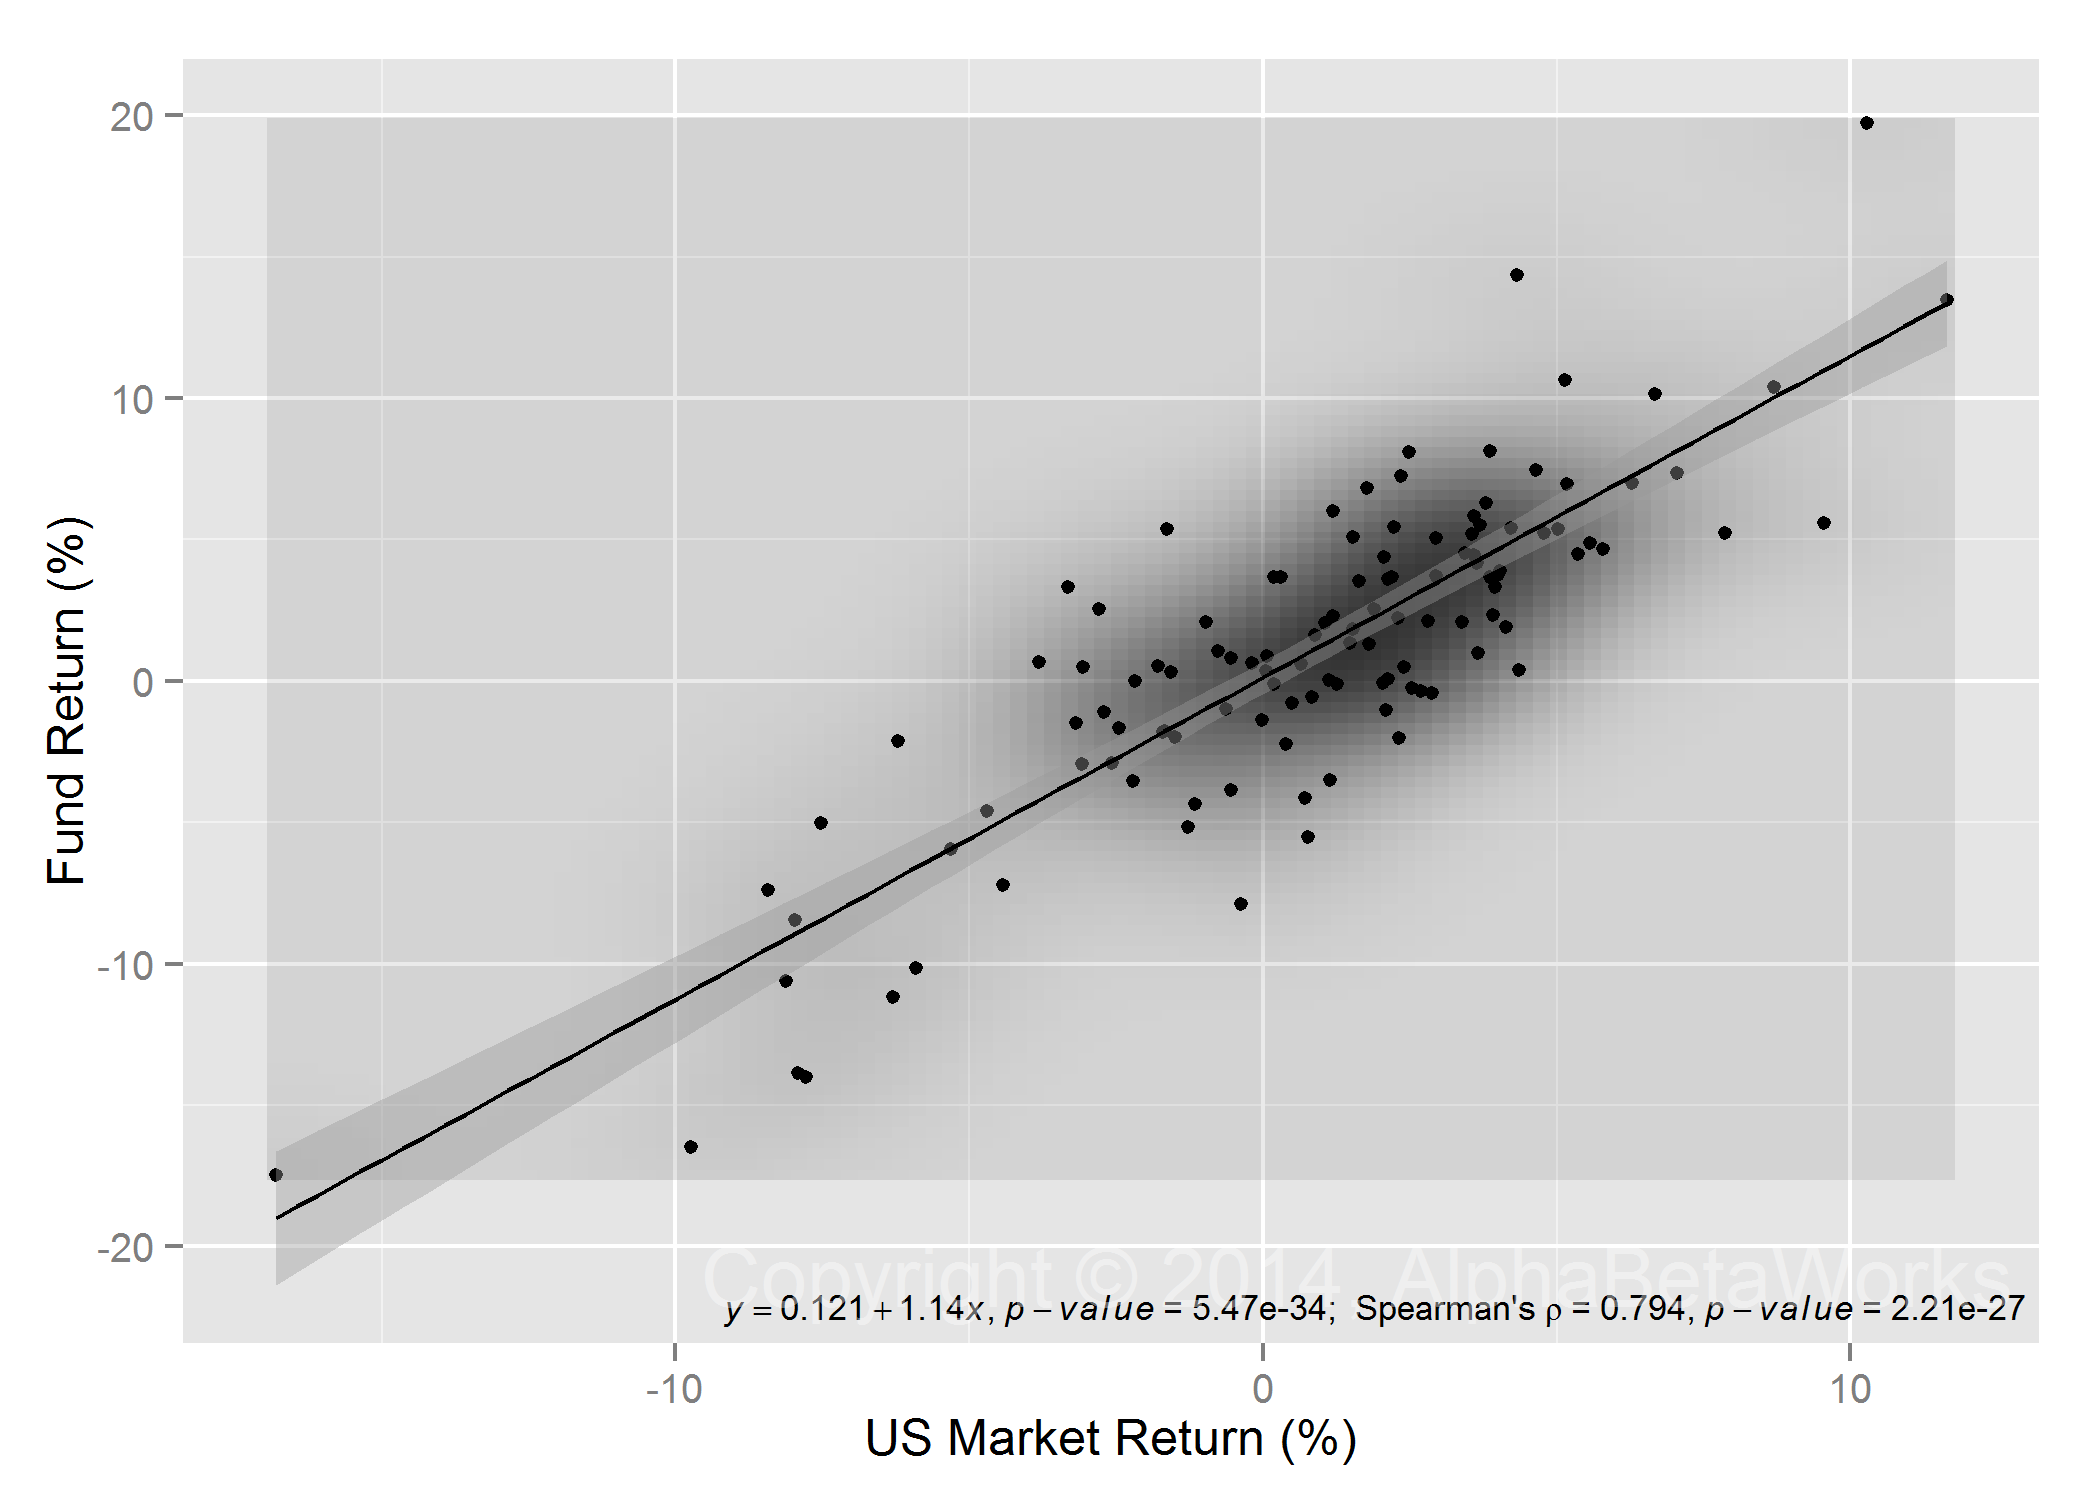
Market performance is the most important factor influencing the returns of most securities, indices, and sectors. Hence, it is generally impossible to assess the true relative performance of two sectors without first removing market effects. For example, a simple analysis of US Healthcare and Industrial Sector index returns suggests that they are highly, and positively, correlated:

US Industrial and Healthcare Sector Return Correlation

US Industrial and Healthcare Sector Return Correlation

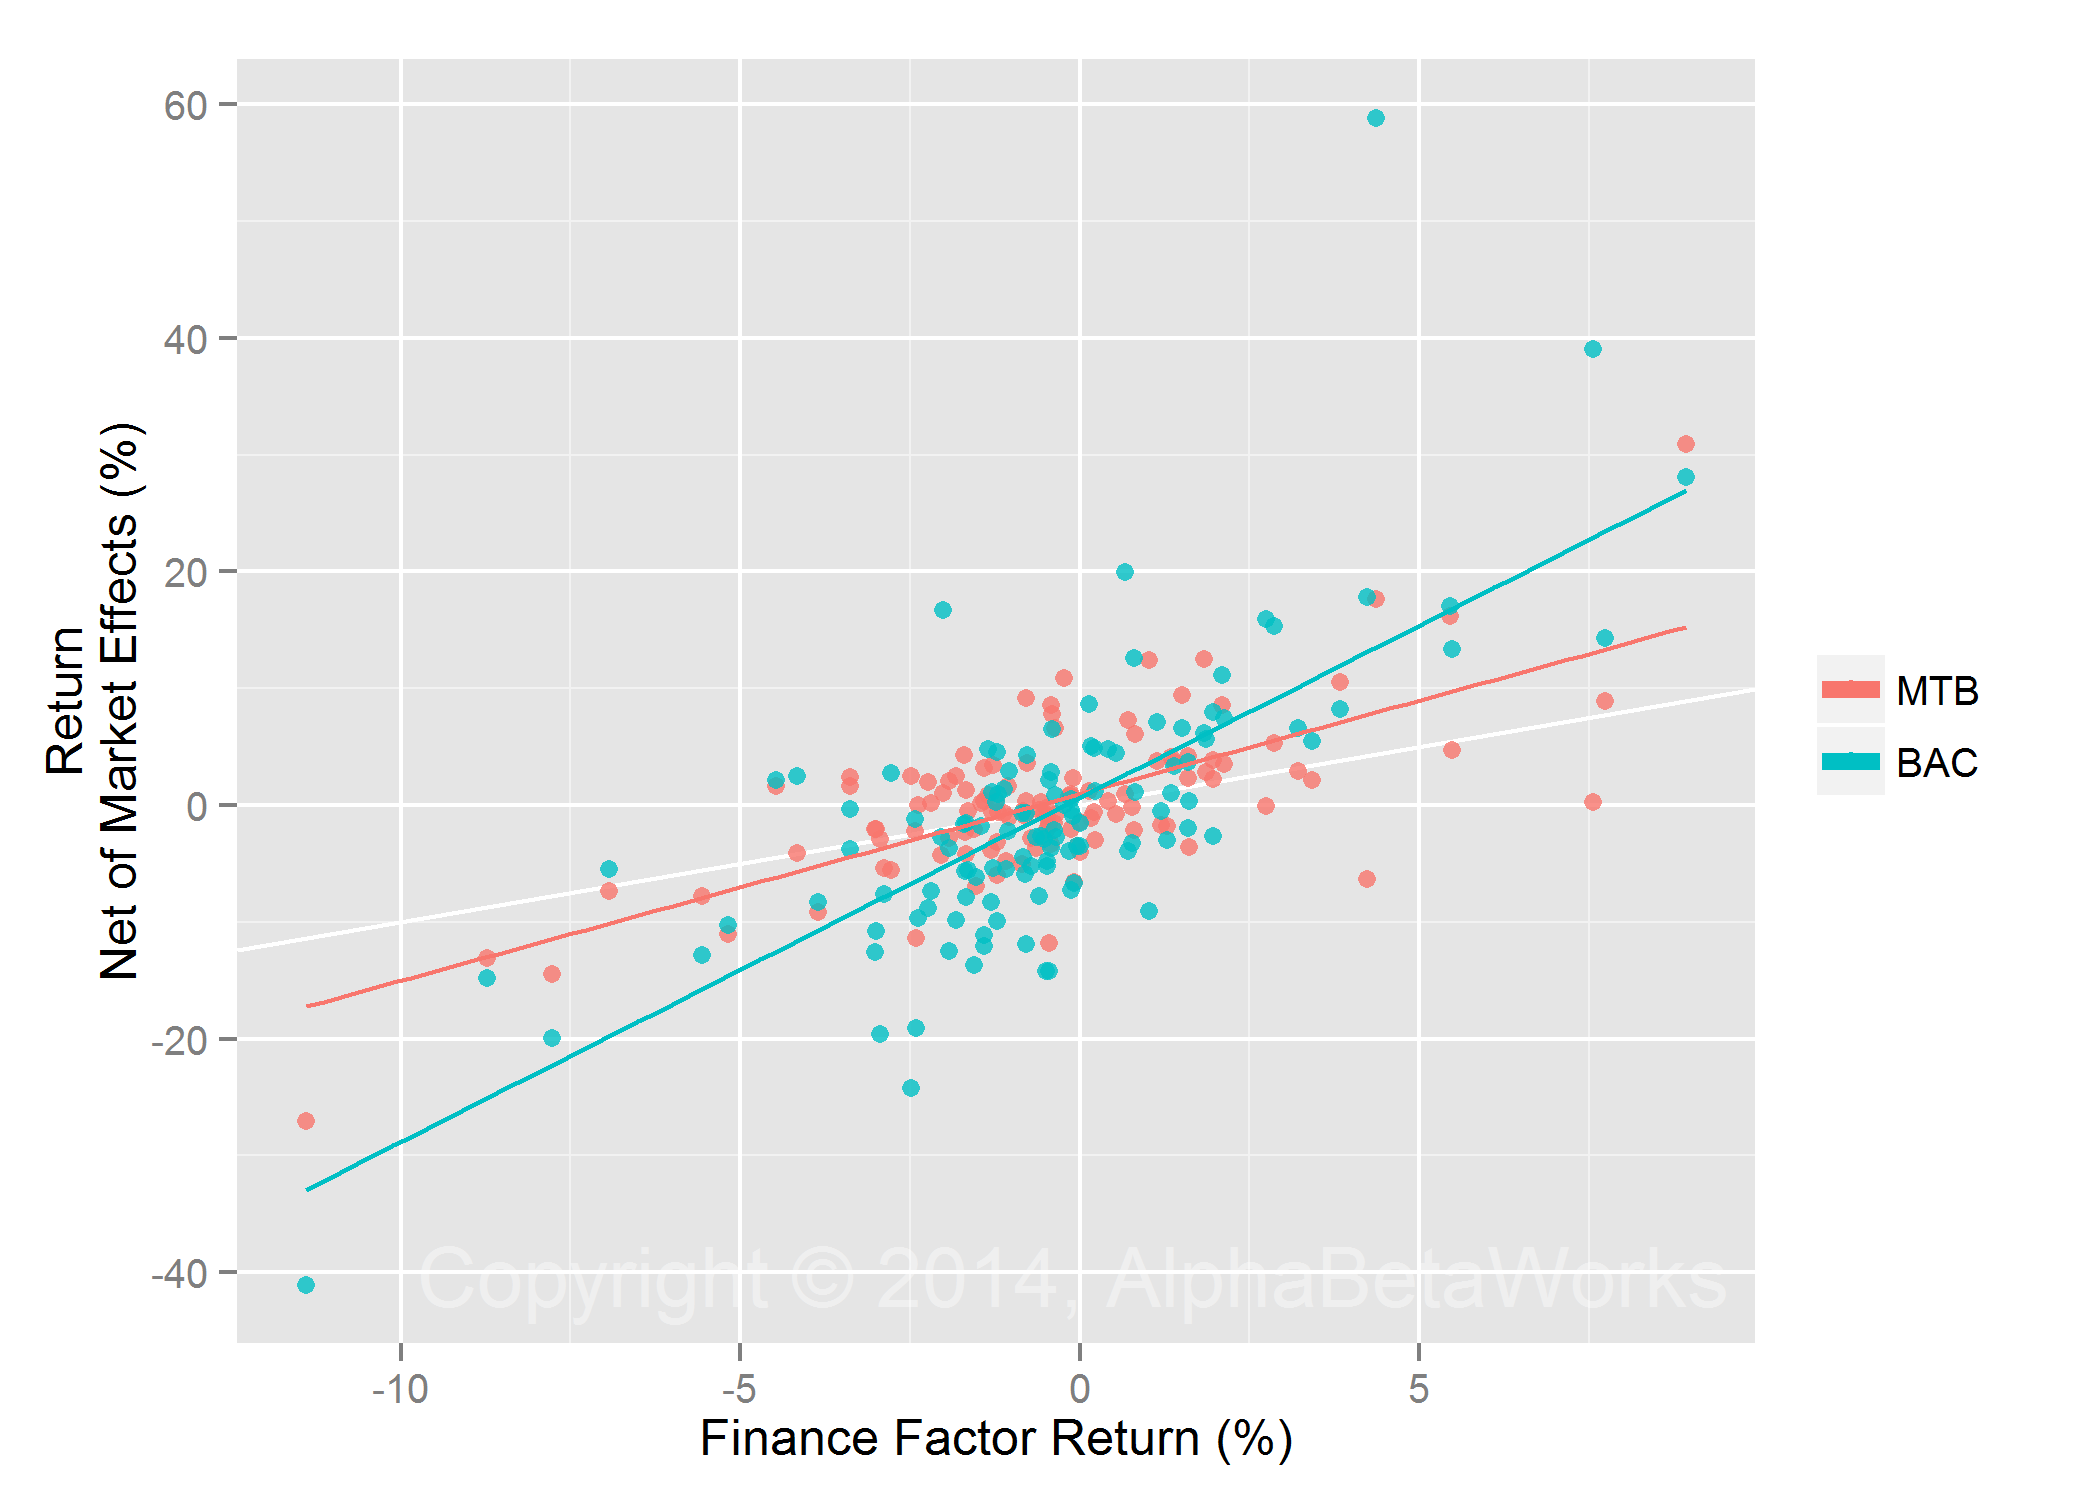
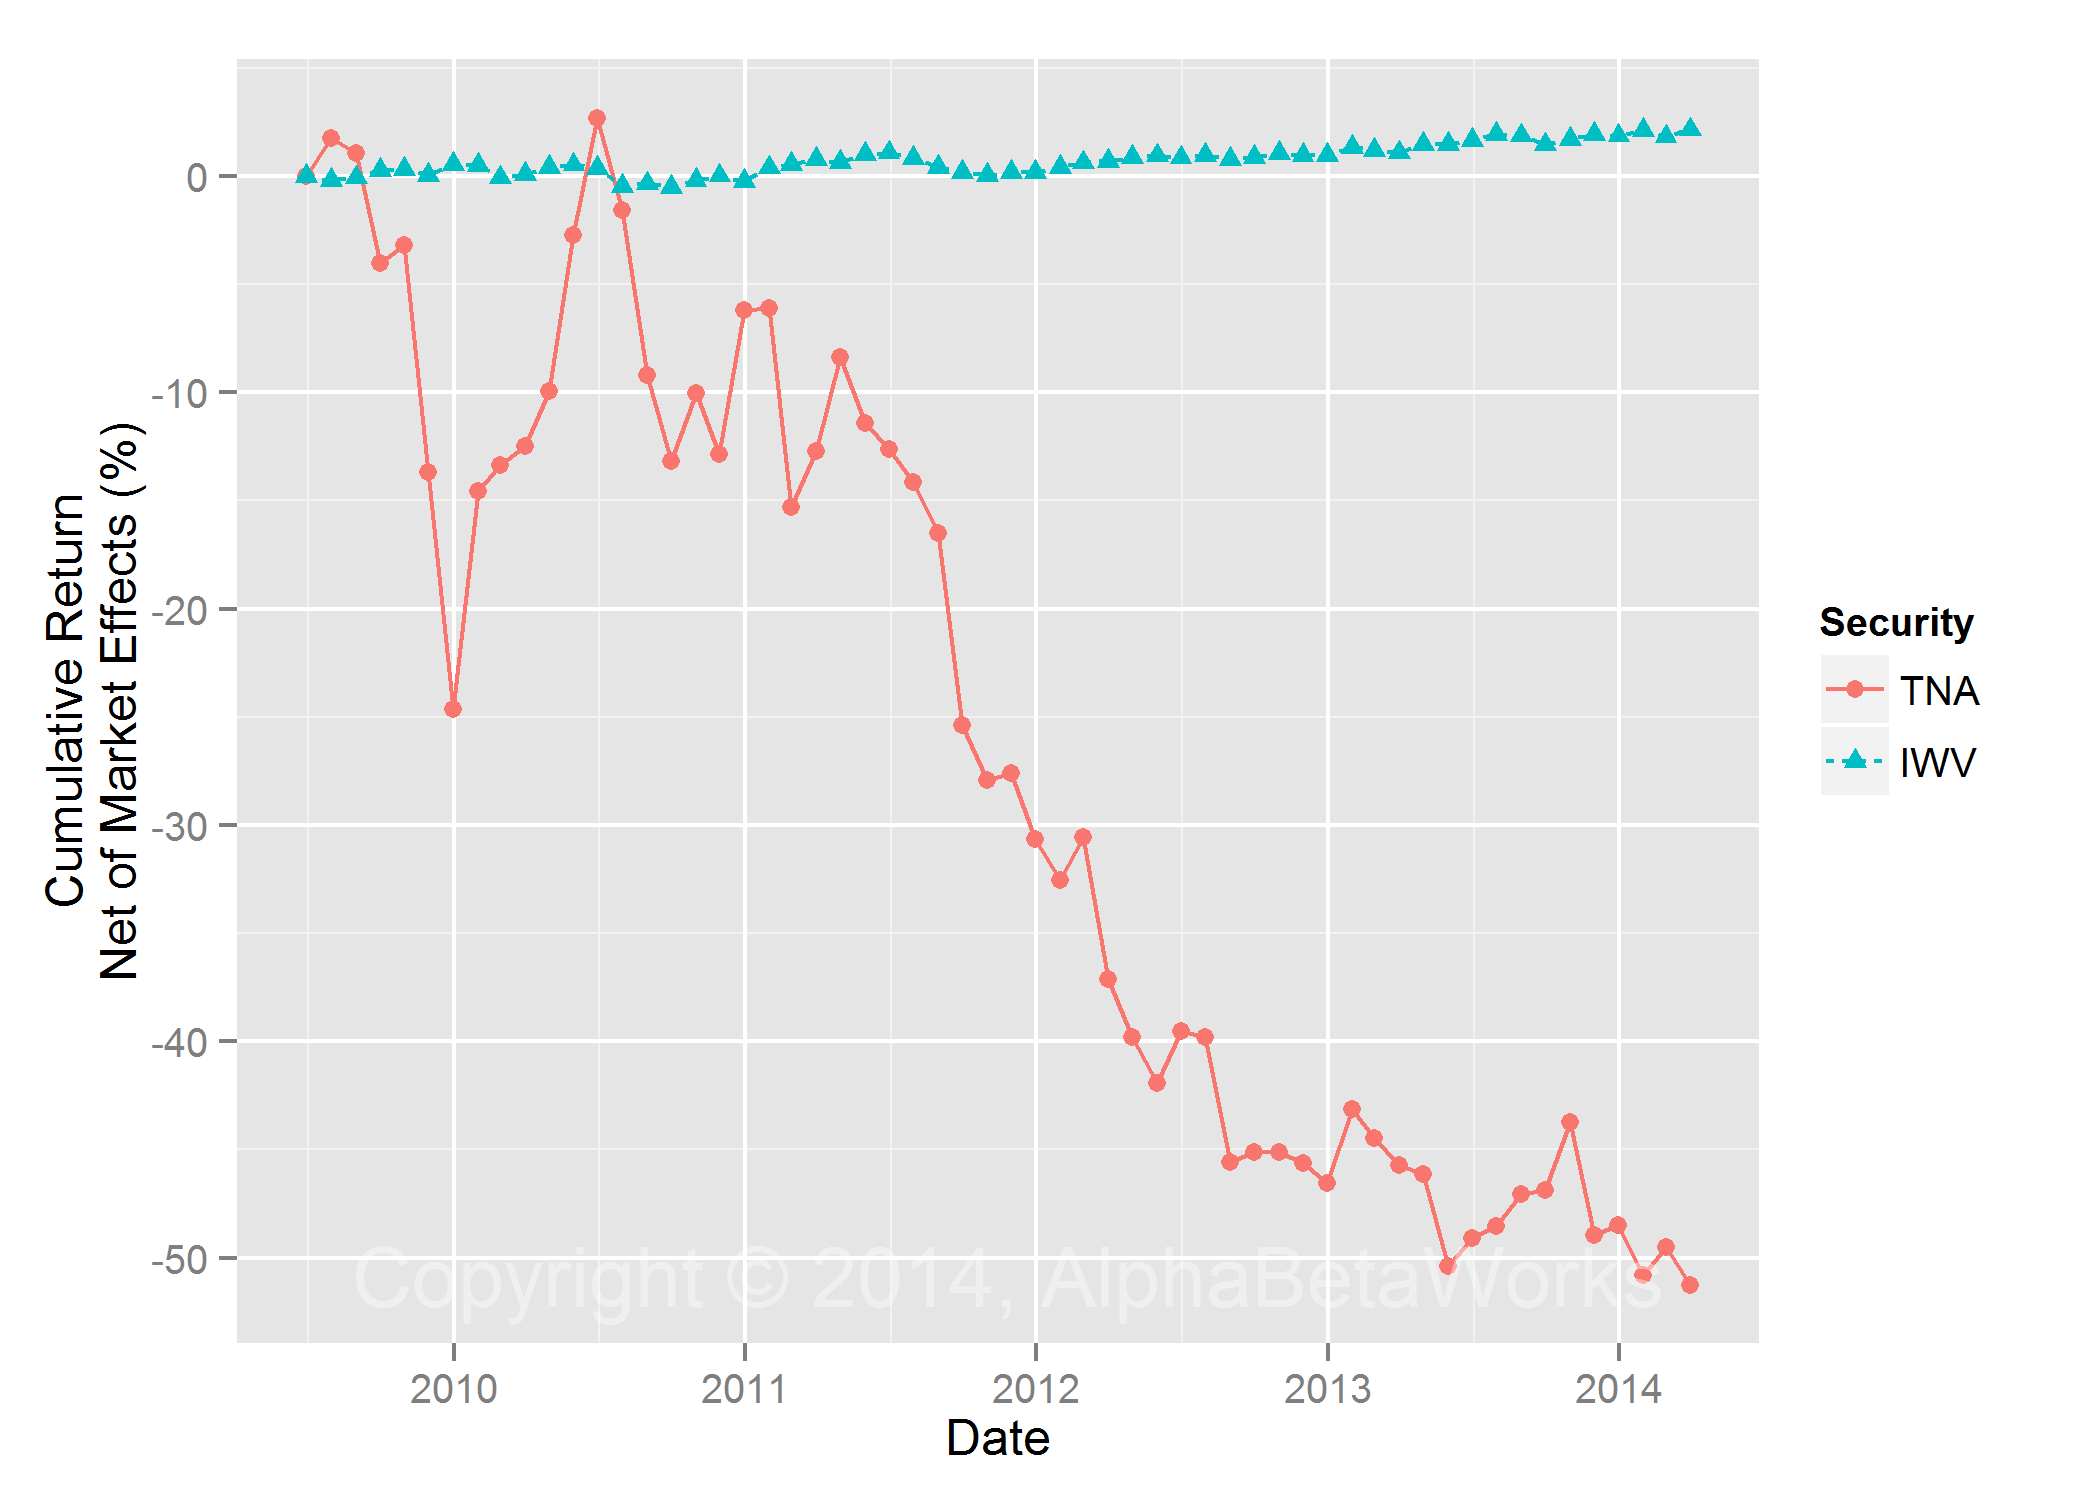
However, this positive relationship is entirely due to the shared market component of their returns. When these returns are stripped of market noise, a negative relationship emerges:

US Industrial and Healthcare Sector Return Correlation, Net of Market Effects

US Industrial and Healthcare Sector Return Correlation, Net of Market Effects

A simplistic analysis of sector index performance is often misleading: A portfolio manager may conclude that, given the high correlation between healthcare and industrials indices, one is a good hedge for the risk of the other. In reality, though their overall returns look similar, their industry-specific returns are negatively correlated. A risk model that cannot tell whether the relationship between sectors is positive or negative will produce erroneous estimates of risk and yield suboptimal portfolios.

The underlying differences in sector performance emerge once market and other macroeconomic effects are removed. Accordingly, pure sector returns provide insights into relative performance, trends, and fundamentals.

Best and Worst Performing Sectors: First Half of 2014

Below are two charts showing YTD performance of the best- and worst-performing sectors.  The first is the performance without removing market and macroeconomic noise:

Sector Index Returns, YTD

Sector Index Returns, YTD

Below are the best and worst performing sectors in the first half of 2014, after market and macroeconomic noise is removed:

Pure Sector Returns, Net of Market Effects, YTD

Pure Sector Returns, Net of Market Effects, YTD

Electronics Appliance Stores -31%
Internet Retail -24%
Forest Products -20%
Commercial Printing Forms -16%
Steel -16%
Pharmaceuticals Generic +18%
Airlines +19%
Beverages Alcoholic +21%
Pharmaceuticals Other +22%
Aluminum +23%

Best and Worst Performing Sectors: Trailing Five Years

The above differences in short-term performance between sector indices and pure sector factors may appear minor; they are far more dramatic over the long term. All but one sector index have generated positive returns over the past five years (including market performance):

Sector Index Returns, Trailing Five Years

Sector Index Returns, Trailing Five Years

The market tide lifted all industry boats, obscuring their intrinsic performance. The chart below, with market and macroeconomic noise removed, tells a different story. The worst-performing pure sector factors have lost over 50%. The industry-specific returns of the top performers are also substantially lower.

Pure Sector Returns, Net of Market Effects, Trailing Five Years

Pure Sector Returns, Net of Market Effects, Trailing Five Years

Steel -74%
Aluminum -70%
Coal -70%
Electronics Appliance Stores -70%
Consumer Sundries -69%
Airlines +100%
Movies Entertainment +102%
Food Specialty Candy +111%
Oil And Gas Pipelines +121%
Pharmaceuticals Generic +242%

Best Long-Term Performance: Generic Pharmaceuticals

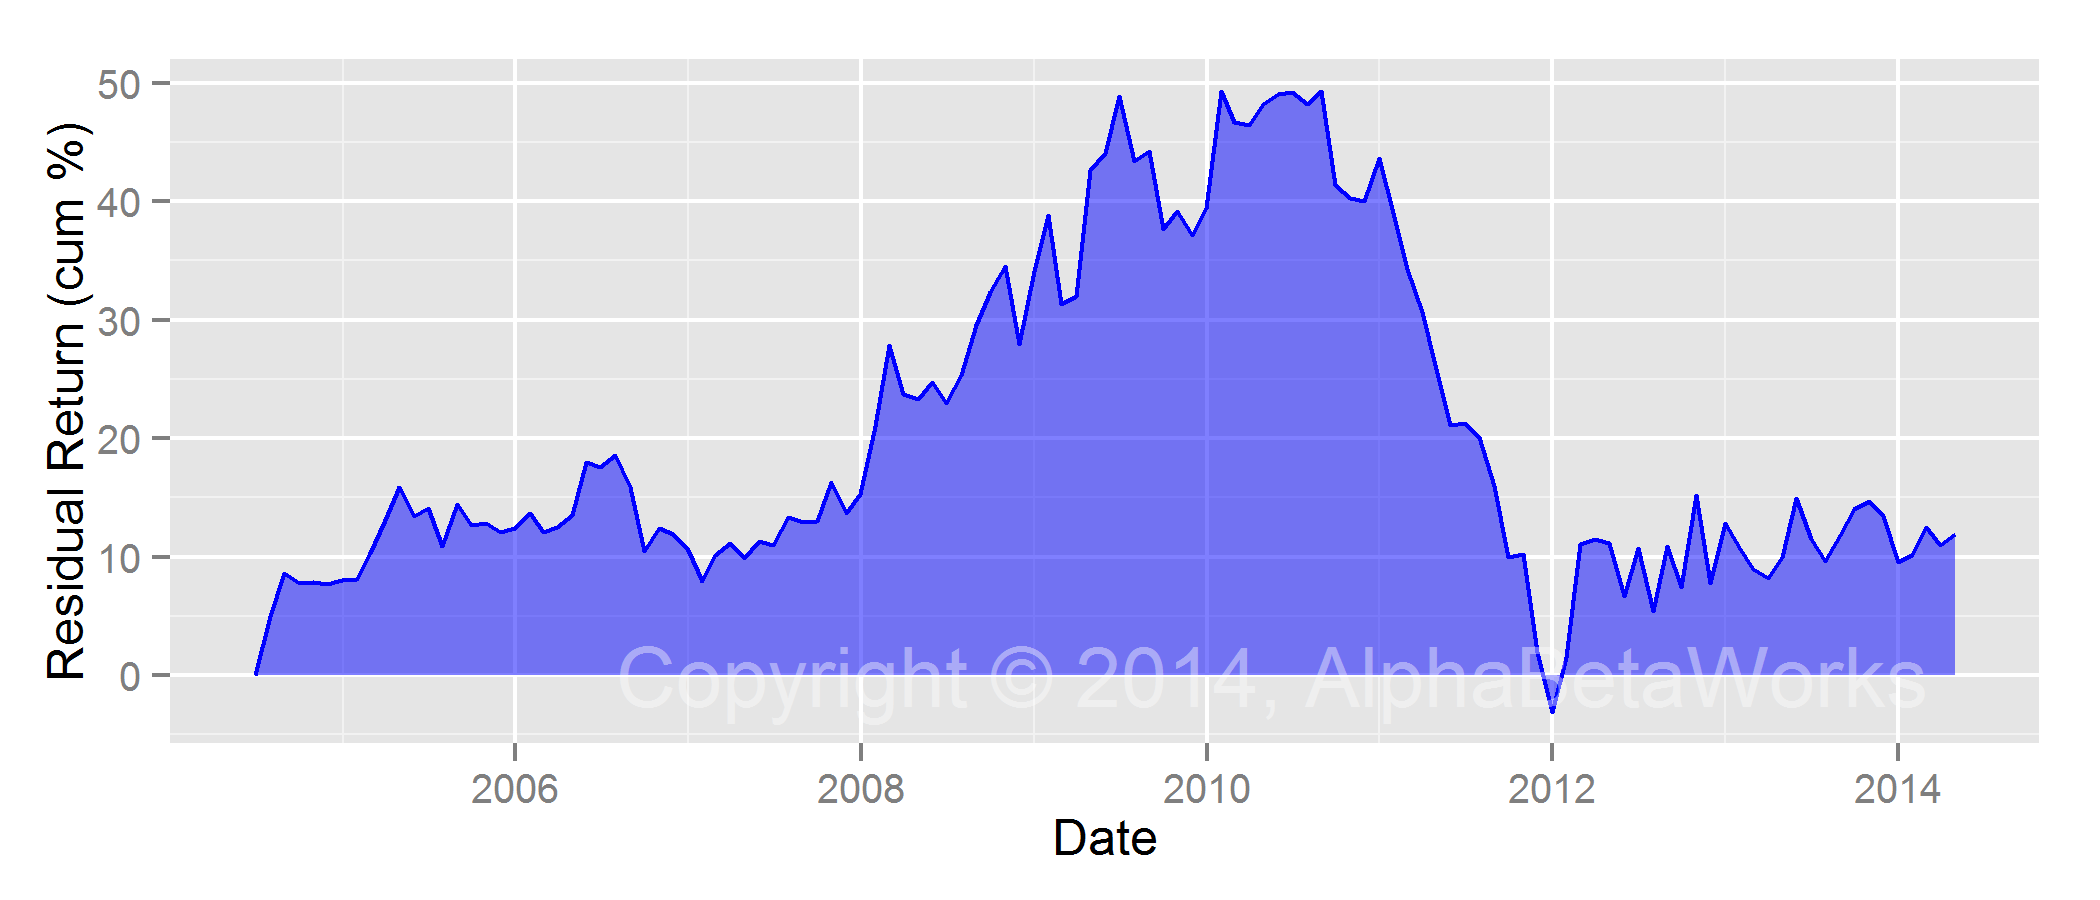
The Generic Pharmaceuticals Sector had the best 5-year performance and remains one of the top performers in 2014. The uptrend started in 2008, continued through the market turmoil, and has persisted for over six years:

Generic Pharmaceuticals Pure Sector Return

Generic Pharmaceuticals Pure Sector Return

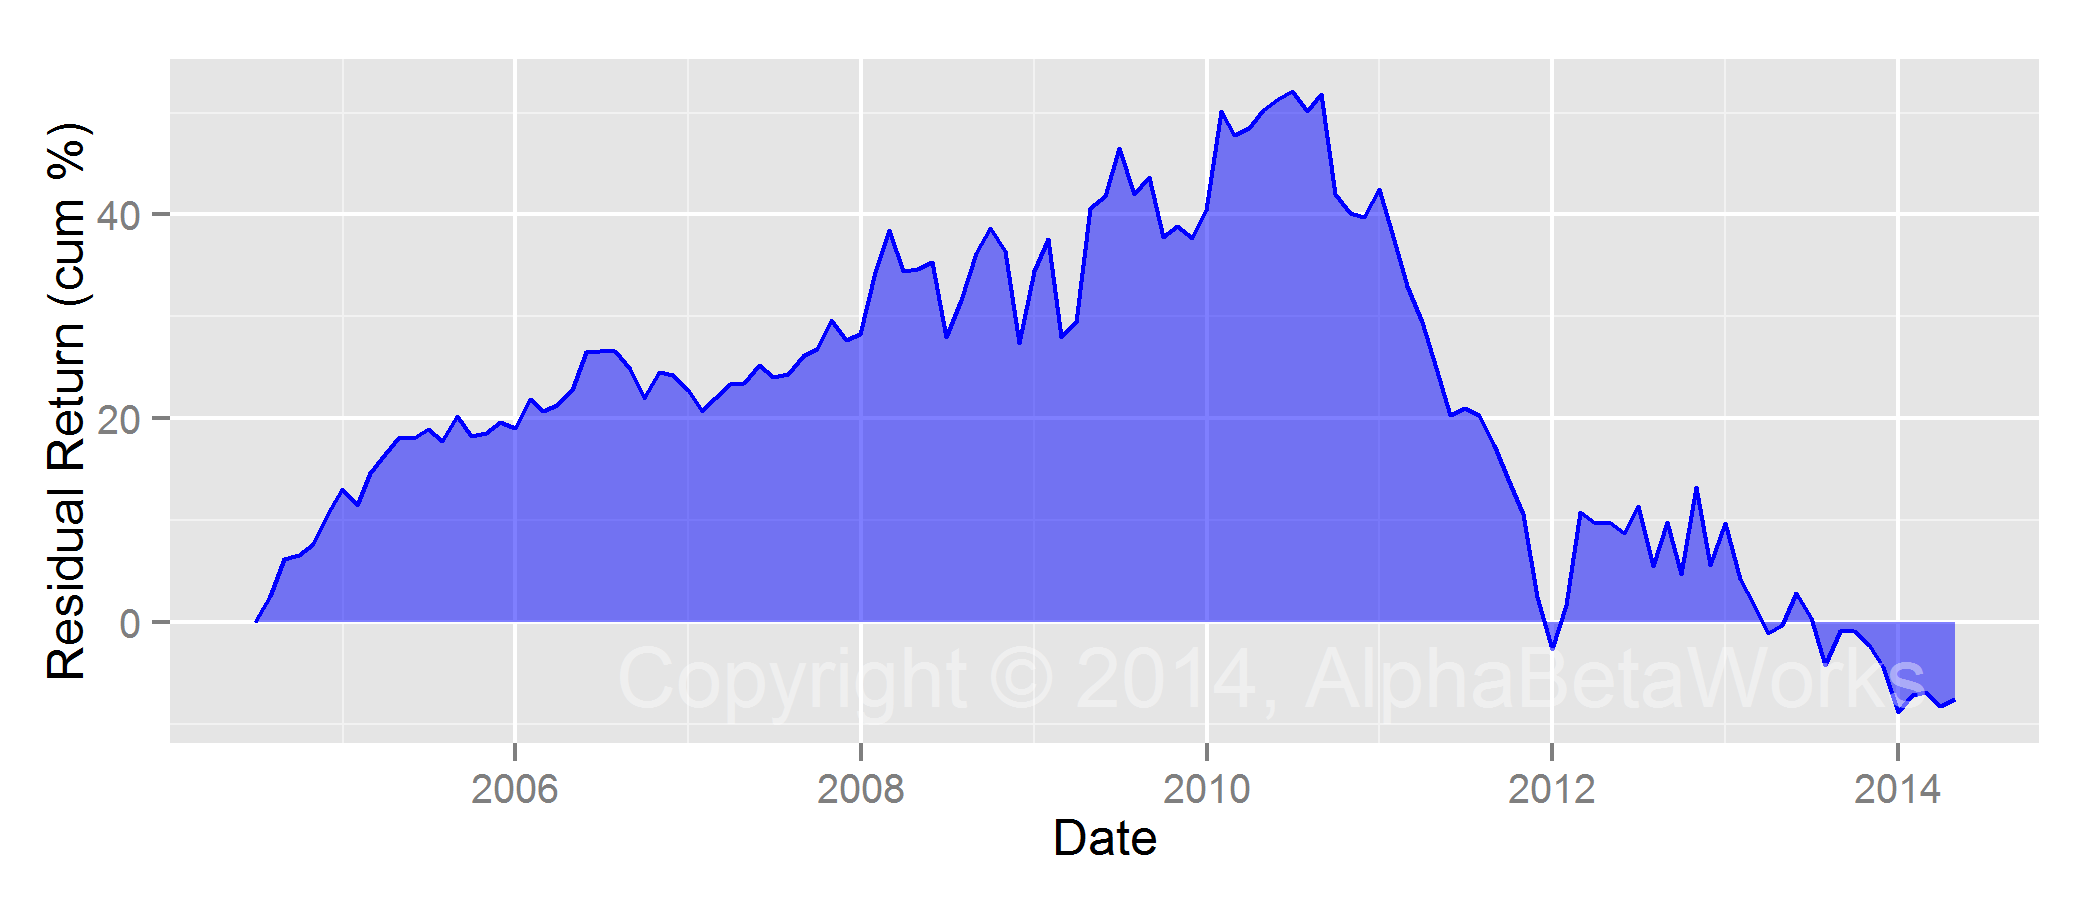
Worst Long-Term Performance: Steel

The Steel Producers Sector had the worst 5-year performance and remains among the worst performers in 2014. This time series tells a story of broad economic and geopolitical trends: industry overcapacity, the Chinese commodity boom, and uneconomic over-investment, precipitating a return to overcapacity:

Steel Producers Pure Sector Return

Steel Producers Pure Sector Return

This story is not visible in a simplistic index performance chart. Obscured by market noise, the clean trends of pure sector returns disappear:

Chart of the Cumulative Return of the Steel Producers Sector Index

Steel Producers Sector Index Return

Conclusions

  • Industry-specific performance is clouded by market noise.
  • By stripping away the effects of market and macroeconomic variables, we can calculate the returns of pure sector factors.
  • Pure sector factors exhibit strong trends and are valuable indicators for tactical portfolio allocation.
  • Pure sector factors are required for robust risk management, performance attribution, and investment skill evaluation.
  • Failure to isolate pure sector factors leads to flawed risk analysis, performance attribution, and skill evaluation.

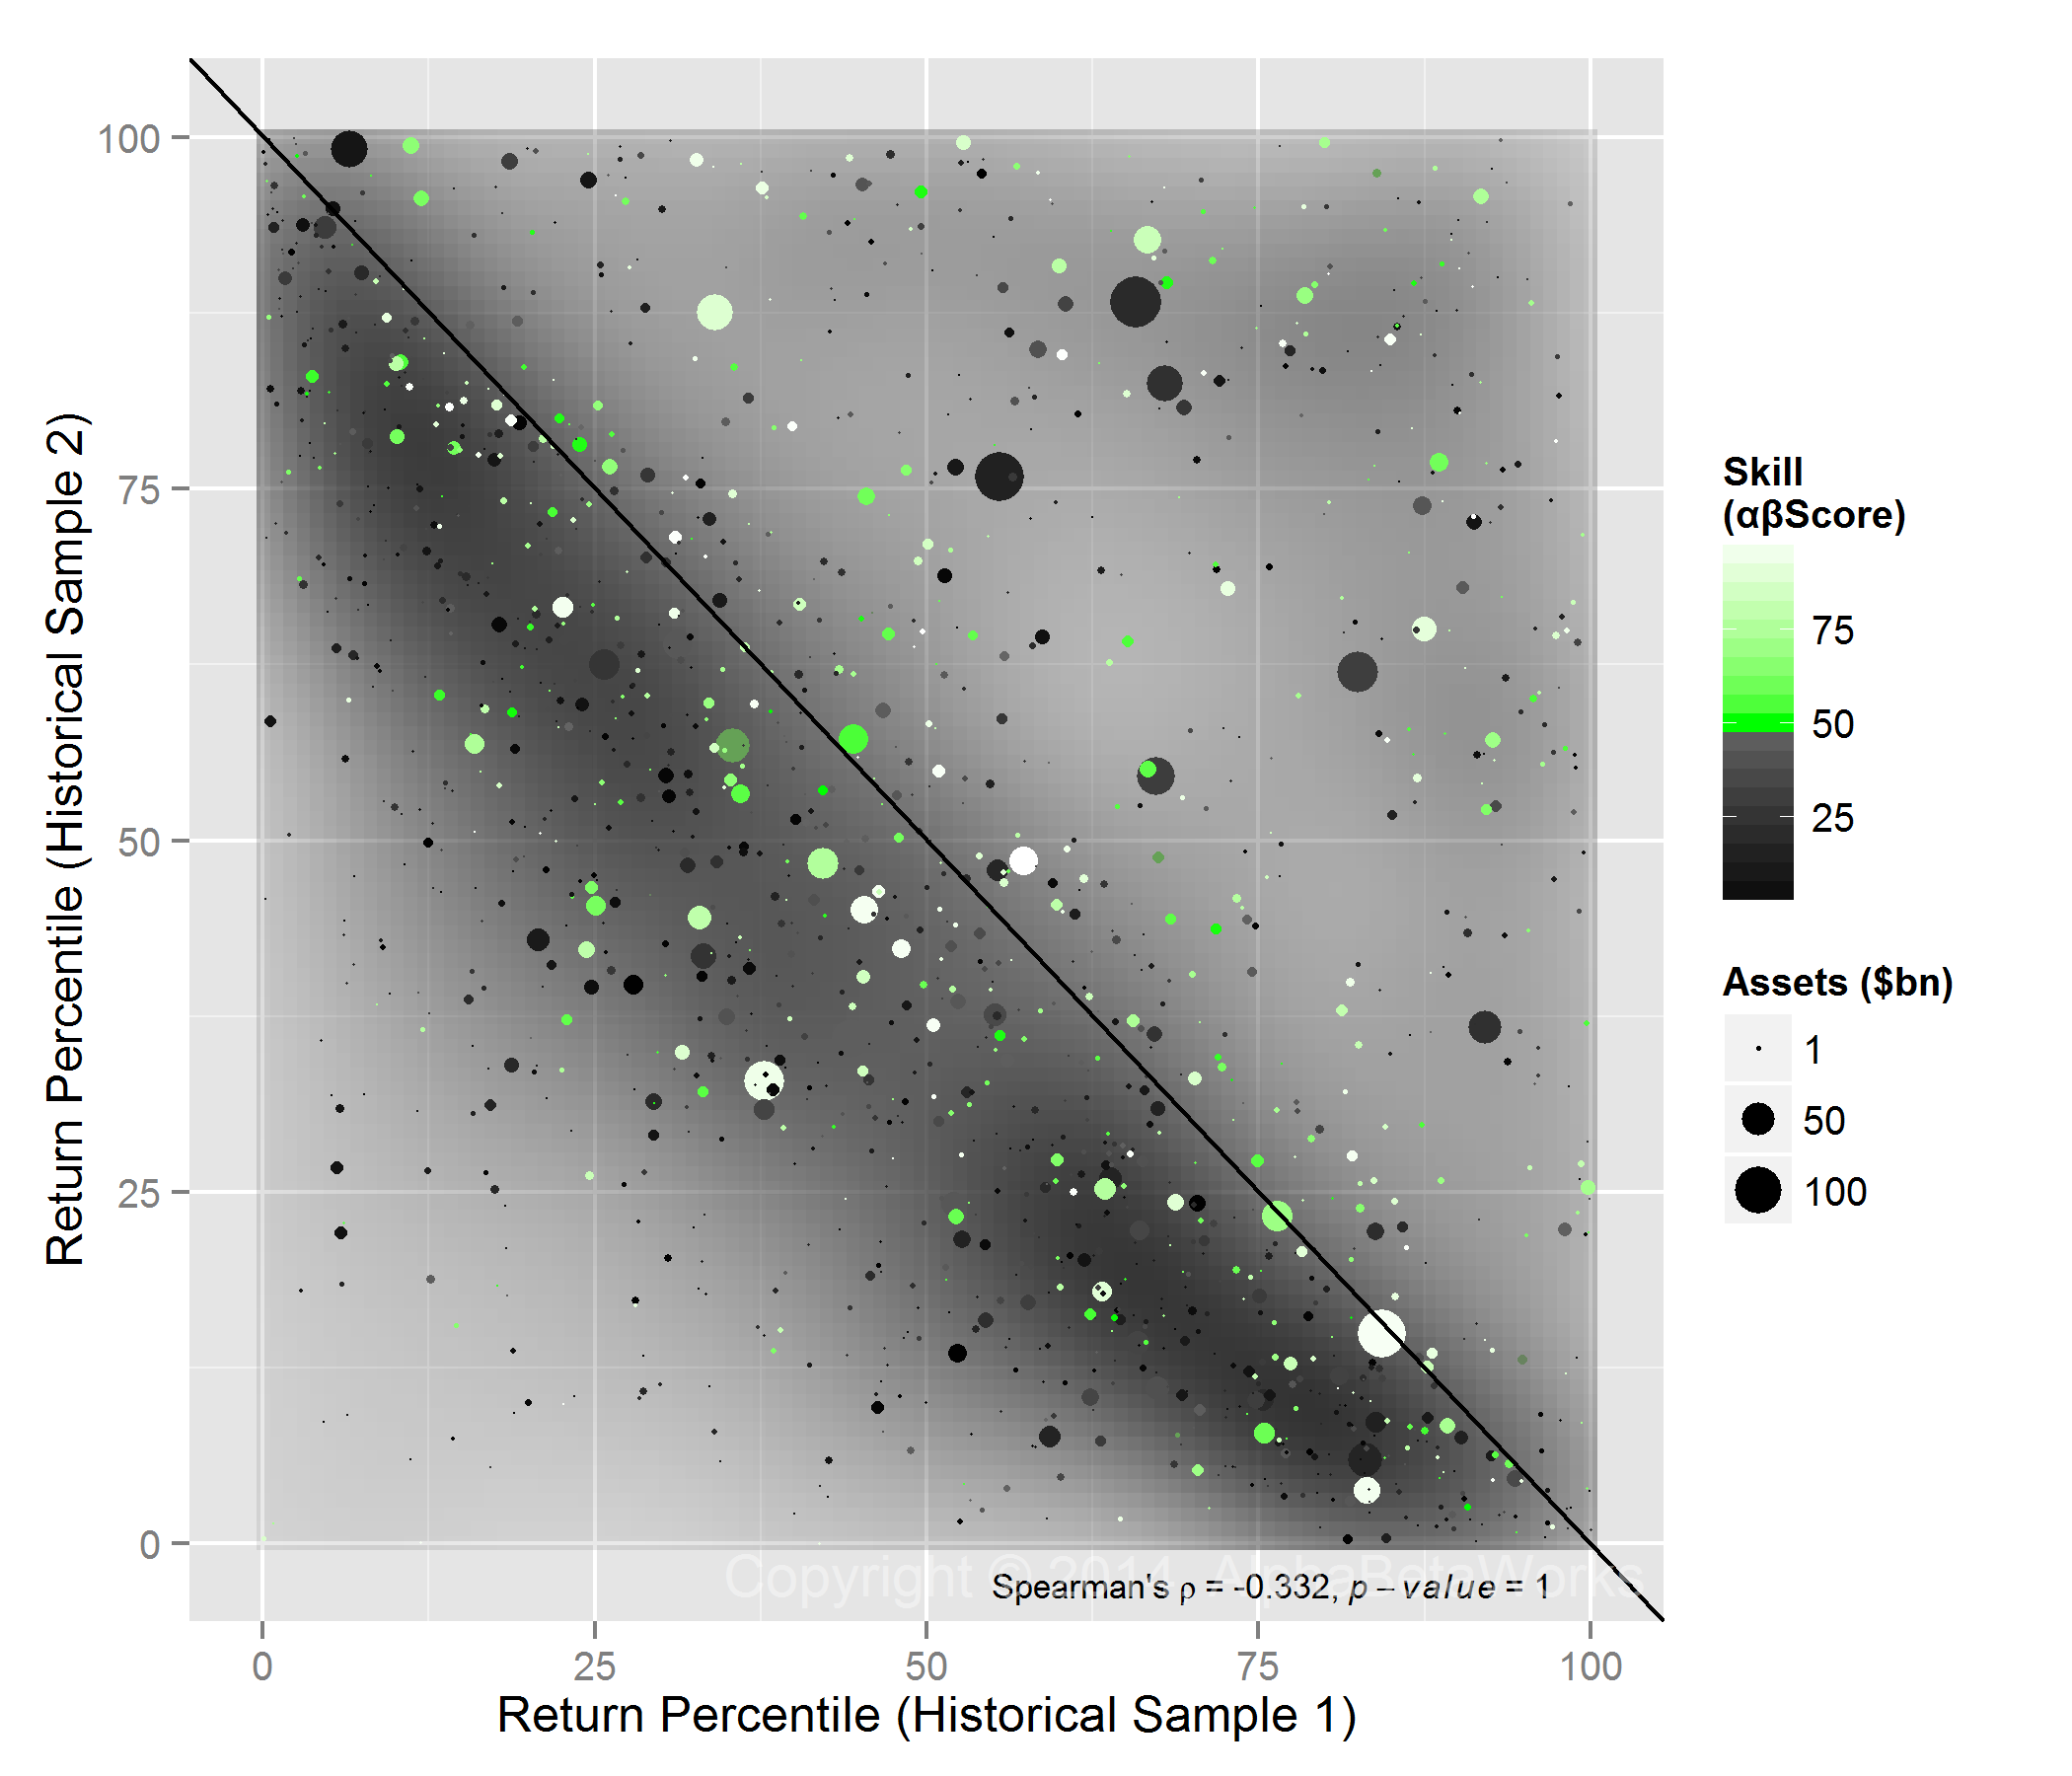
While we alluded to the trends in sector factor returns, we have not yet provided hard evidence that historically top-performing sector factors continue to outperform. Our upcoming articles on sector factors will address their return persistence.

The information herein is not represented or warranted to be accurate, correct, complete or timely.
Past performance is no guarantee of future results.
Copyright © 2012-2014, AlphaBetaWorks, a division of Alpha Beta Analytics, LLC. All rights reserved.
Content may not be republished without express written consent.

Mutual Fund Closet Indexing – Part 1

Are you Paying Active Fees for Passive Management?

Closet indexing may be practiced by 20% to 50% of “active” medium and lower turnover US mutual funds. To make this case, we improve on traditional holdings- and returns-based closet indexing metrics. Simply by testing for closet indexing, investors can save billions in management fees each year.

Closet Indexing

A 2009 study introduced the concept of Active Share to measure the degree to which a fund is actively managed, showing that active stock pickers outperform closet indexers. Another notable active management metric is with respect to a multifactor model.  Both metrics have their drawbacks:  Active Share relies on vulnerable holdings-based analysis. For example, suppose a manager holds a position in a benchmark ETF; this position will increase Active Share without making the fund more active. R² relies on returns-based analysis, which does not distinguish between passive factor exposures and market timing, among other limitations. Hence, both metrics are susceptible to manipulation and may not properly identify passive funds.

A Robust Approach

The AlphaBetaWorks approach relies on risk and attribution capabilities free of the above issues. We surveyed ten years of historical holdings of approximately 1,700 non-index medium and lower turnover mutual funds with at least 5 years of position history. This group manages over $3.4 trillion in assets. We used our proprietary Statistical Equity Risk Model on historical holdings to estimate fund risk at the end of each month. We then attributed the following month’s returns to factor (market), and residual (security-specific) sources. We compared the variance of residual and factor returns of the group to NASDX, a NASDAQ 100 ETF. We selected this ETF as a passive reference strategy that is more concentrated than broad market benchmarks but less concentrated than granular sector indices. Using an S&P 100 ETF yields similar conclusions.

For NASDX, factor exposures at the end of a given month explain approximately 95% of return variance in the following month. The remaining 5% residual variance is due to security selection.

How active are funds in our group compared to this 100-position ETF? A quarter (425 funds) had a lower share of residual variance – they were less active stock pickers:

Security Selection Share of Historical US Mutual Fund Variance

Security Selection Share of Historical US Mutual Fund Variance

Security selection is not the only source of active performance. The variation in factor exposures, or factor (market) timing, is another. The NASDAX’s historical factor exposures were not constant over the last 10 years. This factor exposure variation is responsible for 4.1% of monthly return variance. Eighty percent (1,354 funds) had been less active market timers:

Market Timing Share of Historical US Mutual Fund Variance

Market Timing Share of Historical US Mutual Fund Variance

Active returns consist of both security selection and market timing. In the case of NASDX, 93.3% of its 10-year monthly return variance can be explained by passive factor bets, while 6.7% is active. We call the latter figure the Active Share of Variance.

Using the F test to evaluate whether historical Active Share of Variance of a given fund exceeded that of NASDX, we produced a confidence level that a fund has been more active than the ETF. The following chart illustrates the confidence that each fund in our group has been active and shows Historical Active Shares of Variance due to security selection and market timing:

Distribution of Historical Active Share of Variance and Confidence that a Fund is Active

Distribution of Historical Active Share of Variance and Confidence that a Fund is Active

At the 95% confidence level, fewer than half of the funds (737) have been more active than the ETF; more than a fifth (350) have been less active. The test is inconclusive for the remaining 36% (602 funds), suggesting that investors can’t be certain that over half the “active” mutual funds surveyed are in fact active:

Distribution of Confidence that a Fund is Active

Distribution of Confidence that a Fund is Active

Conclusions

  • Over half (56%) of active US mutual funds surveyed are not significantly more active than a 100-position NASDX ETF.
  • Less than half (44%) of the funds are significantly more active that the ETF.
  • More than a fifth (21%) of the funds are significantly less active than the ETF.
  • Investors must be sure that they are not being charged active fees for passive management.
  • By identifying closet indexers within this group alone, investors could save between $4 and $15 billion in annual management fees.

This work improves on traditional holdings-based and returns-based analyses of fund activity. Admittedly, we use a subjective benchmark for activity – a specific passive ETF. In later notes we will use the AlphaBetaWorks Performance Analytics Platform to evaluate activity levels using objective metrics.

Copyright © 2012-2014, AlphaBetaWorks, a division of Alpha Beta Analytics, LLC. All rights reserved.
Content may not be republished without express written consent.


Three Holdings-Based Style Analysis Tests

Or How to Tell if You Are Paying Top Dollar for a Flawed System

This article is part of an ongoing series exploring flaws in popular investment risk and skill evaluation techniques. We focus on the most common pitfalls that have been particularly costly for asset managers and fund investors over the years.

The two primary approaches to investment risk and skill evaluation are returns-based style analysis and holdings-based style analysis. These approaches are also the foundation of returns-based and holdings-based performance attribution. Our previous article discussed problems with returns-based analysis that can lead to flawed estimates of risk and skill – costly mistakes for fund investors and allocators. Here, we examine what it takes for holdings-based approaches to succeed.

Holdings-Based Analysis Can be Effective

In theory, holdings-based analysis can leverage all the available information on a portfolio and its constituents: past returns, composition, past holdings’ return and fundamental data. Since this information is a super-set of the data returns-based analysis uses, holdings-based analysis should be more effective.

In practice, the effectiveness of holdings-based style analysis and holdings-based performance attribution depends on the effectiveness of the underlying risk model. The risk model translates historical holdings data into portfolio style, or risk, data.

The Elements of Fund Style

A holdings-based analysis must capture the main Risk Factors that drive fund returns. We used the AlphaBetaWorks Performance Analytics Platform to analyze 15 years of portfolio and performance history of approximately 3,000 medium and lower turnover US mutual funds to determine the main sources of fund risk and return:

Factors Contributing Most to US Mutual Fund Performance

Factors Contributing Most to US Mutual Fund Performance

Approximately 76% of the variation in monthly performance of these funds is explained by their US Market Factor exposures, or US Market Betas. Sector factors, or sector betas, such as Finance and Technology, explain a further 4%. Traditional style factors, such as Value and Size explain approximately 1%.

The primacy of market and sector factors is consistent with existing research, including findings that in periods such as 1999-2001 the performance of Style Factors may be entirely due to sector effects. For holdings-based analysis to be effective, it must accurately identify market/region and sector exposures (betas).

Tests of Holdings-Based Analysis

Market factor exposure is the primary driver of fund risk and returns. Therefore, the first step in evaluating any model used for holdings-based style analysis and attribution is to establish how well it can discriminate between low-beta and high-beta securities.

We use two well-known financial stocks as examples. Bank of America Corporation (BAC) is more financially levered than M&T Bank Corporation (MTB). One would expect BAC to have correspondingly higher systematic risk. A chart of monthly returns confirms this hypothesis:

BAC Monthly Returns vs MTB Monthly Returns

BAC Monthly Returns vs MTB Monthly Returns

BAC is significantly correlated with, and levered to, the returns of MTB. Correlation among securities is due to shared systematic risk, primarily market and sector factors. Therefore, BAC’s risk factor exposures should be higher than MTB’s.

Holdings-Based Analysis Test 1 – Market Risk

As anticipated, BAC’s US Market exposure is approximately two times larger:

MTB and BAC Returns vs Market Factor Return

MTB and BAC Returns vs Market Factor Return

If a holdings based risk system suggests that $1 invested in BAC and $1 invested in MTB have similar US Market Risks, then it is flawed. It will fail to correctly measure market risk – the single most important driver of fund risk and return.

Holdings-Based Analysis Test 2 – Sector Risk

The next essential question is whether the higher risk of BAC is solely due to its higher US Market Beta. Intuitively, the higher leverage of BAC should affect its exposure to all risk factors, not just market risk. Therefore, one would also expect BAC’s Finance Sector Factor Exposure to be approximately twice as large. Indeed it is:

MTB and BAC Returns Net of Market Effects vs Finance Factor Return

MTB and BAC Returns Net of Market Effects vs Finance Factor Return

If a holdings-based risk system suggests that $1 invested in BAC and $1 invested in MTB have similar Finance Sector Risk, then it is flawed. It will fail to correctly measure sector risk – the second most important driver of fund risk and return.

Holdings-Based Analysis Test 3 – Levered ETFs

It can be time-consuming to test a holdings-based system with individual levered securities.  One must:

  • Identify two stocks with distinct market betas and correlation
  • Verify the difference in market exposures of these two stocks
  • Identify two stocks with distinct sector betas and correlation
  • Verify the difference in sector exposures of these two stocks

We propose a shortcut that will identify many, but not all, of the holdings-based systems that fail:

  • Take a levered and an un-levered ETF or index fund that track the same Index
  • Verify the difference in factor exposures of these securities
  • Verify that factor exposures are consistent with leverage

For example, consider Direxion Daily Small Cap Bull 3x Shares (TNA) and iShares Russell 3000 ETF (IWV):

Cumulative Returns for a Levered ETF (TNA) and an Un-Levered ETF (IWV)

Cumulative Returns for a Levered ETF (TNA) and an Un-Levered ETF (IWV)

Any competent risk system should assign TNA approximately 3x the exposures of IWV:

Returns for a Levered ETF (TNA) and an Un-levered ETF (IWV) vs Market Factor Return

Returns for a Levered ETF (TNA) and an Un-levered ETF (IWV) vs Market Factor Return

A performance attribution system should find that, due to time decay over the long term, the levered fund generates negative returns net of its factor exposures:

Cumulative Returns Net of Market Effects for a Levered ETF (TNA) and an Un-levered ETF (IWV)

Cumulative Returns Net of Market Effects for a Levered ETF (TNA) and an Un-levered ETF (IWV)

Unfortunately, some of the most highly-priced risk models, holdings-based style analysis tools, and performance attribution systems fail even this simple test.

Conclusions

A system that does not distinguish between low- and high- market and sector exposures (betas) will be fatally flawed. It will:

  • Underestimate the risk of high-risk portfolios
  • Overestimate the risk of low-risk portfolios
  • During bull markets, deem as skilled poor stock pickers passively taking high risk
  • During bull markets, deem as unskilled excellent stock pickers passively taking low risk

AlphaBetaWorks Statistical Equity Risk Model and Performance Analytics Platform are resilient against the issues identified above, having been refined on thousands of portfolios and tested over decades of history. Regrettably, some of the most commonly used commercial products exhibit these flaws. Even the highest-priced offerings are not immune. Investment Managers and Capital Allocators that are unaware of these flaws will be doubly-blindsided in periods of market turmoil. Their realized risk may be higher than estimated. Their “best” managers may turn out to be their worst.

Copyright © 2012-2014, AlphaBetaWorks, a division of Alpha Beta Analytics, LLC. All rights reserved.
Content may not be republished without express written consent.


The Flaws of Returns-Based Style Analysis

This article is part of an ongoing series exploring flaws in popular investment risk and skill evaluation techniques. We focus on the most common pitfalls that have been particularly costly for asset managers and fund investors.

Investment risk and skill evaluation frequently relies on returns-based style analysis, and returns-based performance attribution. These techniques perform regressions to compute portfolio betas (exposures to systematic risk factors) and alphas (residual returns unexplained by systematic risk factors).

The simplicity of returns-based approach has made it popular. It is often the only practical method for evaluating multi-asset-class portfolios that span commodities, public securities, derivatives, and private investments. However, this simplicity comes at a heavy cost, which we explore in this and upcoming articles.

The Assumption of Stable Exposures

A key assumption of most returns-based analyses is the constancy of factor exposures. This assumption breaks down for active managers.

A good example of this is the Fairholme Fund, ticker FAIRX. The Fairholme Fund has dramatically varied its bets over the past ten years. A simple linear regression of historical fund returns against the US Market is below.  It estimates beta at 1.14 and monthly alpha at 0.12%:

The Fairhome Fund (FAIRX) Returns vs the US Market

The Fairholme Fund (FAIRX) Returns vs the US Market

This and similar regression approaches form the basis of returns-based analysis. This convenient but overly simplistic analysis does not attempt to estimate market exposure at each point in time. Hence, the beta of 1.14 may not be representative of the current or historical US Market exposures of a fund.

The Variation of Exposure

To test this beta, we estimated monthly US Market exposures of the fund using the AlphaBetaWorks US Equity Risk Model. For each month, we estimated the betas (exposures) of individual positions to the US Market Factor and aggregated these into monthly estimates of aggregate portfolio beta. It turns out that over the past 10 years the Fairholme Fund has varied its US Market Exposure between 50% and 170%:

The Fairhome Fund (FAIRX) Market Factor Exposure History

The Fairholme Fund (FAIRX) Market Factor Exposure History

The US Market Exposure ranged from 50% to 170% and was infrequently anywhere near 110%. It turns out, risk estimated using returns-based analysis is inaccurate most of the time. It is also an inaccurate estimate of the true mean exposure:

The Fairhome Fund (FAIRX) Historical US Market Exposure Distribution

The Fairholme Fund (FAIRX) Historical US Market Exposure Distribution

Consequences of Varied Exposures

Returns-based analysis can produce deeply flawed estimates of the current risk for funds that vary their bets. Even estimates of average risk and style may be inaccurate. In the case of the Fairholme Fund, the returns-based estimate of US Market exposure—around 110%—is well off from the current portfolio exposure—around 140%. To make matters worse, there is a domino effect: Returns-based performance attribution builds upon any errors in returns-based style analysis, compounding them.

Anyone paying for an actively managed investment product must have confidence that expected future active returns exceed fees. Returns-based style analysis and performance attribution are frequently used for this purpose. Can this analysis be trusted?

We estimated cumulative alpha, or residual return, for the Fairholme Fund with a single risk factor for the US Market using the returns-based exposure of 110% calculated above:

The Fairhome Fund (FAIRX) Cumulative Returns-based Alpha

The Fairholme Fund (FAIRX) Cumulative Returns-based Alpha

Unsurprisingly, errors in the beta estimate lead to a flawed picture of a fund’s security-selection performance. The returns-based approach estimates cumulative alpha greater than 10%. AlphaBetaWorks approach, aggregating the betas of the individual portfolio positions throughout the period, produces a negative value:

The Fairhome Fund (FAIRX) Cumulative Single-factor Model Alpha

The Fairholme Fund (FAIRX) Cumulative Single-factor Model Alpha

An investor who used returns-based style analysis and attribution would have estimated significant positive security-selection performance. In reality, an investor would have outperformed by taking the same market risks passively. A capable risk model specifically tuned for skill evaluation and performance prediction, such as the AlphaBetaWorks Statistical Equity Risk Model, averts this and similar pitfalls.

Conclusions

  • Returns-based analysis can be effective—but only when a passive manager does not significantly vary exposures to market, sector, and macroeconomic factors.
  • When an active manager varies bets, a returns-based analysis typically yields flawed estimates of portfolio risk.
  • When a manager varies bets, a returns-based analysis may not even accurately estimate average portfolio risk.
  • A returns-based analysis will be the least predictive for active managers. In fact, errors will be most pronounced for the most active funds:
    • Estimates of a managers’ historical and current systematic risks may be flawed.
    • Skilled funds may be deemed unskilled.
    • Unskilled funds may be deemed skilled.
  • An analysis and aggregation of factor exposures of individual holdings throughout portfolio history using a capable multi-factor risk model addresses these shortcomings.

More subtle, but no less dangerous, issues with investment risk and skill evaluation using returns-based performance attribution will be discussed in subsequent articles.

AlphaBetaWorks Risk Models and Performance Analytics Platform have been specifically engineered to avoid such issues and refined on thousands of hedge fund and mutual fund portfolios over decades of history. We look forward to sharing more of our insights.

Copyright © 2012-2014, AlphaBetaWorks, a division of Alpha Beta Analytics, LLC. All rights reserved.
Content may not be republished without express written consent.


Why Investment Risk and Skill Analytics Matter

If a fund posts returns that beat the indices, with moderate volatility and low benchmark correlation, there is no guarantee that such performance will continue. Comparable results might have been achievable with a passive portfolio. The fund could have taken hidden systematic risks or it may have been lucky. This happens often. Among Medium Turnover U.S. Mutual Funds, the relative ranking of a fund’s returns in one sample of history is negatively correlated to its relative ranking in the other. When “skill” is evaluated naively, “the best” funds in one period tend to become “the “worst” in another and vice versa:

Chart Illustrating That U.S. Mutual Fund Returns Revert to the Mean

U.S. Mutual Fund Returns Revert

The Sharpe Ratio and similar metrics simply re-process the same return data, presenting it in a different form. They too suffer from the same problems as simple return ranking:

Chart Illustrating that U.S. Mutual Fund Sharpe Ratios Revert to the Mean

U.S. Mutual Fund Sharpe Ratios Revert

The challenge is to look beneath the surface to determine whether the true source of returns is investment skill (stock picking, market timing, etc.), or some combination of luck, high beta, and outsized risk. Investment skills, when properly measured, are significant predictors of future performance.

Properly-designed risk models can be used to filter out the effects of systematic risk, exotic market bets, and luck. When these models are designed from the ground-up to evaluate skill, and are combined with robust statistical techniques, the result is predictive analytics. The best funds in one period tend to remain the best in another.  Same for the worst:

A Chart Illustrating that AlphaBetaReturns Predict Future U.S. Mutual Fund Performance

αβReturns Predict Future U.S. Mutual Fund Performance

AlphaBetaWorks focuses on the development of robust risk models that result in the evaluation of investment risk and predictive investment skills.

Copyright © 2012-2014, AlphaBetaWorks, a division of Alpha Beta Analytics, LLC. All rights reserved.
Content may not be republished without express written consent.