
Analyses of hedge fund crowding typically focus on hedge funds’ individual positions (their residual, idiosyncratic, or stock-specific exposures). Yet, over 85% of the monthly return variance for the majority of hedge fund long equity portfolios is due to their factor (systematic) exposures. Stock-specific bets account for less than 15%. Factor – rather than residual – crowding has driven much of the industry’s past exuberance and its recent grief. In Q1 2016, nearly half of U.S. hedge funds’ relative long equity risk (tracking error) was due to a single factor, U.S. Market Exposure. This piece surveys the crowded factor and residual exposures at 3/31/2016 that are likely to drive long equity performance for hedge funds in coming quarters.
Identifying Hedge Fund Crowding
This piece follows the approach of our earlier articles on crowding: We processed regulatory filings of over 1,000 hedge funds and created a position-weighted portfolio (HF Aggregate) consisting of all tractable hedge fund long U.S. equity portfolios. We then analyzed HF Aggregate’s risk relative to the U.S. Market using the AlphaBetaWorks Statistical Equity Risk Model – a proven system for performance forecasting. The most crowded hedge fund bets are factors and, to a lesser extent, stocks that drive HF Aggregate’s relative risk and performance. Ironically, these are rarely the largest or the most common hedge fund positions.
Hedge Fund Aggregate’s Risk
The Q1 2016 HF Aggregate had 3.4% estimated future tracking error relative to the U.S. Market. Factor (systematic) exposures accounted for over two thirds of it:

Components of the Relative Risk for U.S. Hedge Fund Aggregate in Q1 2016
| Source | Volatility (ann. %) | Share of Variance (%) |
| Factor | 2.78 | 68.23 |
| Residual | 1.89 | 31.77 |
| Total | 3.36 | 100.00 |
A simplistic analysis of hedge fund crowding that focuses on individual positions will overlook systematic exposures. Yet, they are responsible for over two thirds of the hedge fund industry’s risk. Since funds with no shared positions but similar factor exposures will correlate highly, a simplistic crowding analysis that lacks a predictive risk model will misidentify such similar funds as differentiated. This will misrepresent their risk and can foster dangerous complacency.
Hedge Fund Factor (Systematic) Crowding
Below are the principal factor exposures (in red) relative to U.S. Market’s exposures (in gray) that are responsible for the factor crowding in the above table:

Significant Absolute and Relative Factor Exposures of U.S. Hedge Fund Aggregate in Q1 2016
Of these exposures, Market (Beta) alone accounts for approximately two thirds of the relative and half of the total factor risk:
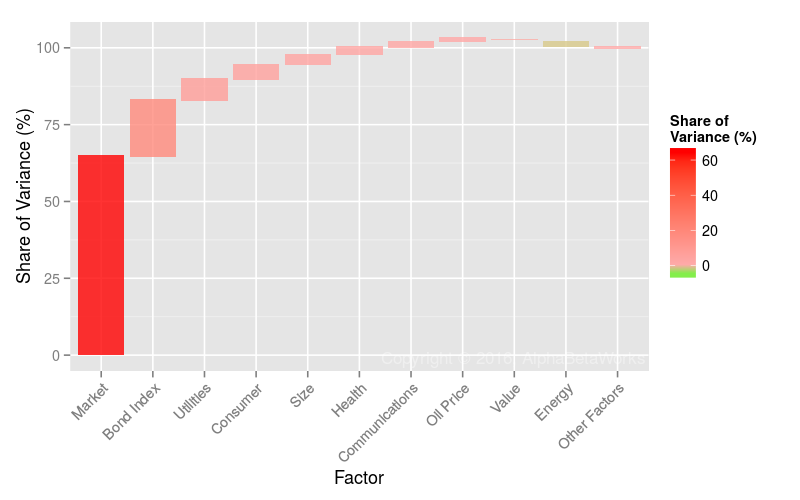
Factors Contributing Most to Relative Factor Variance of U.S. Hedge Fund Aggregate in Q1 2016
| Factor | Relative Exposure | Factor Volatility | Share of Relative Factor Variance | Share of Relative Total Variance |
| Market | 15.46 | 12.67 | 64.54 | 44.04 |
| Bond Index | -21.46 | 3.32 | 18.23 | 12.44 |
| Utilities | -3.56 | 11.75 | 6.76 | 4.61 |
| Consumer | -9.07 | 3.97 | 4.74 | 3.23 |
| Size | -3.59 | 8.39 | 3.30 | 2.25 |
| Health | 3.44 | 7.29 | 2.48 | 1.69 |
| Energy | -2.50 | 13.17 | -2.42 | -1.65 |
| Communications | -1.17 | 12.02 | 1.82 | 1.24 |
| Oil Price | 0.18 | 30.91 | 0.99 | 0.68 |
| Value | -1.00 | 13.21 | -0.74 | -0.51 |
(Relative exposures and relative variance contribution. All values are in %. Volatility is annualized.)
The U.S. hedge fund industry’s most crowded bet is not a stock, or stocks, it is high systematic exposure to the U.S. Market. This makes the popular fascination with fund holdings and position overlap particularly dangerous. This factor crowding explains much of recent hedge fund misery. As large asset bases continue to diminish the importance of stock-specific risk, the survival of asset managers and allocators will increasingly rely on their analysis of systematic crowding with robust and predictive factor models.
Hedge Fund U.S. Market Factor Crowding
After working to refine our historical hedge fund portfolio database with particular attention to defunct firms and survivorship bias, we have an increasingly accurate picture of HF Aggregate’s historical factor exposures. Its current Market Factor Exposure is approximately 115% (i.e. the HF Aggregate’s Market Beta is approximately 1.15). The average hedge fund long equity portfolio now carries approximately 15% more Market Exposure than the Russell 3000 ETF and approximately 20% more Market Exposure than the S&P 500 ETF:

U.S. Hedge Fund Aggregate’s U.S. Market Factor Exposure History
This Market crowding has been costly and disruptive during the recent volatility. It also partially explains the failures of simple performance and skill metrics: When portfolios carry different Market Exposure than S&P500, calculating security selection return as performance relative to S&P500 is perilous. High Market Exposure is a general risk to the industry and a source of turmoil. Since there is no relationship between Market Exposure of HF Aggregate and subsequent Market Factor return, Market Factor crowding is not a predictive indicator of future performance:

U.S. Hedge Fund Aggregate’s U.S. Market Factor Exposure History and Factor Return
Hedge Fund Bond Factor (Interest Rate) Crowding
We showed in an earlier piece that Bond (Interest Rate) Factor exposure is one of the top drivers of hedge fund long equity risk and performance. This bond risk is a natural consequence of hedge funds’ fondness for “cheap call options.” These are often levered companies with significant bond exposure: the companies’ creditors are long bonds; the companies (and their equity owners) are economically short them.
This short Bond Factor (long Interest Rate) exposure is now near record levels and is the second most important source of HF Aggregate’s Factor Crowding:

U.S. Hedge Fund Aggregate’s U.S. Bond Factor Exposure History
As with Market Factor, Bond Factor Exposure is a general risk to the industry. There is no relationship between Bond Exposure of HF Aggregate and subsequent Bond Factor return:

U.S. Hedge Fund Aggregate’s U.S. Bond Factor Exposure History and Factor Return
Hedge Fund Residual (Idiosyncratic) Crowding
As of 3/31/2016, a third of hedge fund crowding was due to residual (idiosyncratic, stock-specific) risk. Netflix (NFLX) is responsible for a quarter of it. The five most crowded stocks collectively account for half:
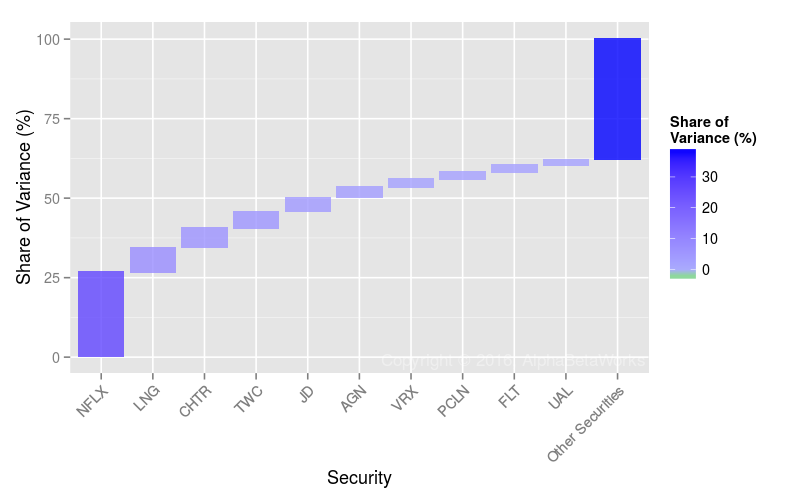
Stocks Contributing Most to Relative Residual Variance of U.S. Hedge Fund Aggregate in Q1 2016
These may be perfectly sound fundamental investments. However, they are sensitive to asset flows in and out of the industry. Given the sharp losses to residual hedge fund crowding in 2015-2016 and the tendency of liquidations to revert, crowding risk in these has diminished and the liquidation may even present long investment opportunities:
| Symbol | Name | Relative Exposure | Residual Volatility | Share of Relative Residual Variance | Share of Relative Total Variance |
| NFLX | Netflix, Inc. | 1.77 | 54.97 | 26.47 | 8.41 |
| LNG | Cheniere Energy, Inc. | 1.60 | 32.94 | 7.73 | 2.46 |
| CHTR | Charter Communications | 2.38 | 19.79 | 6.17 | 1.96 |
| TWC | Time Warner Cable Inc. | 2.74 | 15.80 | 5.22 | 1.66 |
| JD | JD.com, Inc. Sponsored ADR | 1.34 | 29.35 | 4.31 | 1.37 |
| AGN | Allergan plc | 2.06 | 17.07 | 3.43 | 1.09 |
| VRX | Valeant Pharmaceuticals International | 0.67 | 43.49 | 2.37 | 0.75 |
| PCLN | Priceline Group Inc | 1.28 | 22.17 | 2.24 | 0.71 |
| FLT | FleetCor Technologies, Inc. | 1.41 | 19.72 | 2.16 | 0.69 |
| UAL | United Continental Holdings, Inc. | 0.92 | 28.15 | 1.86 | 0.59 |
(Relative exposures and relative variance contribution. All values are in %. Volatility is annualized.)
Though these stock-specific bets are important, they account for less than a third of the entire hedge fund crowding picture. Consequently, in the current environment of extreme systematic hedge fund crowding, allocators and fund followers should continue to pay more attention to factor risk. As hedge funds’ residual volatility continues to wane, allocators owning a broadly diversified portfolio of hedge funds are increasingly at risk of paying high active fees for a passive factor portfolio.
Summary
- The main source of Q1 2016 hedge fund crowding, responsible for nearly half of relative long equity risk, was record U.S. Market exposure.
- The second most important source of Q1 2016 hedge fund crowding was near-record short Bond (long interest rate) exposure.
- Given high factor (systematic) hedge fund long equity crowding, analysis of crowding risks must focus on factor exposures, rather than individual positions.


