There is a large difference between momentum strategies in theory and in practice. Given that much of its model performance derives from illiquid securities and high turnover, the academic momentum factor is a theoretical ideal that is not directly investable. Consequently, real-world momentum products, such as momentum ETFs, are restricted to investable liquid securities and usually reduce the approximately 200% annual turnover of theoretical momentum portfolios. After these modifications, their idiosyncratic momentum returns mostly vanish.
We consider a popular momentum ETF and illustrate that its historical performance is almost entirely attributable to passive exposures to simple non-momentum factors, such as Market and Sectors. Investors may thus be able to achieve and even surpass the performance of popular momentum ETFs with transparent, passive, and potentially lower-cost portfolios of simpler funds.
Attributing the Performance of Momentum ETFs to Simpler Factors
We analyzed iShares MSCI USA Momentum Factor ETF (MTUM) using the AlphaBetaWorks Statistical Equity Risk Model – a proven tool for forecasting portfolio risk and performance. We estimated monthly positions from regulatory filings, retrieved positions’ factor (systematic) exposures, and aggregated these. This produced a series of monthly portfolio exposures to simple investable risk factors such as Market, Sector, and Size. The factor exposures at the end of Month 1 and factor returns during Month 2 are used to calculate factor returns during Month 2 and any residual (security-selection, idiosyncratic, stock-specific) returns un-attributable to factors.
There are only two ways for a fund to deviate from a passive portfolio: residual returns un-attributable to factors and factor timing returns due to variation in factor exposures over time. We define and measure both components below.
iShares MSCI USA Momentum Factor (MTUM): Performance Attribution
We used iShares MSCI USA Momentum Factor (MTUM) as an example of a practical implementation of a theoretical momentum portfolio. MTUM is a $1.1bil ETF that seeks to track an index of U.S. large- and mid-cap stocks with high momentum. The fund’s turnover, around 100% annually, is about half that of the theoretical momentum factor.
iShares MSCI USA Momentum Factor (MTUM): Factor Exposures
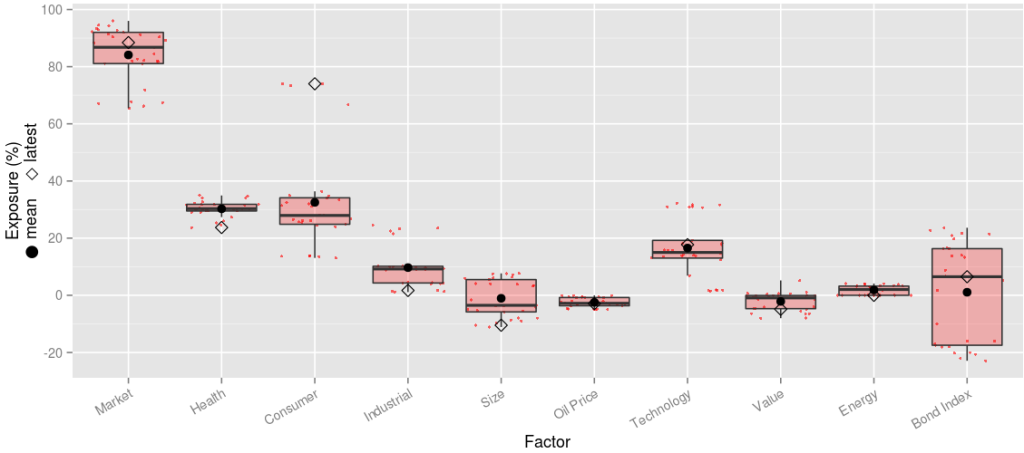
The following factors are responsible for most of the historical returns and variance of MTUM:
| Latest | Mean | Min. | Max. | |
| Market | 88.44 | 84.12 | 65.46 | 96.03 |
| Health | 23.73 | 30.28 | 23.73 | 34.94 |
| Consumer | 74.02 | 32.53 | 13.10 | 74.06 |
| Industrial | 1.69 | 9.71 | 1.13 | 24.51 |
| Size | -10.47 | -1.04 | -11.09 | 7.67 |
| Oil Price | -2.90 | -2.45 | -4.94 | -0.04 |
| Technology | 17.72 | 16.56 | 1.50 | 32.29 |
| Value | -4.86 | -2.13 | -8.00 | 5.20 |
| Energy | 0.00 | 1.86 | 0.00 | 4.12 |
| Bond Index | 6.51 | 1.08 | -22.90 | 23.64 |
iShares MSCI USA Momentum Factor (MTUM): Active Return
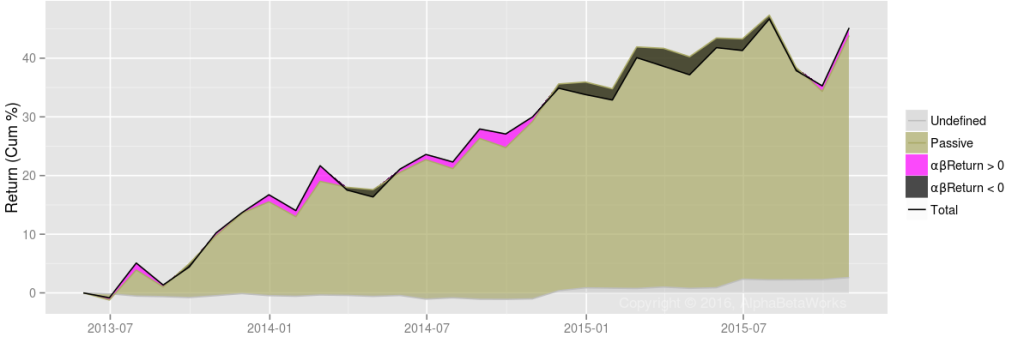
To replicate MTUM with simple non-momentum factors, one can use a passive portfolio of these simple non-momentum factors with MTUM’s mean exposures as weights. This portfolio defined the Passive Return in the following chart. Active return, or αβReturn, is the performance in excess of this passive replicating portfolio. It is the active return due to residual stock performance and factor timing:
MTUM’s performance closely tracks the passive replicating portfolio. Pearson’s correlation between Total Return and Passive Return is 0.96. Consequently, 93% of the variance of monthly returns is attributable to passive factor exposures, primarily to Market and Sector factors.
Once passive exposures to simpler factors have been removed, MTUM’s active return is negligible. Since MTUM’s launch, the cumulative return difference from such passive replicating portfolio has been approximately 1%:
| 2013 | 2014 | 2015 | Total | |
| Total Return | 16.73 | 14.62 | 8.50 | 45.18 |
| Passive Return | 16.06 | 16.48 | 4.55 | 41.34 |
| αβReturn | 1.11 | -2.46 | 2.54 | 1.12 |
| αReturn | 3.91 | 0.05 | 0.29 | 4.27 |
| βReturn | -2.71 | -2.52 | 2.23 | -3.05 |
This active return can be further decomposed into security selection (αReturn) and factor timing (βReturn). These active return components generated low volatility, around 1% annually, mostly offsetting each other as illustrated below:
iShares MSCI USA Momentum Factor (MTUM): Active Return from Security Selection
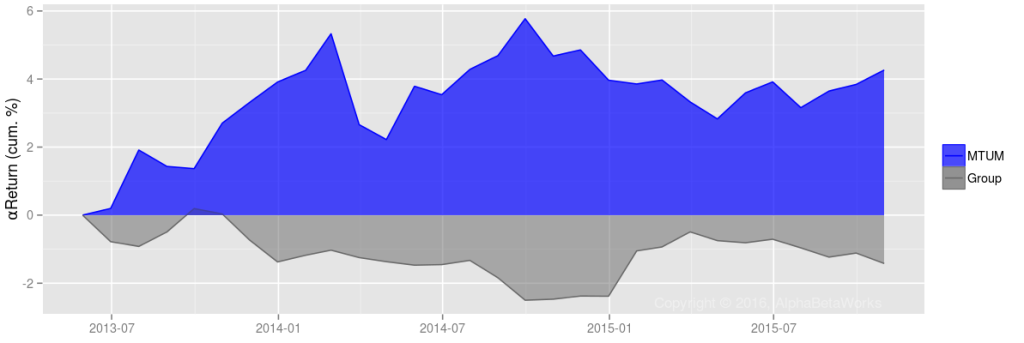
AlphaBetaWorks’ measure of residual security selection performance is αReturn – performance relative to a factor portfolio that matches the funds’ historical factor exposures. αReturn is the return a fund would have generated if markets had been flat. MTUM has generated approximately 4% cumulative αReturn, primarily in 2013, compared to roughly 1.5% decline for the average U.S. equity ETF:
iShares MSCI USA Momentum Factor (MTUM): Active Return from Factor Timing
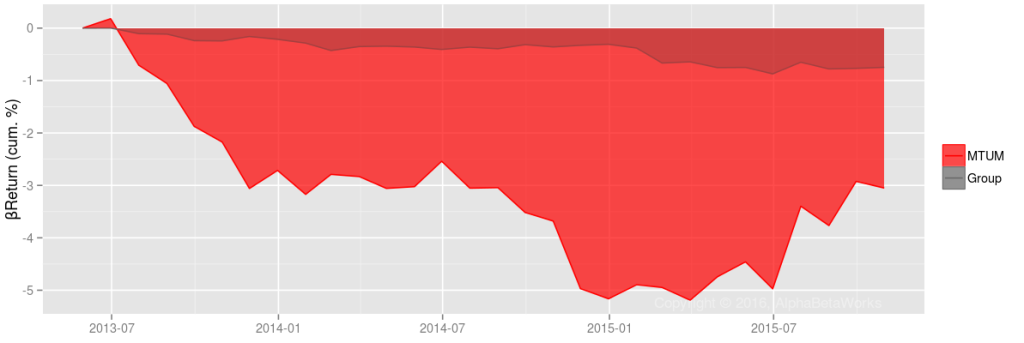
AlphaBetaWorks’ measure of factor timing performance is βReturn – performance due to variation in factor exposures. βReturn is the fund’s outperformance relative to a portfolio with the same mean, but constant, factor exposures as the fund. MTUM generates approximately -3% cumulative βReturn, compared to a roughly 1% decline for the average U.S. equity ETF:
These low active returns are consistent with our earlier findings that many “smart beta” funds are merely high-beta and offer no value over portfolios of conventional dumb-beta funds. It is thus vital to test any new resident of the Factor Zoo to determine whether they are merely exotic breeds of its more boring residents.
Conclusion
- Theoretical, or academic, momentum portfolios are not directly investable.
- A popular momentum ETF, MSCI USA Momentum Factor (MTUM), did not deviate significantly from a passive portfolio of simpler non-momentum factors.
- Investors may be able to achieve and surpass the performance of the popular momentum ETFs with transparent, passive, and potentially lower-cost portfolios of simpler index funds and ETFs.


Hi! Your posts are usually very insightful. I especially like the HF crowding series. However, in this case I really cannot understand how you arrive at your conclusions. Am I missing something?
1. Theoretical momentum not investable – OK, due to illiquidity. MTUM is not quite “that one” momentum – agreed.
2. MTUM can be explained by non-momentum factors – true, but the simpler factors you use are quite numerous. First, hardly any practitioner would use all of them at once. So, in this sense your replication of the MTUM does not seem much more “investable” than the theoretical momentum. Second, if I understand correctly how financial statistics works, with the increase of the number of factors, even if MTUM were driven by genuine pure momentum factor, you would come very close to its replication with that many factors, in a purely statistical sense.
3. Investors can replicate MTUM with simpler and cheaper methods – how? Can you suggest a method of EX ANTE replication? I believe it is unlikely that those Mean factor exposures are anywhere stable outside the short time period of your analysis.
I will appreciate your answer. Thank you!
Michael,
Thanks for bringing up a variety of important points which, because of its narrow focus, the piece did not cover adequately:
“simpler factors you use are quite numerous … hardly any practitioner would use all of them at once”
Factors have two distinct but related uses: Risk forecasting/performance attribution and portfolio construction.
– A typical commercial risk model first accounts for variance using Market and then Sector Factors since these capture the largest slices of variance. In this case, the question is whether further adding Momentum factor adds descriptive power to justify increased model complexity. For theoretical/academic portfolios, it does. For a real-world broadly investable portfolio such as MTUM, it does not.
– Practitioners’ use of factors sounds like a matter of one’s experience. I don’t have standing to argue the general point of what most do. If one does not already run a deliberate sector allocation process, it is certainly harder to manage a dozen exposures than to purchase a single security. So you may be right about a typical practitioner and our experience could be atypical: Most users of our apps, licensees of our risk models, and portfolio managers/allocators we’ve consulted for manage their Market and Sector risk carefully and deliberately. So they are already using all of the simpler non-momentum factors in their process and incorporating a desired tilt in these towards MTUM or a related trend-following strategy is easy and occasionally done.
“if I understand correctly how financial statistics works, with the increase of the number of factors, even if MTUM were driven by genuine pure momentum factor, you would come very close to its replication with that many factors, in a purely statistical sense”
You are right. It is natural and expected that some conceivable factors can be expressed as a linear combination of other factors. This does not make the underlying effects less real, but it does mean that a model should be parsimonious and stick to the smallest basis of factors that is adequately descriptive and predictive.
“Investors can replicate MTUM with simpler and cheaper methods – how? Can you suggest a method of EX ANTE replication? I believe it is unlikely that those Mean factor exposures are anywhere stable outside the short time period of your analysis.”
– Let’s set aside the topic of a truly passive portfolio of mean exposures over a given period. It is somewhat lengthy to show how it relates to ex-ante portfolios (though it does).
– Let’s also make the task more challenging and more realistic by only using 1 Market and 10 Sector Factors, excluding Style, etc.. Sector Factors are binary — each security is only described by 2 Factors. We’ll replicate all factor exposures: both static (average) and dynamic (deviations from the average). Suppose we observe and match MTUM’s Market and Sector Exposures at the end of Month 1 (ex-ante). Then the correlation between Month 2 (ex-post) returns of MTUM and of the replicating portfolio is 0.97. This is a slightly closer fit since all that’s remains are the residuals (αReturns). For those managing their Market and Sector exposures, this replication is straightforward.
– Another point in the article should have been made more explicitly: At 0.15% management fee and ~1% Bid/Ask spread, MTUM is not particularly expensive. We also examined a number of other momentum funds (most more expensive) reaching similar conclusions, but did not cover them to keep the article focused.
Thanks again for killer questions that filled key areas.
Thank you for the most elaborate reply.
Indeed, I was looking at it from a fundamental bottom-up equity portfolio manager perspective, not a risk manager or allocator perspective. Probably not your typical reader. You are obviously right that those factors are quite basic in any advanced risk management system.
A follow-up question on MTUM replication with simple sector exposures, if I may. To arrive at 0.97 correlation you mentioned:
1) what was the period under analysis?
2) are the sector exposures of MTUM at month-end (which are to be replicated) taken directly from ETF’s disclosed holdings or inferred from some trailing regression? If the latter, what was the trailing period?
Thanks!
Thanks again for the chance to fill in the details of the article:
1) what was the period under analysis?
The analysis covers the history of MTUM since inception in 4/2013. At the time of the analysis it included 31 monthly observations.
2) are the sector exposures of MTUM at month-end (which are to be replicated) taken directly from ETF’s disclosed holdings or inferred from some trailing regression? If the latter, what was the trailing period?
The factor exposures of MTUM are based on the month-end holdings as reported in the regulatory filings and at the issuer’s site (https://www.ishares.com/us/251614/fund-download.dl). These holdings are then analyzed with a statistical equity risk model and their exposures aggregated. However, it is not critical to know the latest portfolio. Since the correlation with a portfolio of average factor exposures (0.96) is also high, you can use quarterly or even annual factor exposures when replicating MTUM and still get a close match.
Note that there are a variety of problems with returns based style analysis (https://abwinsights.com/2014/06/14/the-flaws-of-returns-based-style-analysis/, https://abwinsights.com/2015/01/04/returns-based-style-analysis-overfitting-collinearity/). It certainly can’t estimate exposures to Sector Factors effectively. So trailing regression would probably have failed to give good predictions in this case.
Also note that that simple analysis of capital invested in a sector will not give you the correct sector exposures as used in the article. A 10% capital weighting in a sector can have 5% or 20% exposure to the Sector Factor, depending on the risk of the holdings within that 10%, say their financial or operating leverage.
Hope this clarifies things further and thanks again for the dive into the details.
Thanks for the answer and the interesting links!